| Param | Original file | Final file |
|---|---|---|
| Filename | modeM0/AS1A11_075T01_9000005342_37659cztM0_level2.evt | modeM0/AS1A11_075T01_9000005342_37659cztM0_level2_quad_clean.evt |
| Size (bytes) | 812,436,480 | 118,249,920 |
| Size | 774.8 MB | 112.8 MB |
| Events in quadrant A | 5,713,865 | 713,675 |
| Events in quadrant B | 5,471,783 | 729,306 |
| Events in quadrant C | 5,161,812 | 731,501 |
| Events in quadrant D | 7,550,104 | 682,314 |
| Mode SS | |||
|---|---|---|---|
| Quadrant | BADHDUFLAG | Total packets | Discarded packets |
| A | 0 | 214 | 0 |
| B | 0 | 214 | 0 |
| C | 0 | 214 | 0 |
| D | 0 | 214 | 0 |
| Mode M0 | |||
|---|---|---|---|
| Quadrant | BADHDUFLAG | Total packets | Discarded packets |
| A | 0 | 23058 | 3 |
| B | 0 | 22833 | 2 |
| C | 0 | 21396 | 2 |
| D | 0 | 29497 | 2 |
| Mode M9 | |||
|---|---|---|---|
| Quadrant | BADHDUFLAG | Total packets | Discarded packets |
| A | 0 | 28 | 0 |
| B | 0 | 28 | 0 |
| C | 0 | 28 | 0 |
| D | 0 | 28 | 0 |
| Quadrant | Total seconds | Saturated seconds | Saturation percentage |
|---|---|---|---|
| A | 10454 | 44 | 0.420892% |
| B | 10454 | 201 | 1.922709% |
| C | 10454 | 14 | 0.133920% |
| D | 10454 | 449 | 4.295007% |
Noise dominated data is calculated using 1-second bins in cleaned event files. If a bin has >2000 counts, and if more than 50% of those come from <1% of pixels, then it is considered to be noise-dominated and hence unusable.
| Quadrant | # 1 sec bins | Bins with >0 counts | Bins with >2000 counts | High rate bins dominated by noise | Noise dominated (total time) | Noise dominated (detector-on time) | Marked lightcurve |
|---|---|---|---|---|---|---|---|
| A | 13291 | 10456 | 37 | 37 | 0.28% | 0.35% | 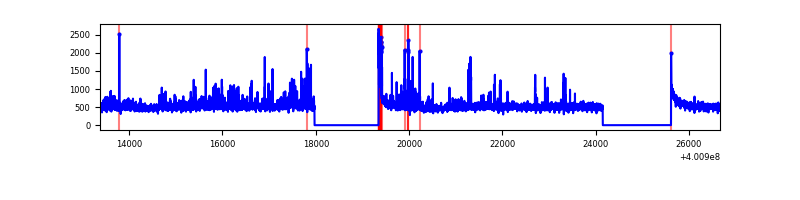 |
| B | 13291 | 10454 | 123 | 123 | 0.93% | 1.18% | 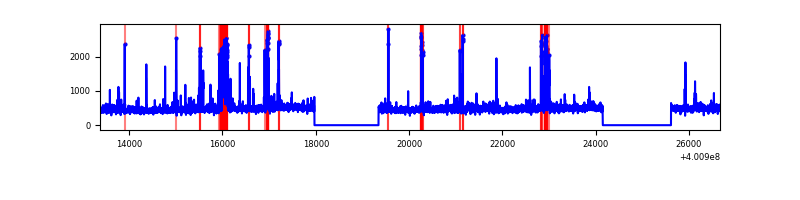 |
| C | 13291 | 10454 | 8 | 8 | 0.06% | 0.08% | 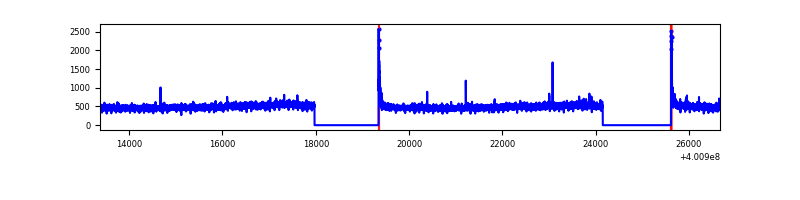 |
| D | 13291 | 10454 | 427 | 427 | 3.21% | 4.08% | 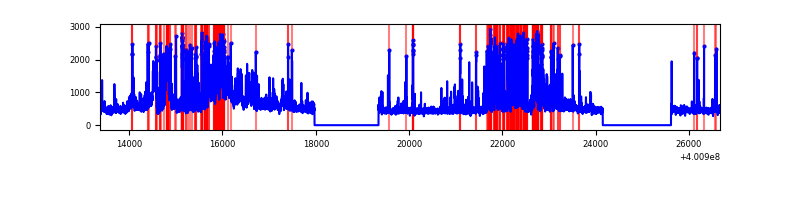 |
Top three noisy pixels from each quadrant. If the there are fewer than three noisy pixels in the level2.evt file, extra rows are filled as -1
| Pixel properties | Quadrant properties | ||||||
|---|---|---|---|---|---|---|---|
| Quadrant | DetID | PixID | Counts | Sigma | Mean | Median | Sigma |
| A | 10 | 83 | 499889 | 2059.88 | 1204 | 1179 | 242.1 |
| A | 15 | 222 | 444369 | 1830.56 | 1204 | 1179 | 242.1 |
| A | 9 | 143 | 60639 | 245.59 | 1204 | 1179 | 242.1 |
| B | 5 | 172 | 482266 | 2085.26 | 1194 | 1160 | 230.7 |
| B | 5 | 200 | 77261 | 329.84 | 1194 | 1160 | 230.7 |
| B | 0 | 230 | 74607 | 318.34 | 1194 | 1160 | 230.7 |
| C | 15 | 214 | 474052 | 1735.04 | 1176 | 1183 | 272.5 |
| C | 0 | 10 | 70048 | 252.68 | 1176 | 1183 | 272.5 |
| C | 15 | 159 | 14049 | 47.21 | 1176 | 1183 | 272.5 |
| D | 12 | 227 | 1230707 | 4377.88 | 1157 | 1125 | 280.9 |
| D | 4 | 239 | 772399 | 2746.09 | 1157 | 1125 | 280.9 |
| D | 13 | 249 | 259968 | 921.6 | 1157 | 1125 | 280.9 |
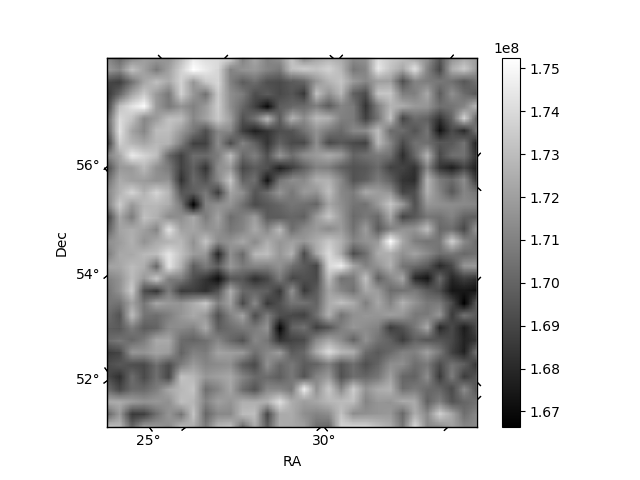
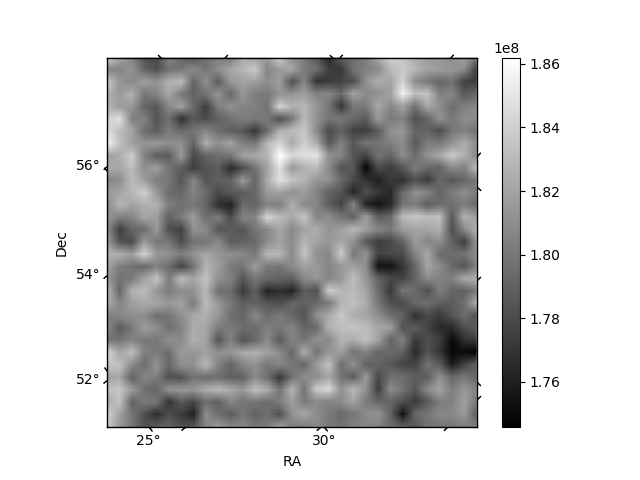
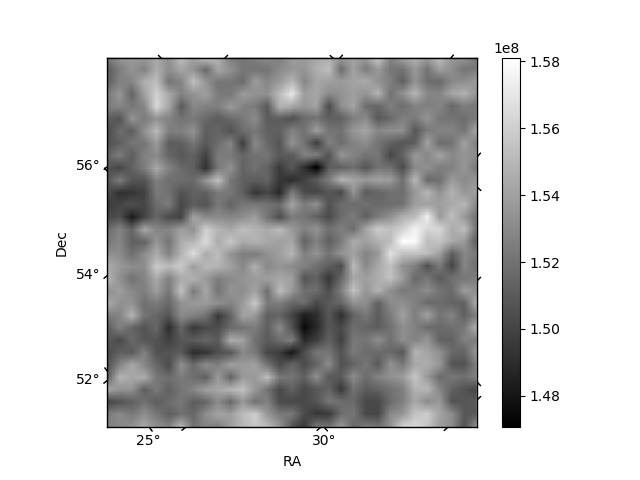
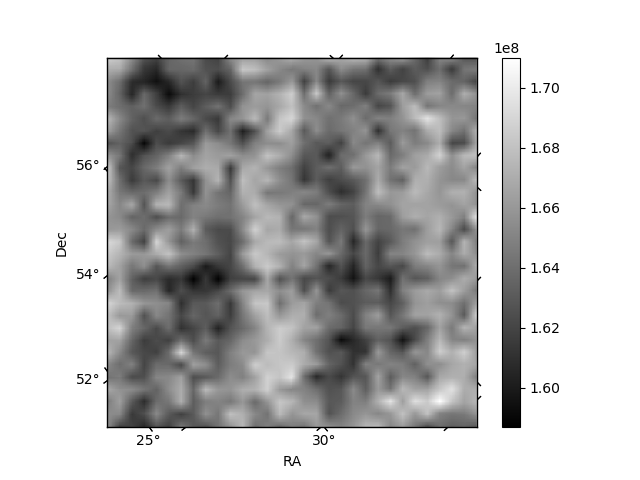
Histogram calculated using DETX and DETY for each event in the final _common_clean file
| Quadrant A | 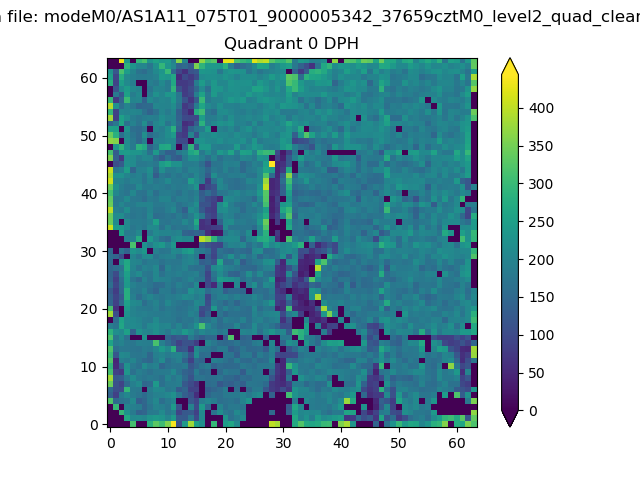 |
 |
Quadrant B |
|---|---|---|---|
| Quadrant D | 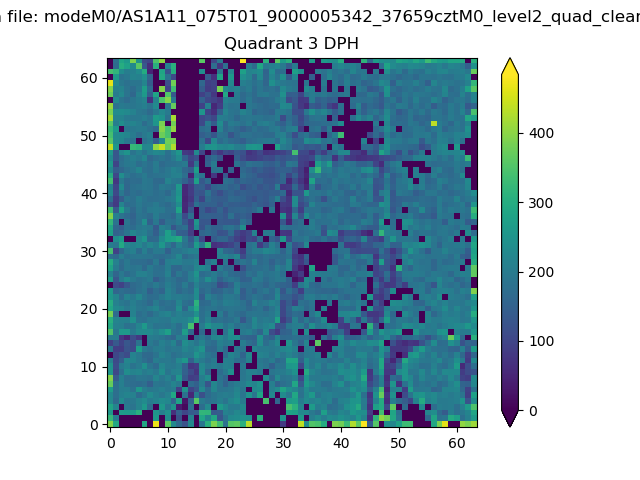 |
 |
Quadrant C |
| Plot type | Count rate plots | Images |
|---|---|---|
| Comparison with Poisson distribution Blue bars denote a histogram of data divided into 1 sec bins. Red curve is a Poisson curve with rate = median count rate of data. |
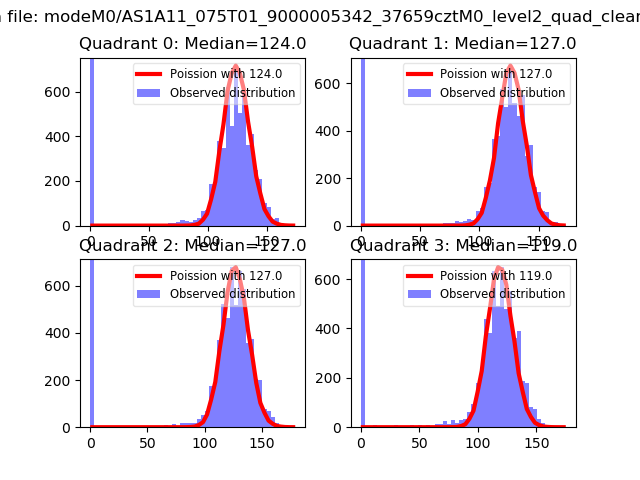 |
 |
| Quadrant-wise count rates Data is divided into 100 sec bins |
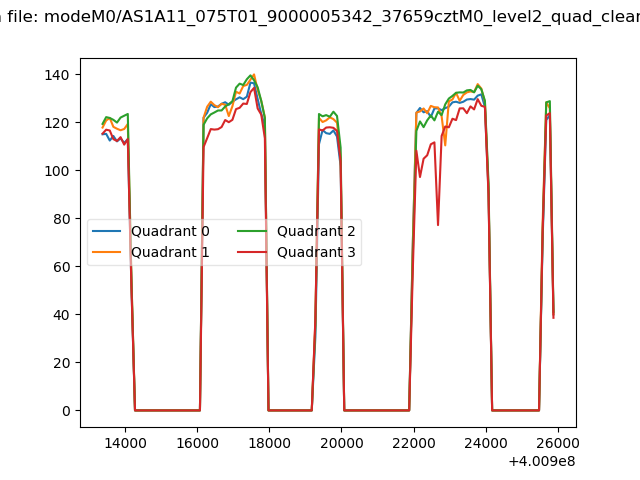 |
|
| Module-wise count rates for Quadrant A Data is divided into 100 sec bins |
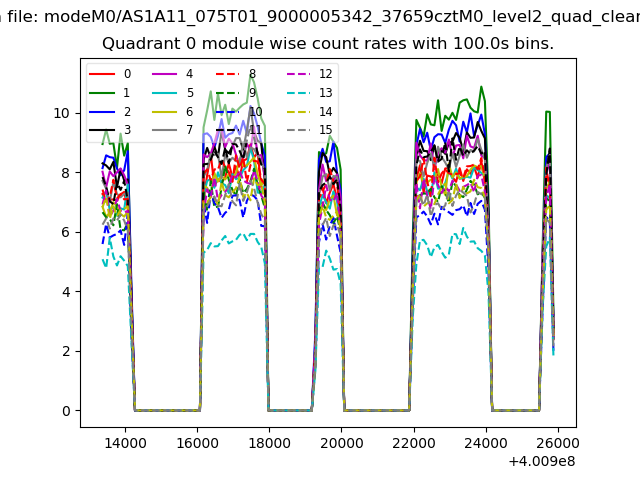 |
 |
| Module-wise count rates for Quadrant B Data is divided into 100 sec bins |
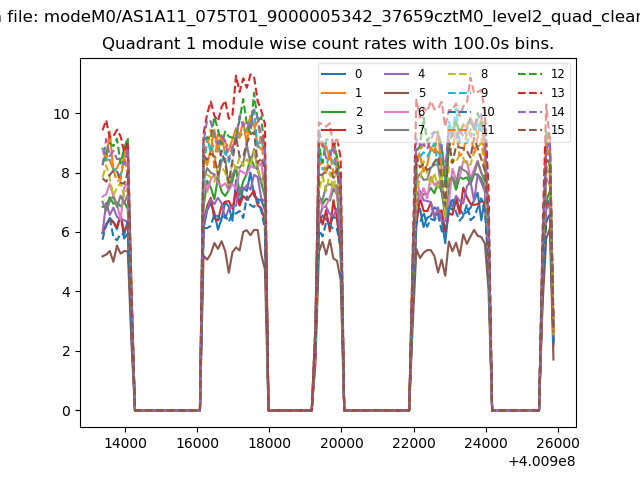 |
 |
| Module-wise count rates for Quadrant C Data is divided into 100 sec bins |
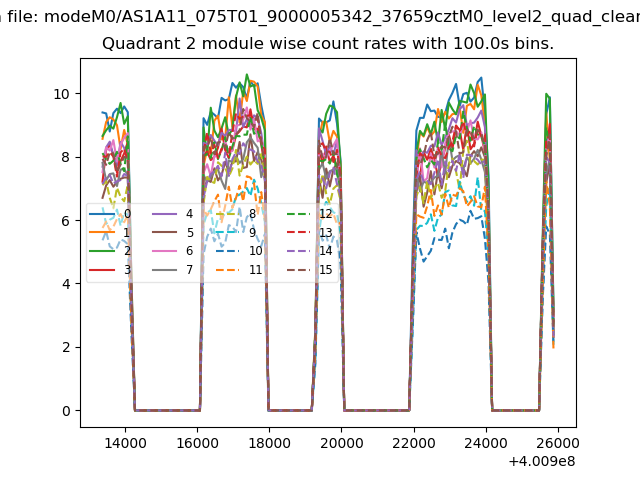 |
 |
| Module-wise count rates for Quadrant D Data is divided into 100 sec bins |
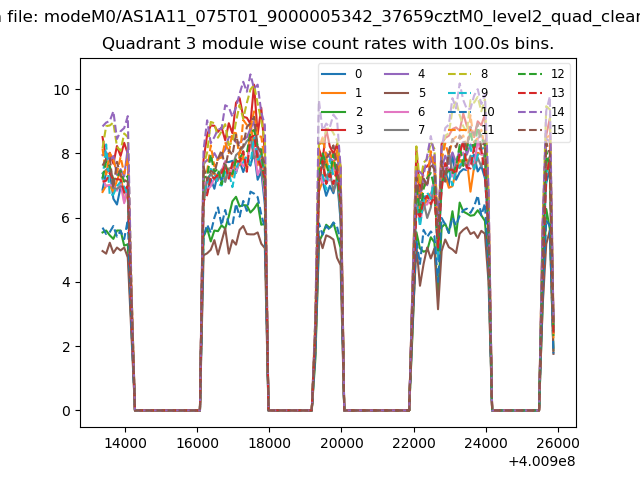 |
 |
| Parameter | Plot |
|---|---|
| CZT HV Monitor | 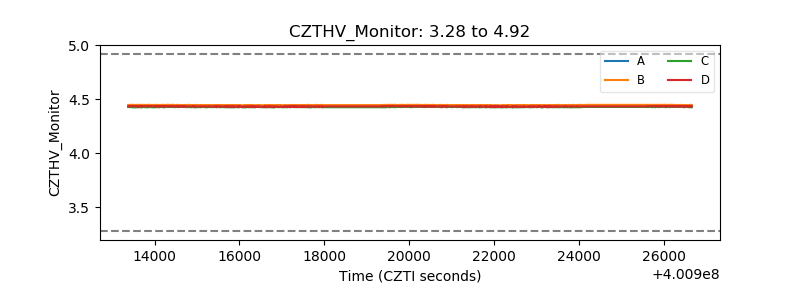 |
| D_VDD | 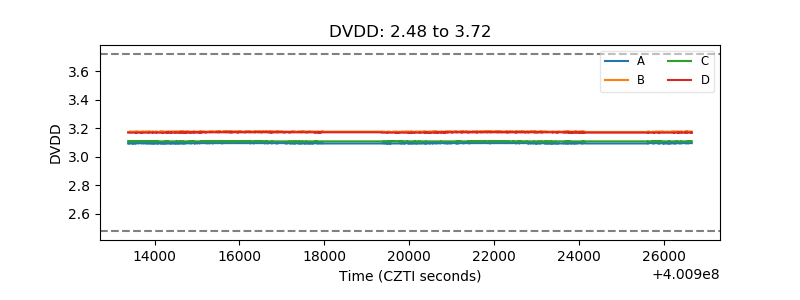 |
| Temperature 1 |  |
| Veto HV Monitor |  |
| Veto LLD | 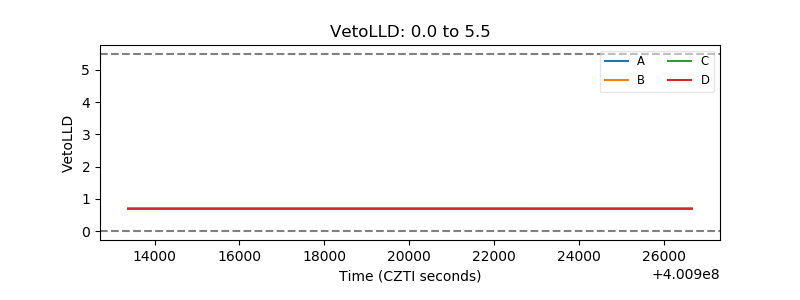 |
| Alpha Counter | 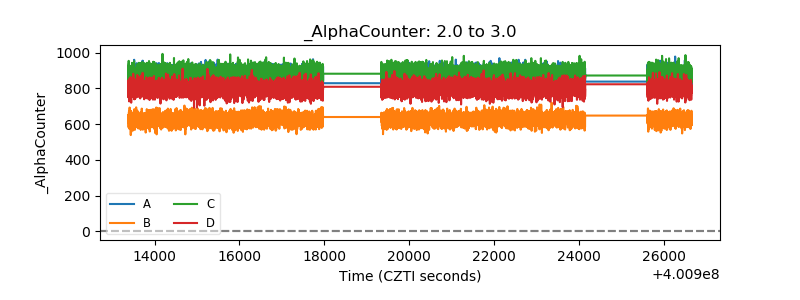 |
| _CPM_Rate | 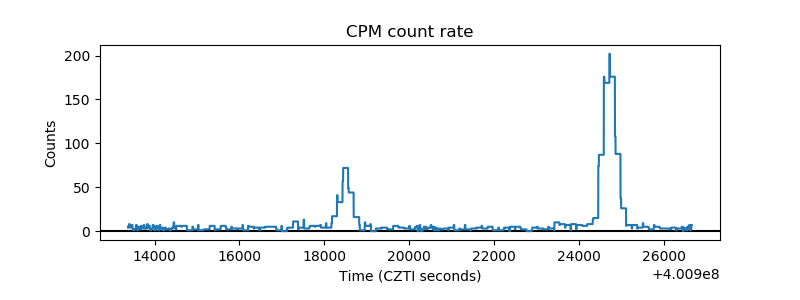 |
| CZT Counter | 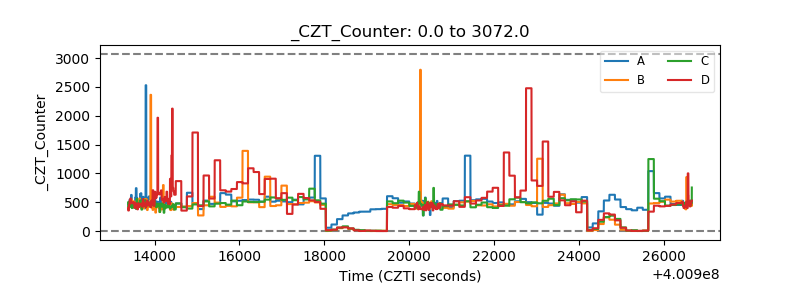 |
| +2.5 Volts monitor |  |
| +5 Volts monitor | 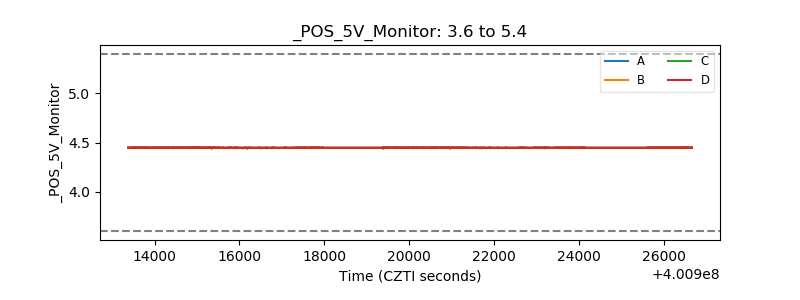 |
| _ROLL_ROT | 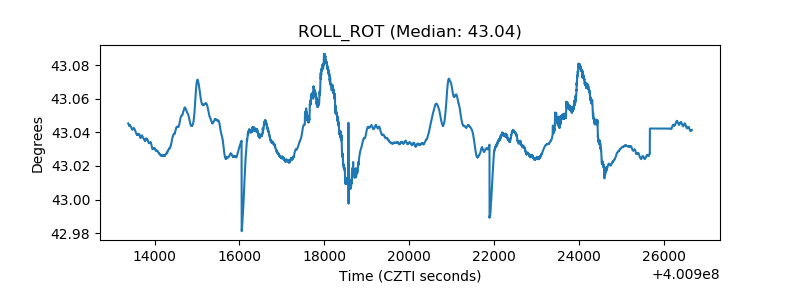 |
| _Roll_DEC | 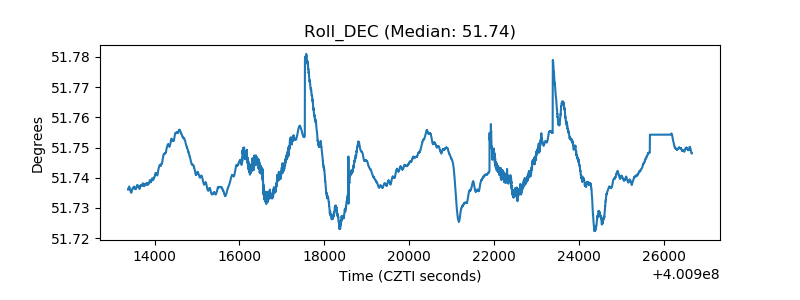 |
| _Roll_RA |  |
| Veto Counter | 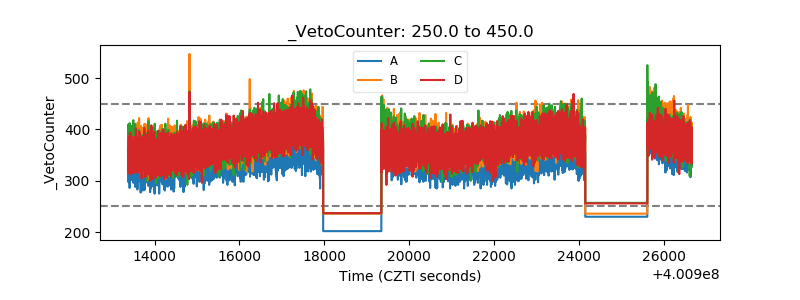 |