| Param | Original file | Final file |
|---|---|---|
| Filename | modeM0/AS1A11_075T01_9000005342_37708cztM0_level2.evt | modeM0/AS1A11_075T01_9000005342_37708cztM0_level2_quad_clean.evt |
| Size (bytes) | 486,158,400 | 75,297,600 |
| Size | 463.6 MB | 71.8 MB |
| Events in quadrant A | 5,070,887 | 472,220 |
| Events in quadrant B | 2,883,283 | 495,662 |
| Events in quadrant C | 2,870,306 | 492,669 |
| Events in quadrant D | 3,556,596 | 465,186 |
| Mode SS | |||
|---|---|---|---|
| Quadrant | BADHDUFLAG | Total packets | Discarded packets |
| A | 0 | 104 | 0 |
| B | 0 | 104 | 0 |
| C | 0 | 104 | 0 |
| D | 0 | 104 | 0 |
| Mode M0 | |||
|---|---|---|---|
| Quadrant | BADHDUFLAG | Total packets | Discarded packets |
| A | 0 | 18429 | 3 |
| B | 0 | 11616 | 2 |
| C | 0 | 11486 | 2 |
| D | 0 | 13907 | 2 |
| Mode M9 | |||
|---|---|---|---|
| Quadrant | BADHDUFLAG | Total packets | Discarded packets |
| A | 0 | 31 | 0 |
| B | 0 | 31 | 0 |
| C | 0 | 31 | 0 |
| D | 0 | 32 | 0 |
| Quadrant | Total seconds | Saturated seconds | Saturation percentage |
|---|---|---|---|
| A | 5050 | 436 | 8.633663% |
| B | 5050 | 63 | 1.247525% |
| C | 5050 | 44 | 0.871287% |
| D | 5050 | 221 | 4.376238% |
Noise dominated data is calculated using 1-second bins in cleaned event files. If a bin has >2000 counts, and if more than 50% of those come from <1% of pixels, then it is considered to be noise-dominated and hence unusable.
| Quadrant | # 1 sec bins | Bins with >0 counts | Bins with >2000 counts | High rate bins dominated by noise | Noise dominated (total time) | Noise dominated (detector-on time) | Marked lightcurve |
|---|---|---|---|---|---|---|---|
| A | 7083 | 5051 | 387 | 387 | 5.46% | 7.66% | 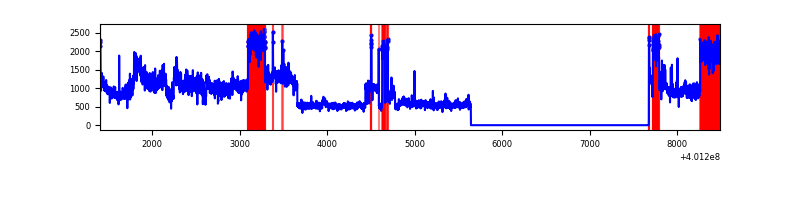 |
| B | 7082 | 5049 | 47 | 47 | 0.66% | 0.93% | 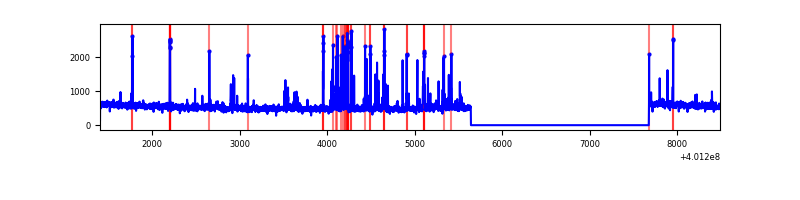 |
| C | 7082 | 5049 | 37 | 37 | 0.52% | 0.73% | 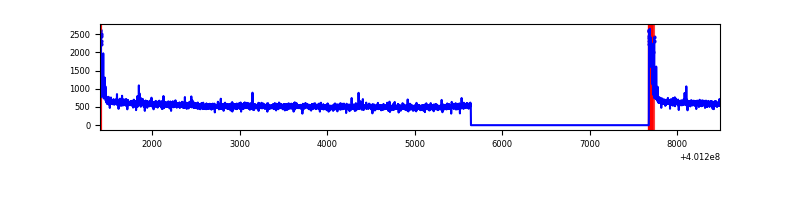 |
| D | 7082 | 5049 | 201 | 201 | 2.84% | 3.98% | 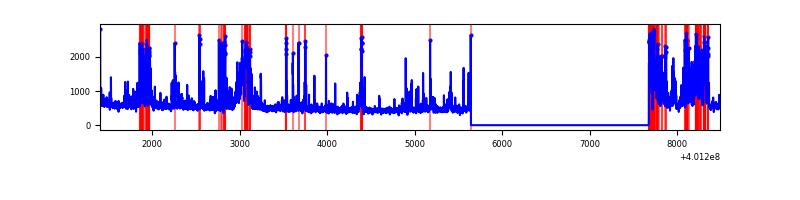 |
Top three noisy pixels from each quadrant. If the there are fewer than three noisy pixels in the level2.evt file, extra rows are filled as -1
| Pixel properties | Quadrant properties | ||||||
|---|---|---|---|---|---|---|---|
| Quadrant | DetID | PixID | Counts | Sigma | Mean | Median | Sigma |
| A | 15 | 222 | 2216376 | 17464.57 | 641 | 631 | 126.9 |
| A | 10 | 83 | 310807 | 2444.82 | 641 | 631 | 126.9 |
| A | 9 | 143 | 37970 | 294.31 | 641 | 631 | 126.9 |
| B | 5 | 172 | 200120 | 1657.4 | 644 | 629 | 120.4 |
| B | 5 | 200 | 34102 | 278.1 | 644 | 629 | 120.4 |
| B | 0 | 230 | 32538 | 265.1 | 644 | 629 | 120.4 |
| C | 15 | 214 | 229641 | 1581.17 | 637 | 645 | 144.8 |
| C | 0 | 10 | 144899 | 996.05 | 637 | 645 | 144.8 |
| C | 13 | 61 | 4511 | 26.69 | 637 | 645 | 144.8 |
| D | 12 | 227 | 354407 | 2341.82 | 627 | 610 | 151.1 |
| D | 2 | 250 | 263345 | 1739.07 | 627 | 610 | 151.1 |
| D | 2 | 153 | 183359 | 1209.63 | 627 | 610 | 151.1 |
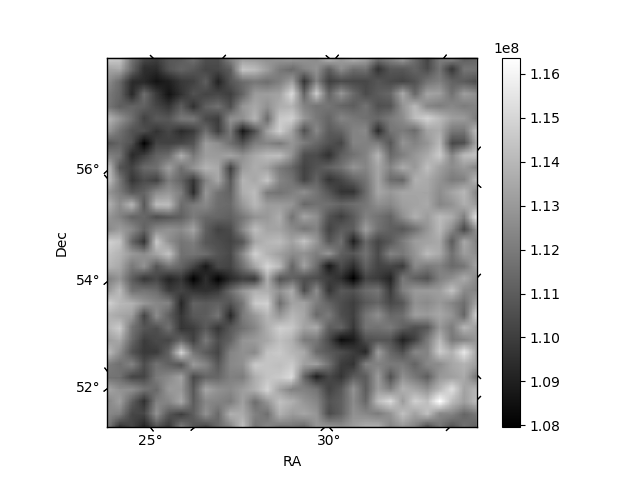
Histogram calculated using DETX and DETY for each event in the final _common_clean file
| Quadrant A | 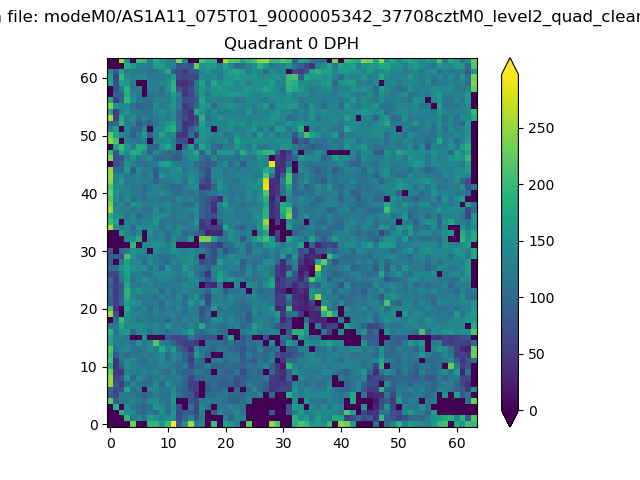 |
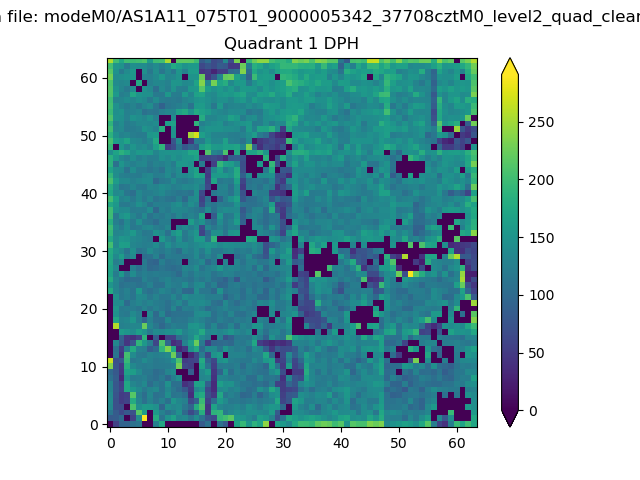 |
Quadrant B |
|---|---|---|---|
| Quadrant D | 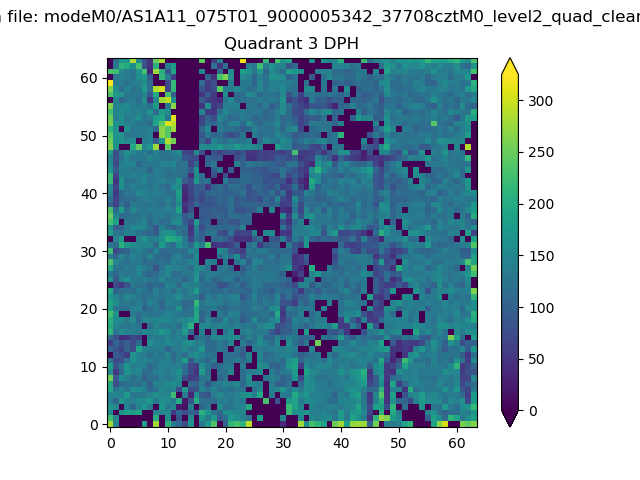 |
 |
Quadrant C |
| Plot type | Count rate plots | Images |
|---|---|---|
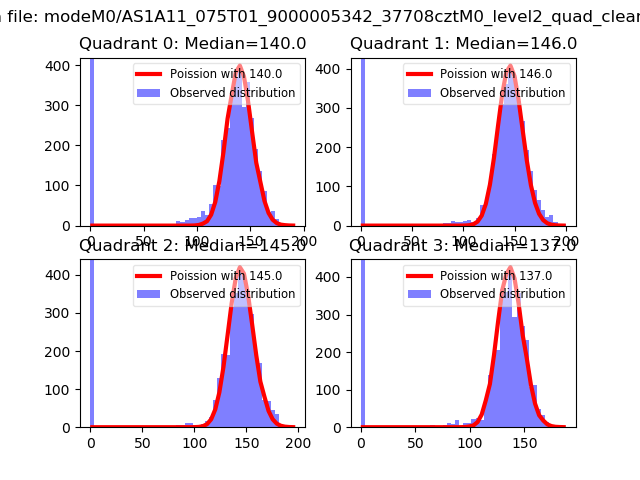
| Comparison with Poisson distribution Blue bars denote a histogram of data divided into 1 sec bins. Red curve is a Poisson curve with rate = median count rate of data. |
 |
 |
| Quadrant-wise count rates Data is divided into 100 sec bins |
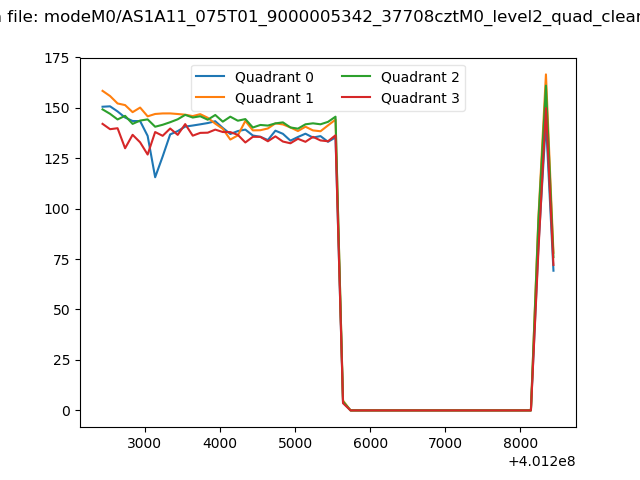 |
|
| Module-wise count rates for Quadrant A Data is divided into 100 sec bins |
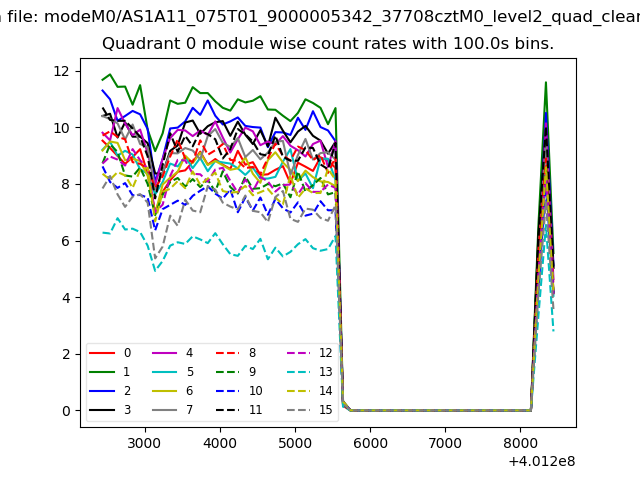 |
 |
| Module-wise count rates for Quadrant B Data is divided into 100 sec bins |
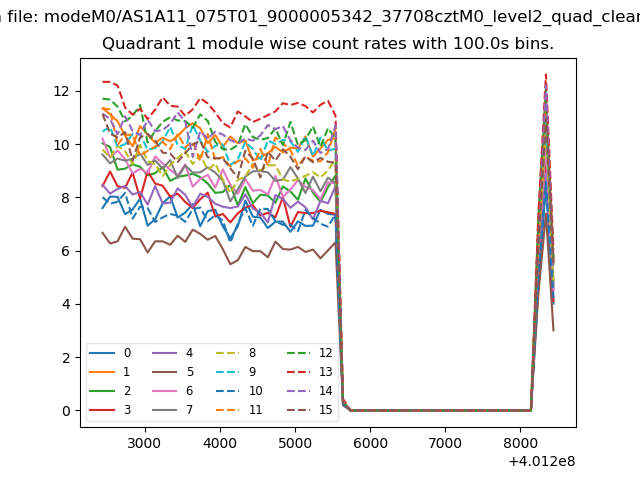 |
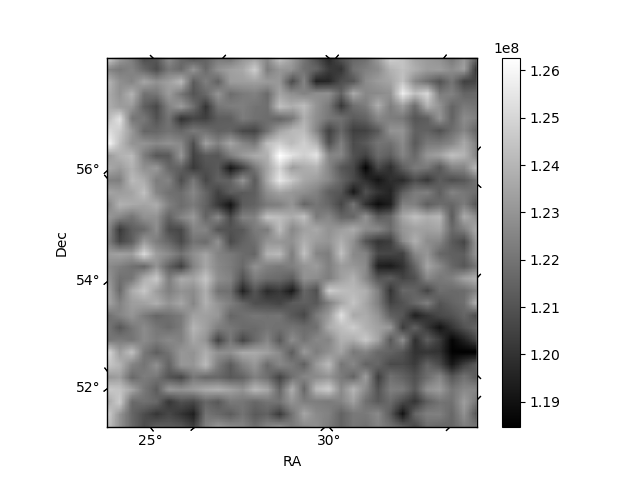 |
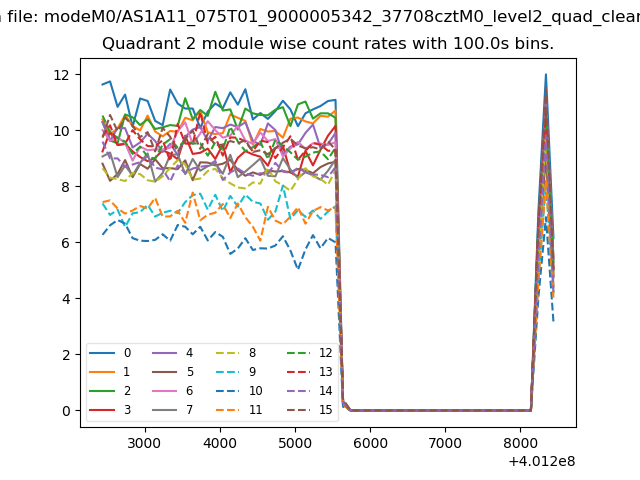
| Module-wise count rates for Quadrant C Data is divided into 100 sec bins |
 |
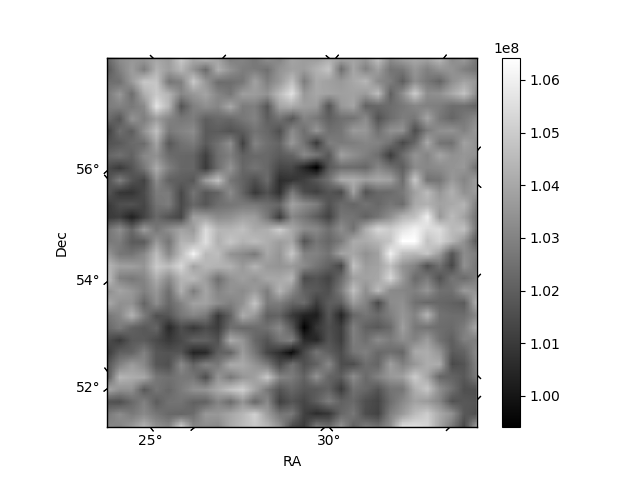 |
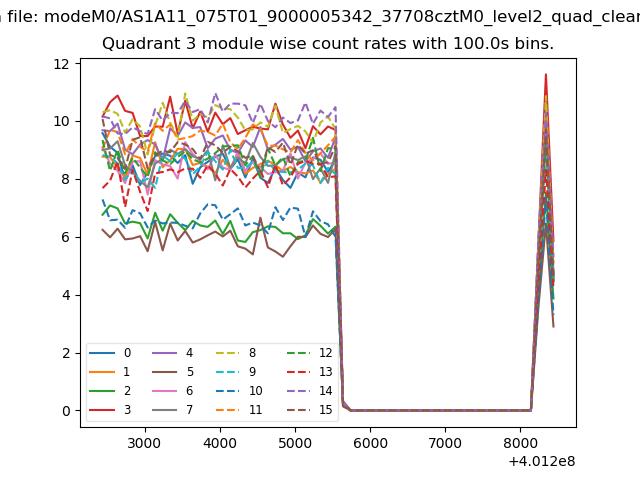
| Module-wise count rates for Quadrant D Data is divided into 100 sec bins |
 |
 |
| Parameter | Plot |
|---|---|
| CZT HV Monitor | 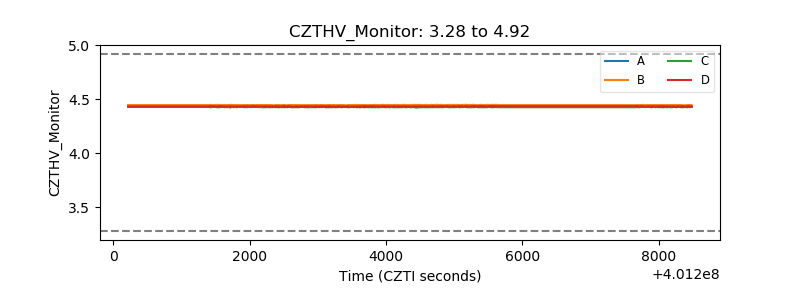 |
| D_VDD | 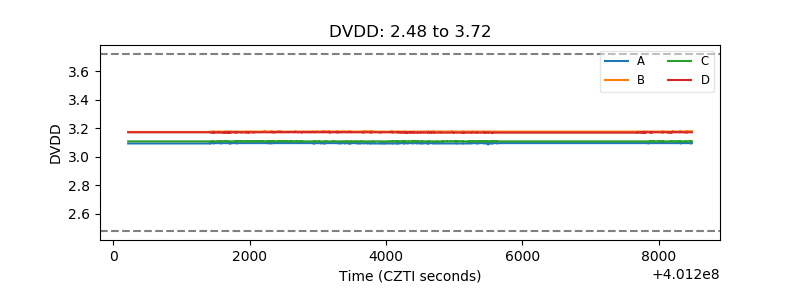 |
| Temperature 1 | 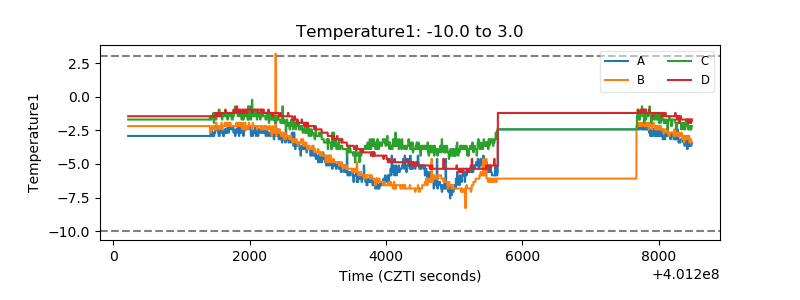 |
| Veto HV Monitor | 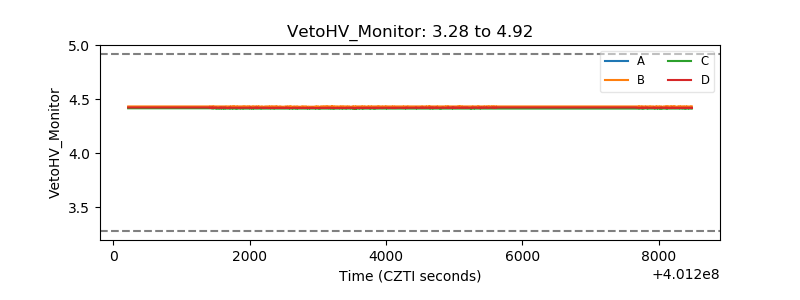 |
| Veto LLD | 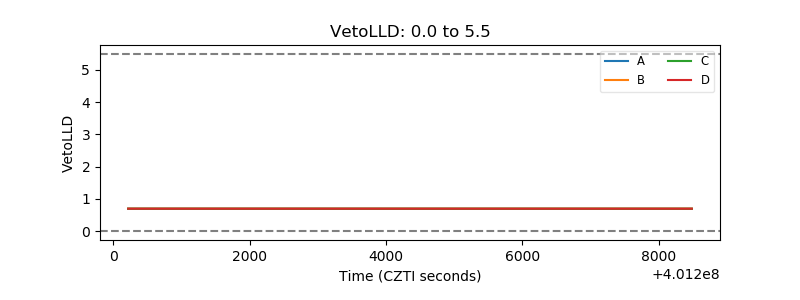 |
| Alpha Counter | 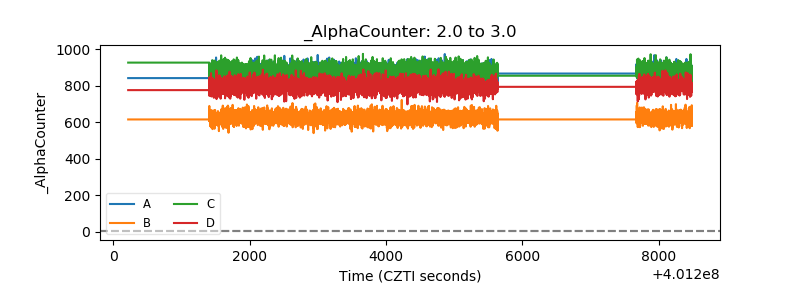 |
| _CPM_Rate | 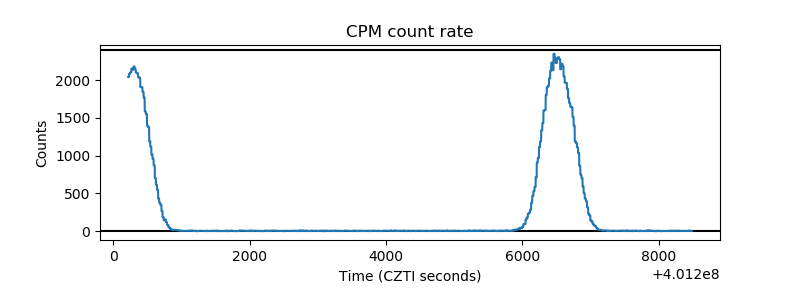 |
| CZT Counter | 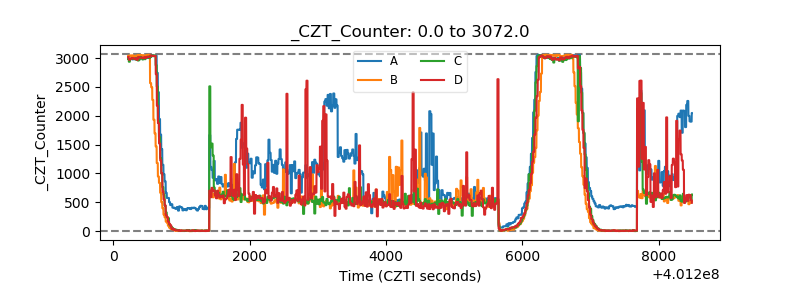 |
| +2.5 Volts monitor |  |
| +5 Volts monitor | 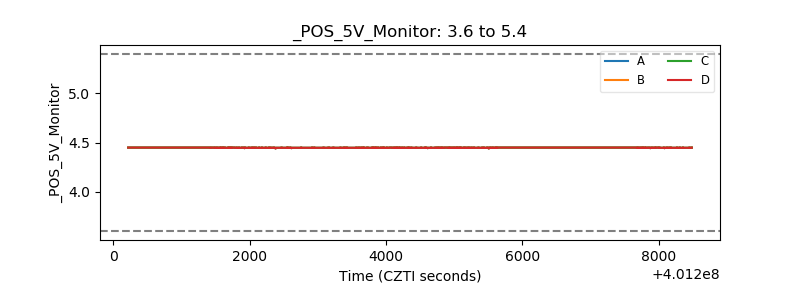 |
| _ROLL_ROT | 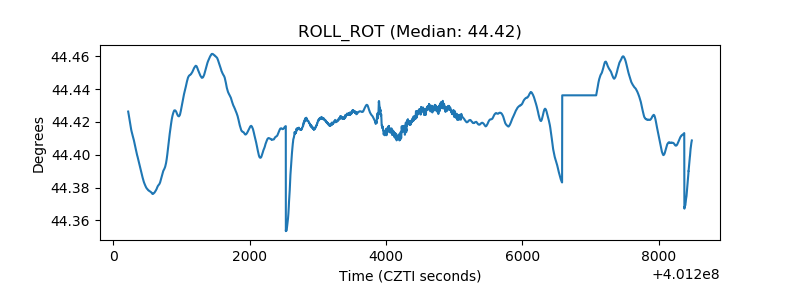 |
| _Roll_DEC | 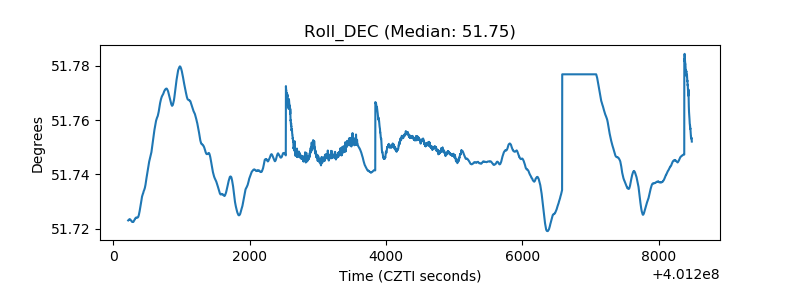 |
| _Roll_RA |  |
| Veto Counter | 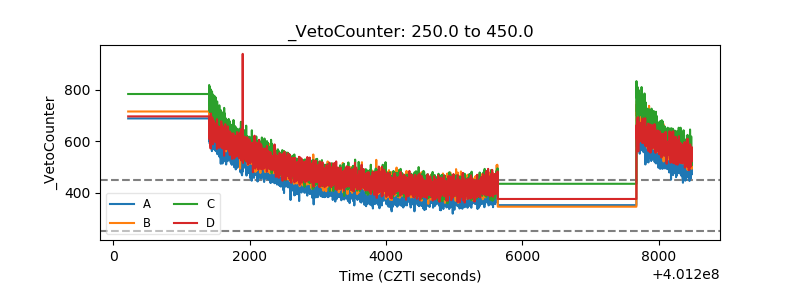 |