| Param | Original file | Final file |
|---|---|---|
| Filename | modeM0/AS1A12_018T01_9000005470_39334cztM0_level2.fits | modeM0/AS1A12_018T01_9000005470_39334cztM0_level2_quad_clean.evt |
| Size (bytes) | 57,323,520 | 13,933,440 |
| Size | 54.7 MB | 13.3 MB |
| Events in quadrant A | 474,159 | 91,730 |
| Events in quadrant B | 388,602 | 95,275 |
| Events in quadrant C | 377,428 | 89,976 |
| Events in quadrant D | 814,314 | 80,588 |
| Mode M9 | |||
|---|---|---|---|
| Quadrant | BADHDUFLAG | Total packets | Discarded packets |
| A | 0 | 9 | 0 |
| B | 0 | 9 | 0 |
| C | 0 | 9 | 0 |
| D | 0 | 9 | 0 |
| Mode SS | |||
|---|---|---|---|
| Quadrant | BADHDUFLAG | Total packets | Discarded packets |
| A | 0 | 16 | 0 |
| B | 0 | 16 | 0 |
| C | 0 | 16 | 0 |
| D | 0 | 16 | 0 |
| Mode M0 | |||
|---|---|---|---|
| Quadrant | BADHDUFLAG | Total packets | Discarded packets |
| A | 0 | 1914 | 2 |
| B | 0 | 1698 | 1 |
| C | 0 | 1658 | 1 |
| D | 0 | 3006 | 1 |
| Quadrant | Total seconds | Saturated seconds | Saturation percentage |
|---|---|---|---|
| A | 823 | 4 | 0.486027% |
| B | 823 | 2 | 0.243013% |
| C | 823 | 1 | 0.121507% |
| D | 823 | 46 | 5.589307% |
Noise dominated data is calculated using 1-second bins in cleaned event files. If a bin has >2000 counts, and if more than 50% of those come from <1% of pixels, then it is considered to be noise-dominated and hence unusable.
| Quadrant | # 1 sec bins | Bins with >0 counts | Bins with >2000 counts | High rate bins dominated by noise | Noise dominated (total time) | Noise dominated (detector-on time) | Marked lightcurve |
|---|---|---|---|---|---|---|---|
| A | 823 | 823 | 0 | 0 | 0.00% | 0.00% | 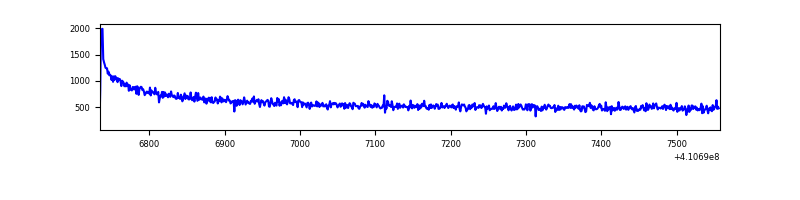 |
| B | 823 | 823 | 0 | 0 | 0.00% | 0.00% | 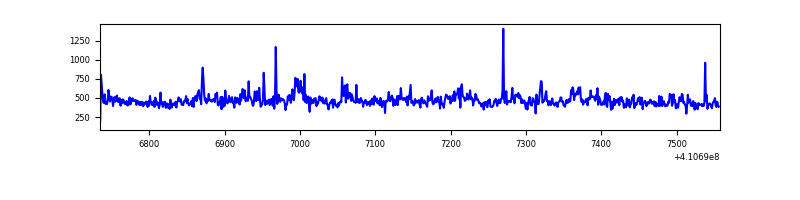 |
| C | 823 | 823 | 0 | 0 | 0.00% | 0.00% | 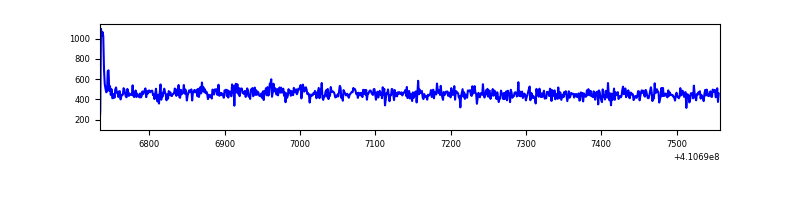 |
| D | 823 | 823 | 41 | 41 | 4.98% | 4.98% | 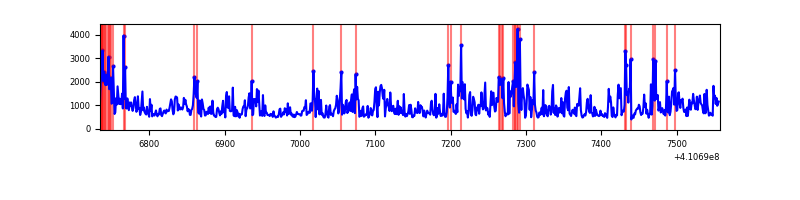 |
Top three noisy pixels from each quadrant. If the there are fewer than three noisy pixels in the level2.evt file, extra rows are filled as -1
| Pixel properties | Quadrant properties | ||||||
|---|---|---|---|---|---|---|---|
| Quadrant | DetID | PixID | Counts | Sigma | Mean | Median | Sigma |
| A | 10 | 83 | 124857 | 6096.8 | 89 | 87 | 20.5 |
| A | 10 | 67 | 1977 | 92.35 | 89 | 87 | 20.5 |
| A | 13 | 254 | 1153 | 52.09 | 89 | 87 | 20.5 |
| B | 5 | 172 | 28252 | 1458.94 | 87 | 85 | 19.3 |
| B | 5 | 255 | 13946 | 717.94 | 87 | 85 | 19.3 |
| B | 12 | 111 | 2095 | 104.11 | 87 | 85 | 19.3 |
| C | 15 | 214 | 42917 | 1998.05 | 84 | 85 | 21.4 |
| C | 0 | 10 | 3095 | 140.41 | 84 | 85 | 21.4 |
| C | 13 | 61 | 537 | 21.09 | 84 | 85 | 21.4 |
| D | 12 | 235 | 362456 | 16394.85 | 84 | 81 | 22.1 |
| D | 12 | 227 | 61884 | 2796.14 | 84 | 81 | 22.1 |
| D | 13 | 249 | 22591 | 1018.41 | 84 | 81 | 22.1 |
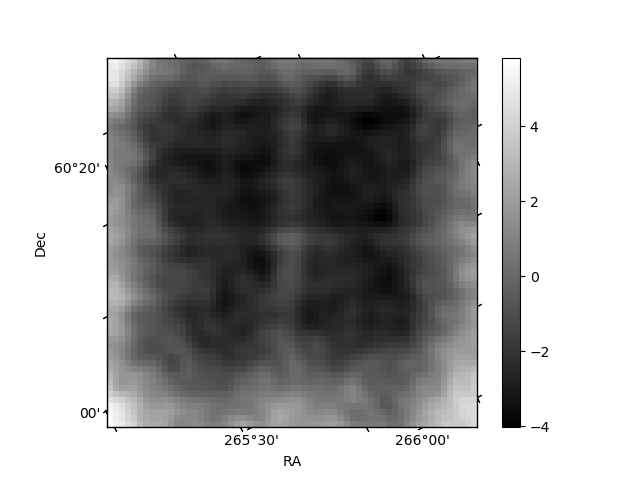
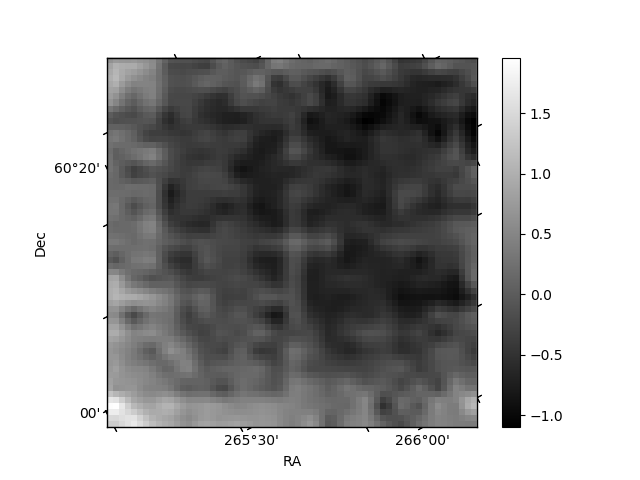
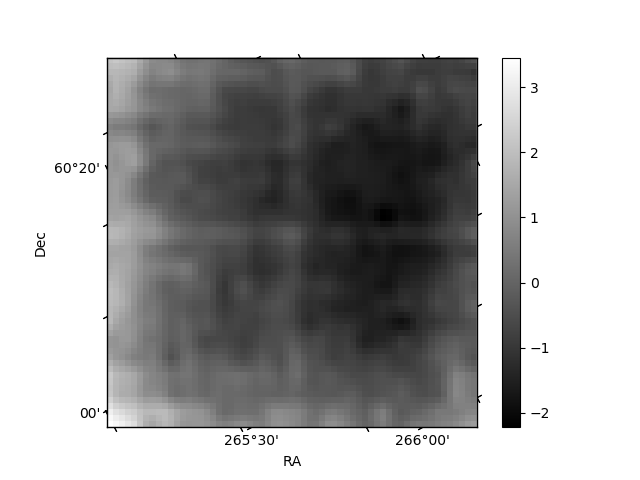
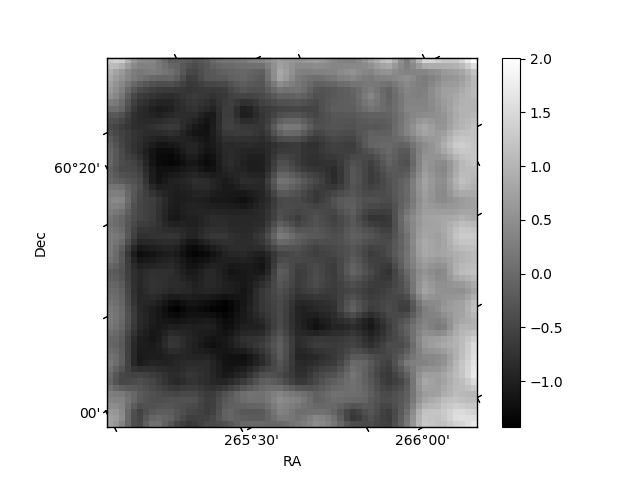
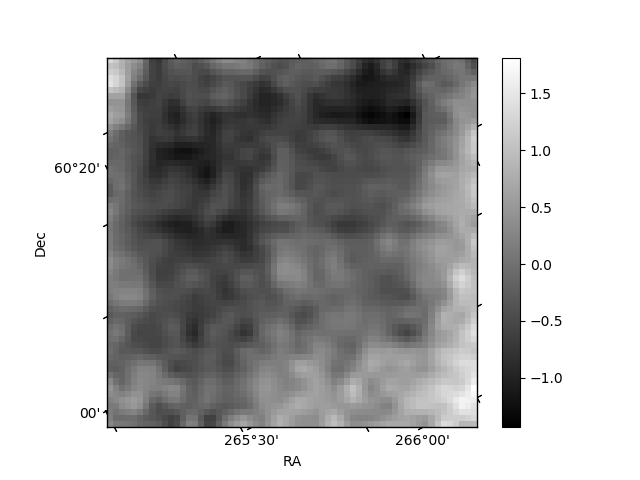
Histogram calculated using DETX and DETY for each event in the final _common_clean file
| Quadrant A | 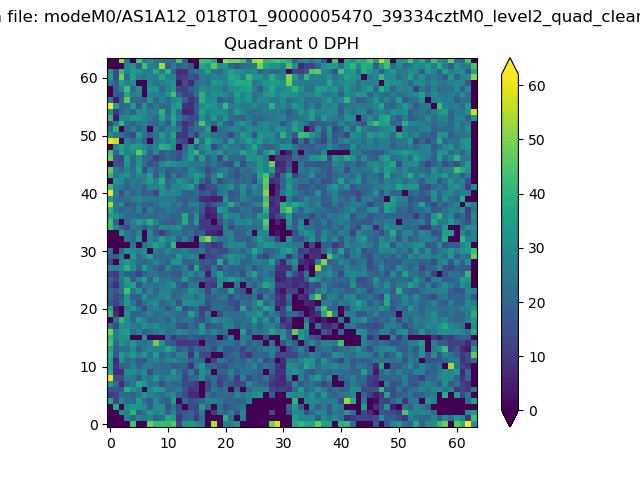 |
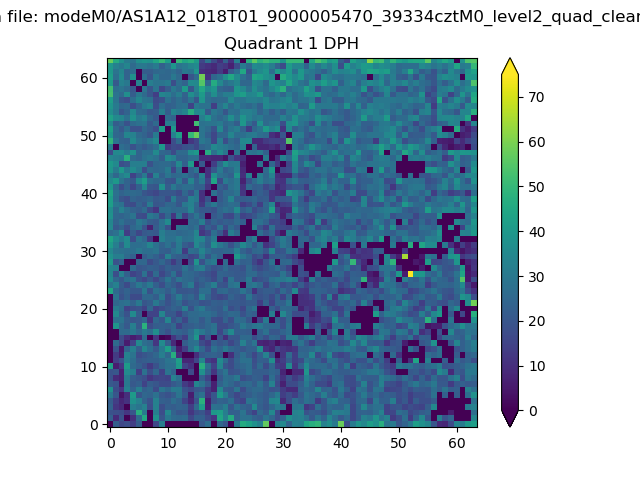 |
Quadrant B |
|---|---|---|---|
| Quadrant D | 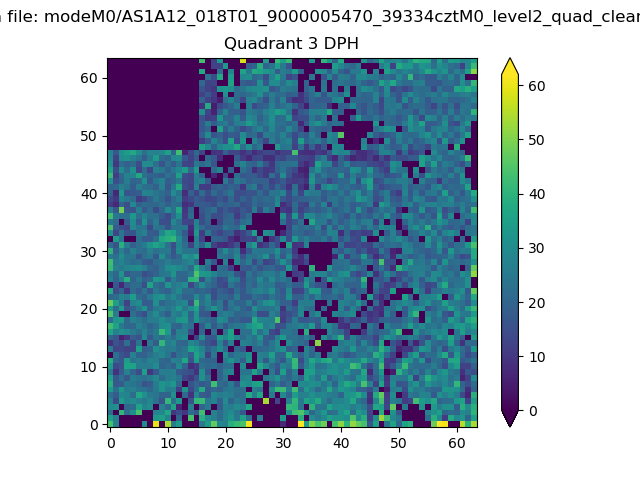 |
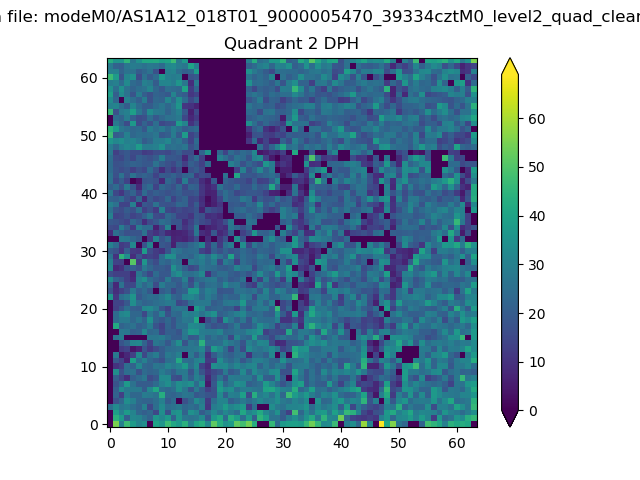 |
Quadrant C |
| Plot type | Count rate plots | Images |
|---|---|---|
| Comparison with Poisson distribution Blue bars denote a histogram of data divided into 1 sec bins. Red curve is a Poisson curve with rate = median count rate of data. |
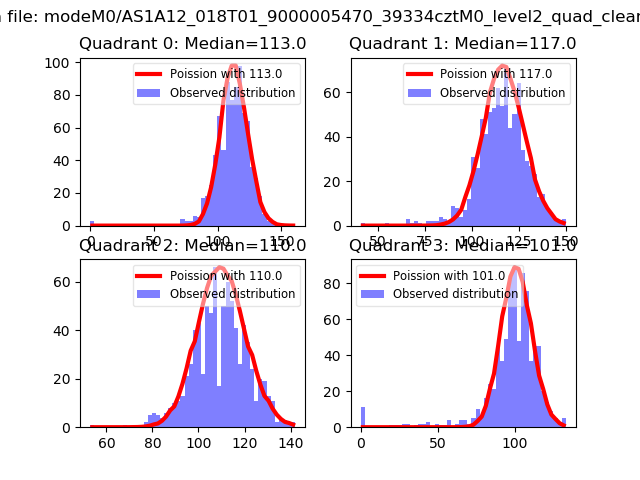 |
 |
| Quadrant-wise count rates Data is divided into 100 sec bins |
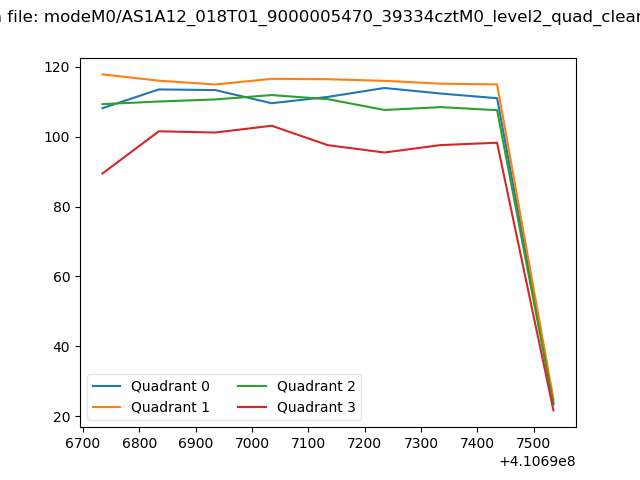 |
|
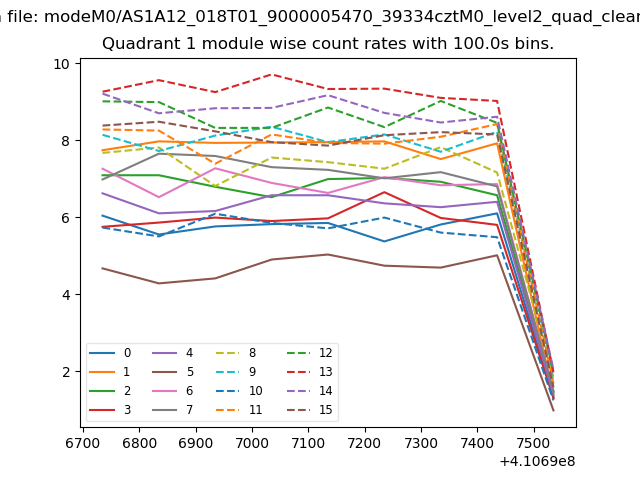
| Module-wise count rates for Quadrant A Data is divided into 100 sec bins |
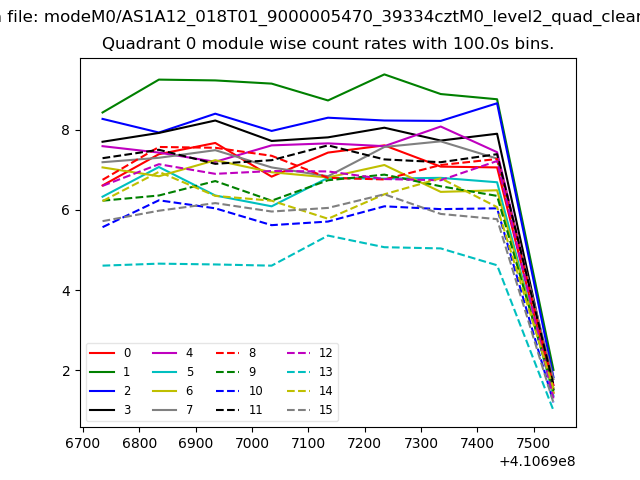 |
 |
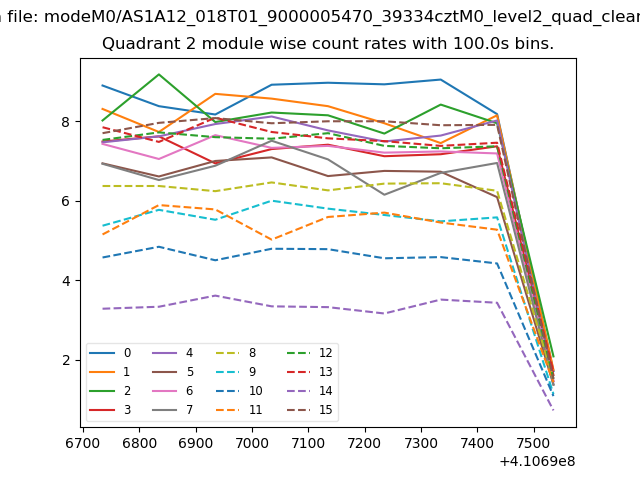
| Module-wise count rates for Quadrant B Data is divided into 100 sec bins |
 |
 |
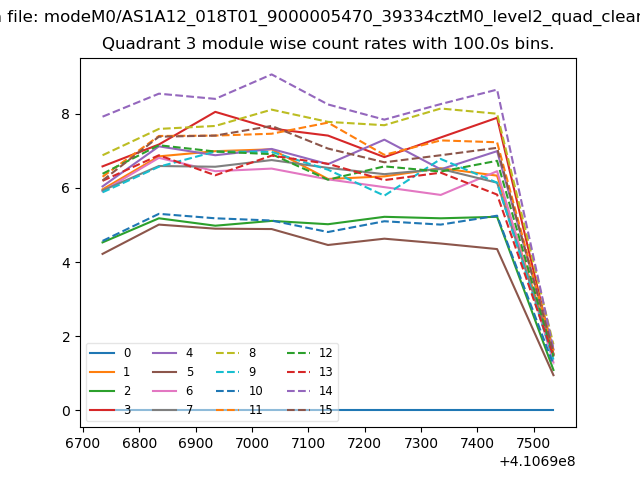
| Module-wise count rates for Quadrant C Data is divided into 100 sec bins |
 |
 |
| Module-wise count rates for Quadrant D Data is divided into 100 sec bins |
 |
 |
| Parameter | Plot |
|---|---|
| CZT HV Monitor | 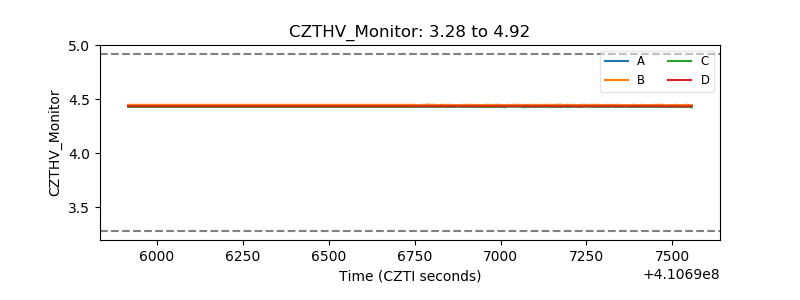 |
| D_VDD | 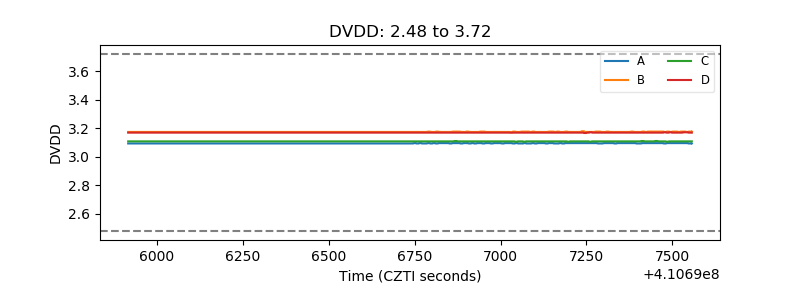 |
| Temperature 1 | 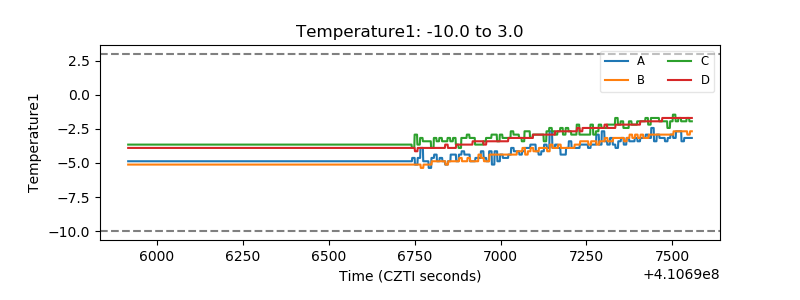 |
| Veto HV Monitor | 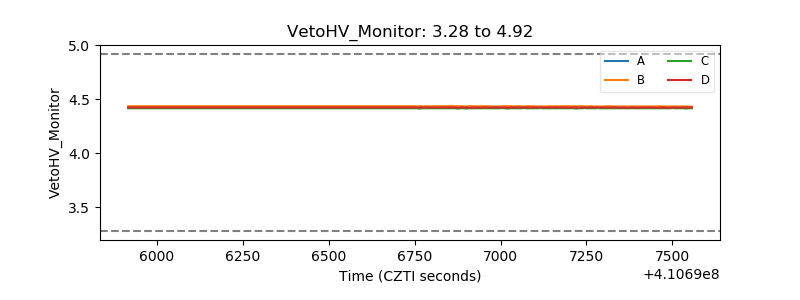 |
| Veto LLD | 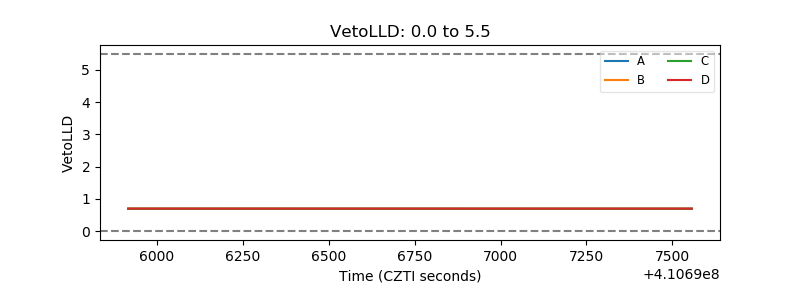 |
| Alpha Counter | 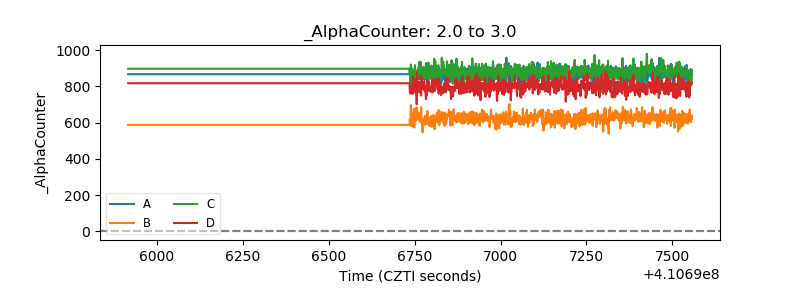 |
| _CPM_Rate | 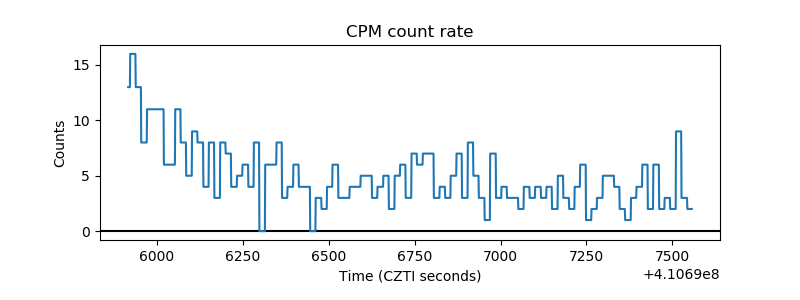 |
| CZT Counter | 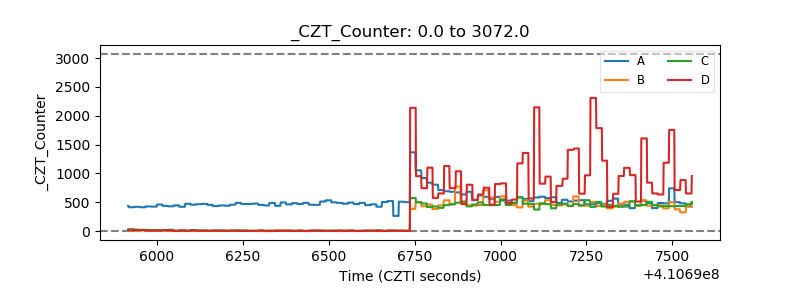 |
| +2.5 Volts monitor | 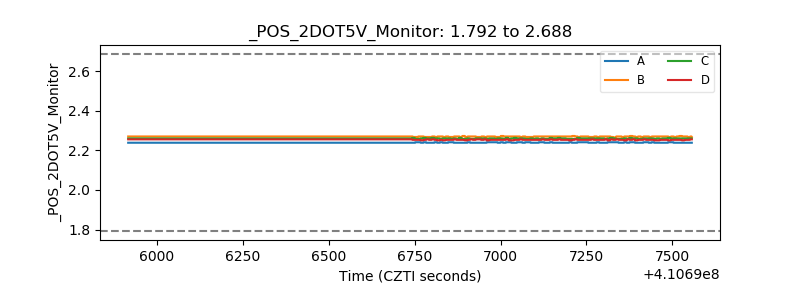 |
| +5 Volts monitor | 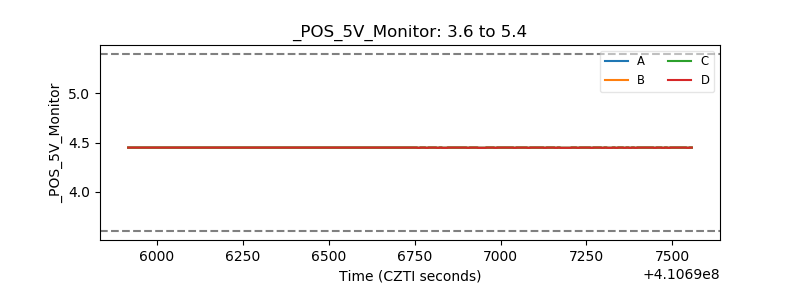 |
| _ROLL_ROT | 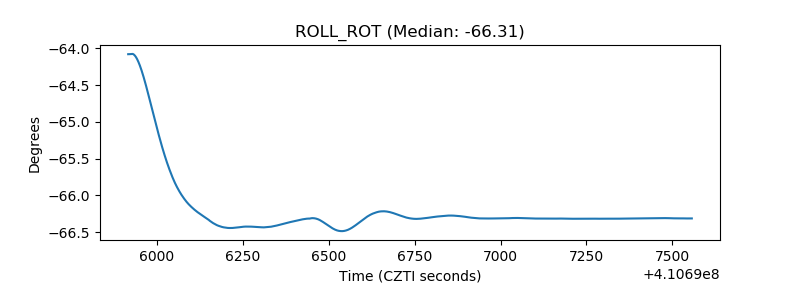 |
| _Roll_DEC | 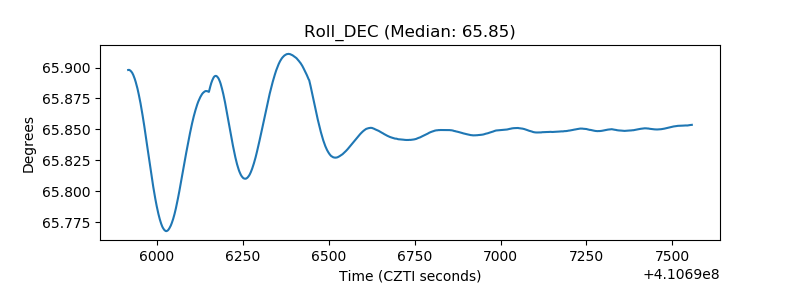 |
| _Roll_RA | 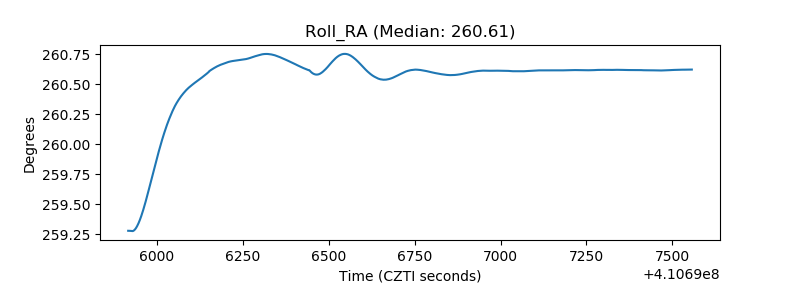 |
| Veto Counter | 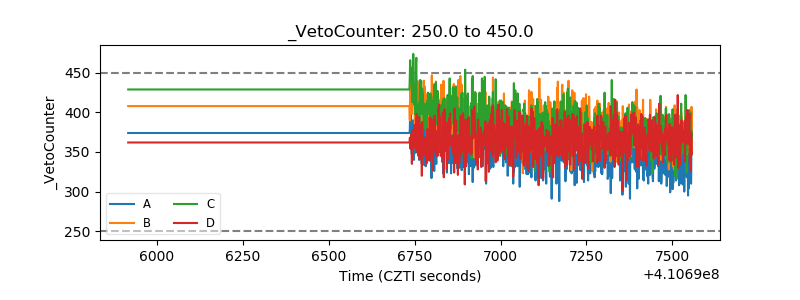 |