| Param | Original file | Final file |
|---|---|---|
| Filename | modeM0/AS1A12_054T03_9000005516_40230cztM0_level2.fits | modeM0/AS1A12_054T03_9000005516_40230cztM0_level2_quad_clean.evt |
| Size (bytes) | 40,487,040 | 11,511,360 |
| Size | 38.6 MB | 11.0 MB |
| Events in quadrant A | 362,891 | 68,722 |
| Events in quadrant B | 317,538 | 84,659 |
| Events in quadrant C | 360,712 | 75,428 |
| Events in quadrant D | 404,579 | 67,684 |
| Mode M9 | |||
|---|---|---|---|
| Quadrant | BADHDUFLAG | Total packets | Discarded packets |
| A | 0 | 6 | 3 |
| B | 0 | 3 | 0 |
| C | 0 | 2 | 0 |
| D | 0 | 5 | 2 |
| Mode SS | |||
|---|---|---|---|
| Quadrant | BADHDUFLAG | Total packets | Discarded packets |
| A | 0 | 15 | 3 |
| B | 0 | 17 | 3 |
| C | 0 | 18 | 2 |
| D | 0 | 16 | 2 |
| Mode M0 | |||
|---|---|---|---|
| Quadrant | BADHDUFLAG | Total packets | Discarded packets |
| A | 0 | 2066 | 660 |
| B | 0 | 1634 | 268 |
| C | 0 | 1820 | 397 |
| D | 0 | 2099 | 471 |
| Quadrant | Total seconds | Saturated seconds | Saturation percentage |
|---|---|---|---|
| A | 595 | 5 | 0.840336% |
| B | 672 | 2 | 0.297619% |
| C | 641 | 6 | 0.936037% |
| D | 638 | 6 | 0.940439% |
Noise dominated data is calculated using 1-second bins in cleaned event files. If a bin has >2000 counts, and if more than 50% of those come from <1% of pixels, then it is considered to be noise-dominated and hence unusable.
| Quadrant | # 1 sec bins | Bins with >0 counts | Bins with >2000 counts | High rate bins dominated by noise | Noise dominated (total time) | Noise dominated (detector-on time) | Marked lightcurve |
|---|---|---|---|---|---|---|---|
| A | 828 | 713 | 3 | 3 | 0.36% | 0.42% | 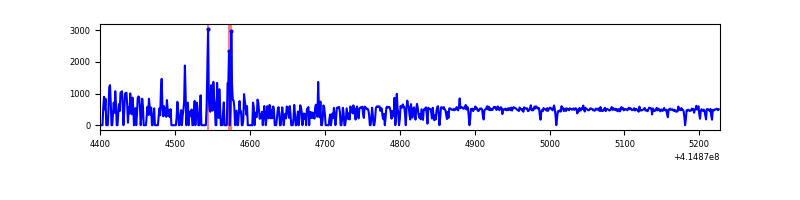 |
| B | 828 | 767 | 0 | 0 | 0.00% | 0.00% | 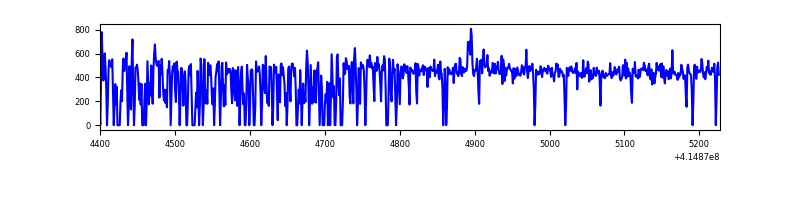 |
| C | 828 | 752 | 4 | 4 | 0.48% | 0.53% | 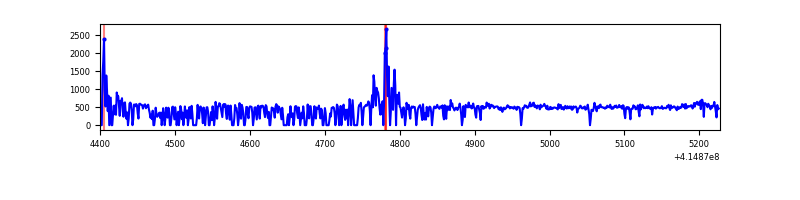 |
| D | 828 | 743 | 2 | 2 | 0.24% | 0.27% | 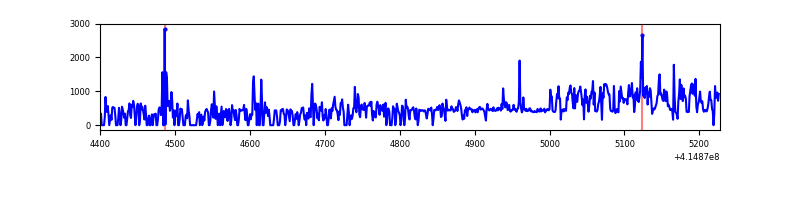 |
Top three noisy pixels from each quadrant. If the there are fewer than three noisy pixels in the level2.evt file, extra rows are filled as -1
| Pixel properties | Quadrant properties | ||||||
|---|---|---|---|---|---|---|---|
| Quadrant | DetID | PixID | Counts | Sigma | Mean | Median | Sigma |
| A | 10 | 83 | 75193 | 4778.06 | 66 | 65 | 15.7 |
| A | 13 | 248 | 31197 | 1979.96 | 66 | 65 | 15.7 |
| A | 13 | 254 | 852 | 50.05 | 66 | 65 | 15.7 |
| B | 0 | 245 | 6777 | 386.44 | 77 | 75 | 17.3 |
| B | 0 | 230 | 2053 | 114.05 | 77 | 75 | 17.3 |
| B | 4 | 171 | 2004 | 111.23 | 77 | 75 | 17.3 |
| C | 15 | 214 | 30372 | 1587.8 | 73 | 73 | 19.1 |
| C | 14 | 254 | 23575 | 1231.61 | 73 | 73 | 19.1 |
| C | 0 | 10 | 11603 | 604.22 | 73 | 73 | 19.1 |
| D | 12 | 227 | 75468 | 4039.92 | 70 | 68 | 18.7 |
| D | 13 | 249 | 32383 | 1731.43 | 70 | 68 | 18.7 |
| D | 2 | 249 | 14380 | 766.84 | 70 | 68 | 18.7 |
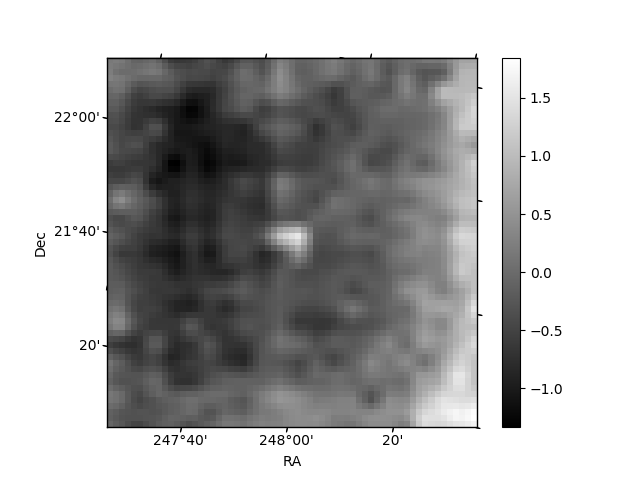
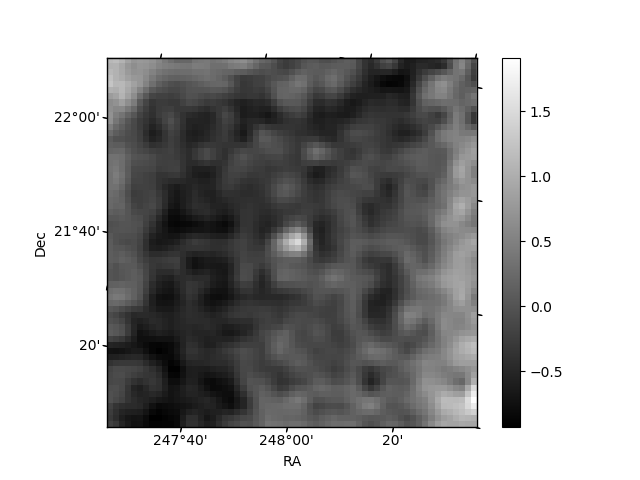
Histogram calculated using DETX and DETY for each event in the final _common_clean file
| Quadrant A | 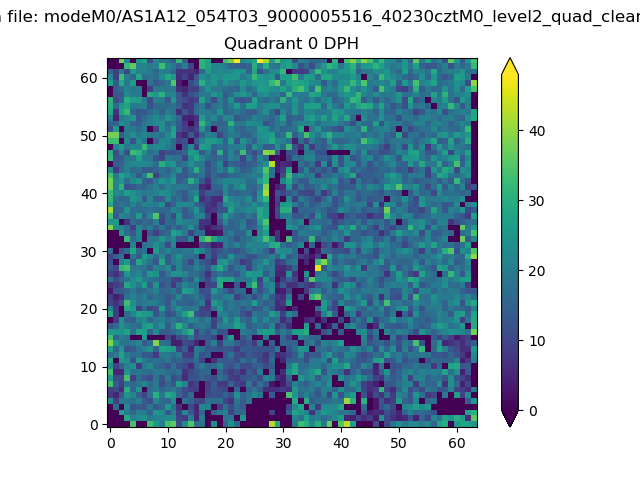 |
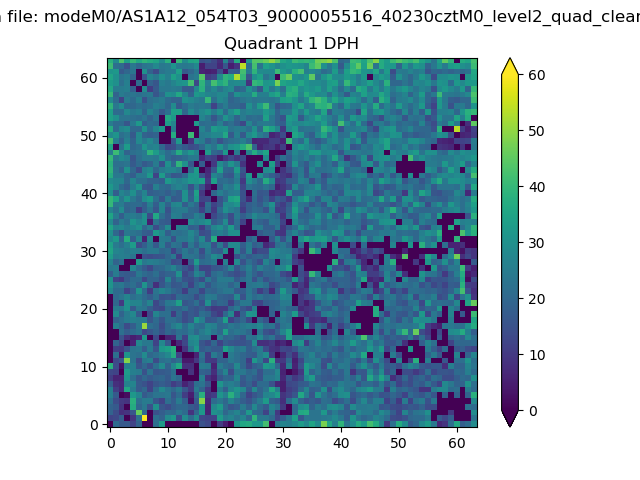 |
Quadrant B |
|---|---|---|---|
| Quadrant D | 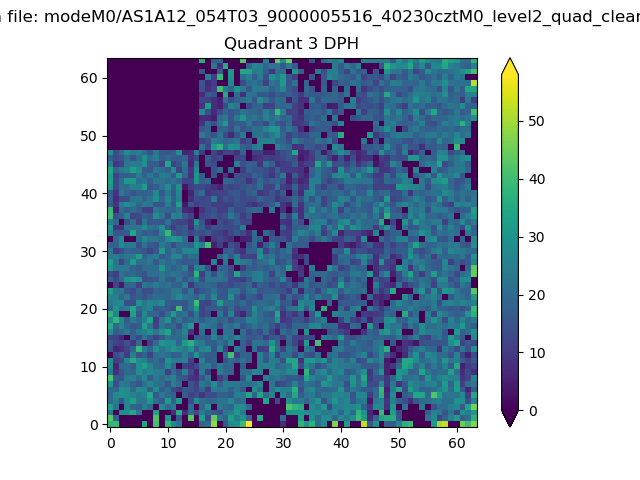 |
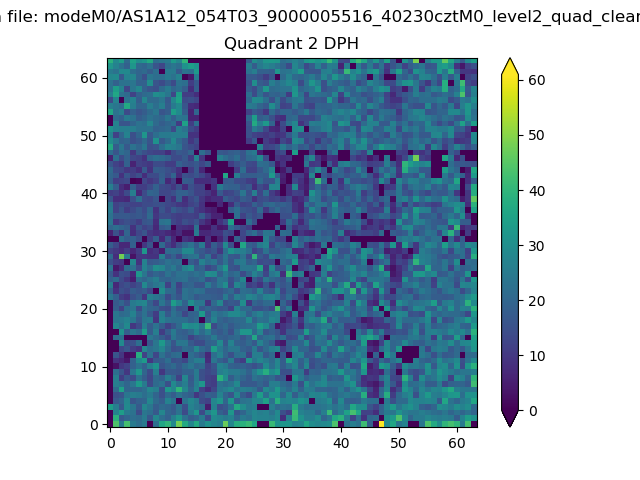 |
Quadrant C |
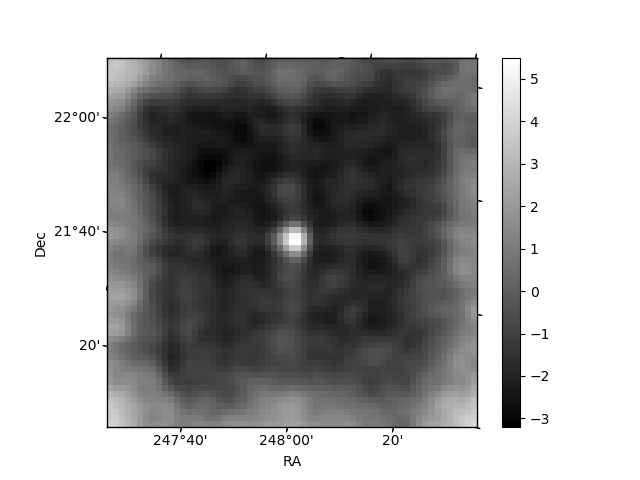
| Plot type | Count rate plots | Images |
|---|---|---|
| Comparison with Poisson distribution Blue bars denote a histogram of data divided into 1 sec bins. Red curve is a Poisson curve with rate = median count rate of data. |
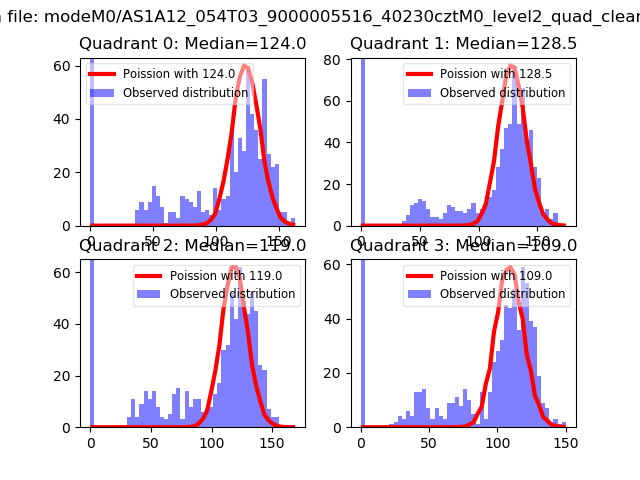 |
 |
| Quadrant-wise count rates Data is divided into 100 sec bins |
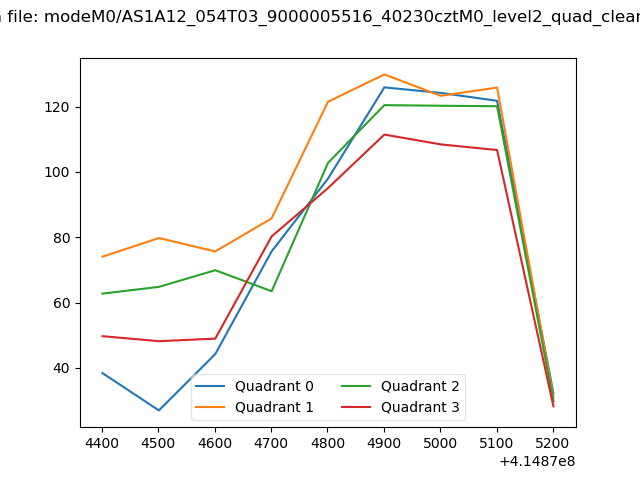 |
|
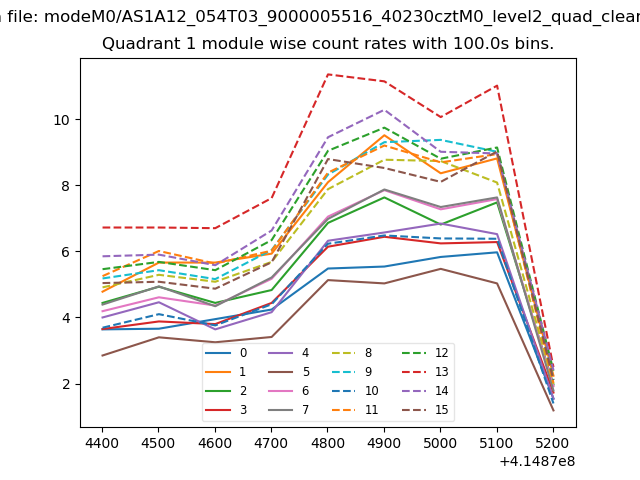
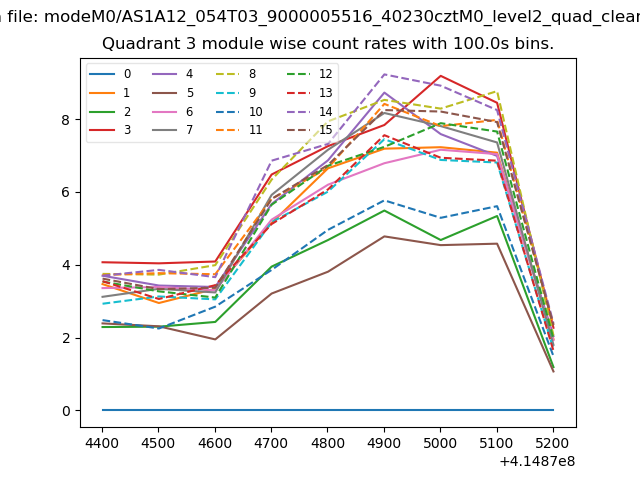
| Module-wise count rates for Quadrant A Data is divided into 100 sec bins |
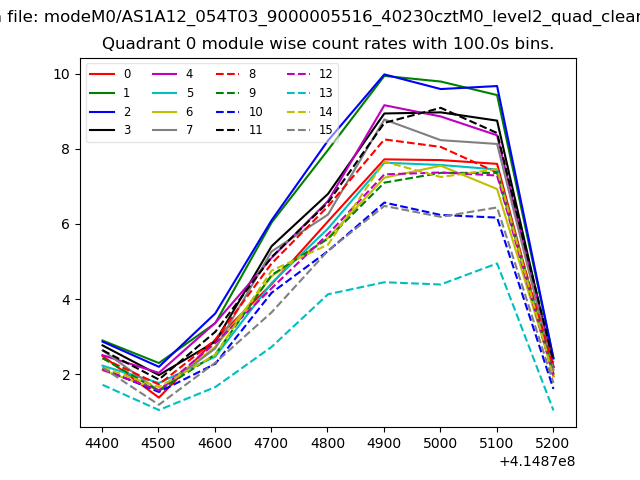 |
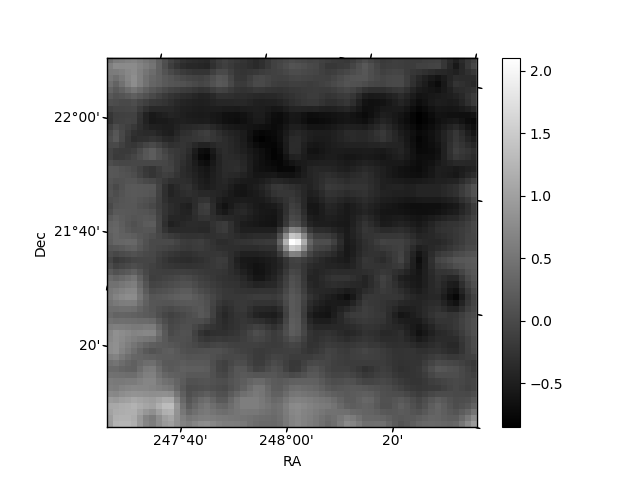 |
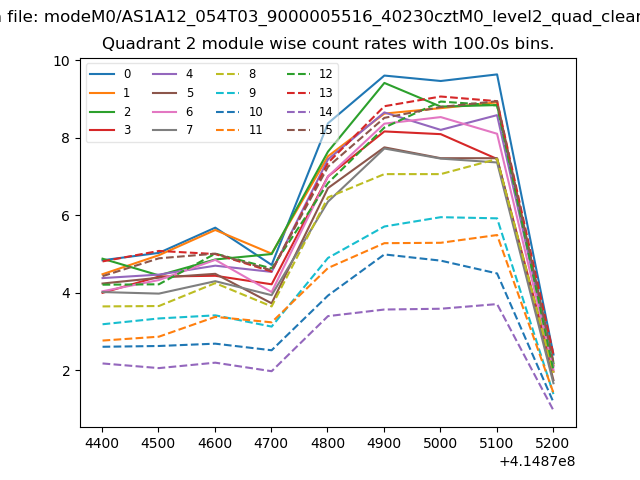
| Module-wise count rates for Quadrant B Data is divided into 100 sec bins |
 |
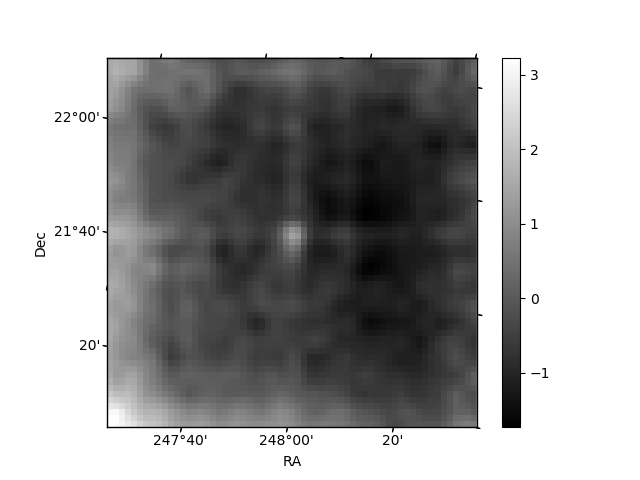 |
| Module-wise count rates for Quadrant C Data is divided into 100 sec bins |
 |
 |
| Module-wise count rates for Quadrant D Data is divided into 100 sec bins |
 |
 |
| Parameter | Plot |
|---|---|
| CZT HV Monitor | 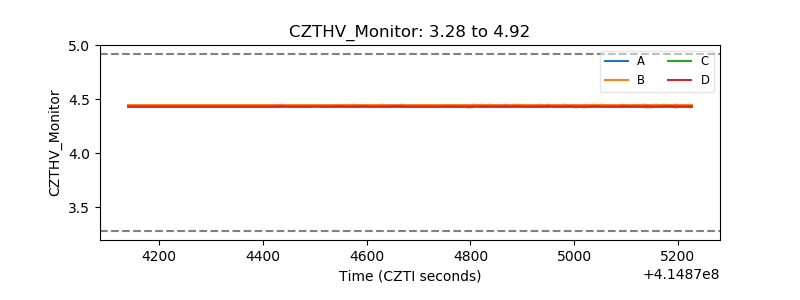 |
| D_VDD | 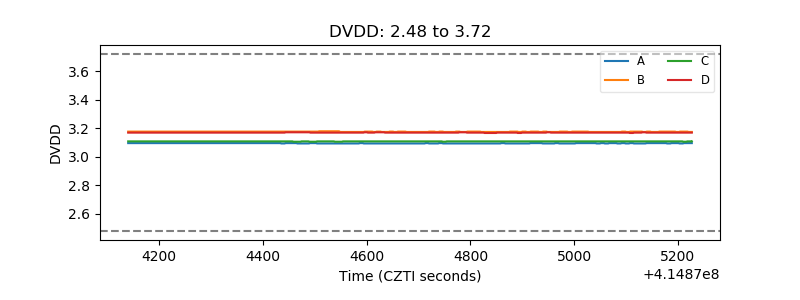 |
| Temperature 1 | 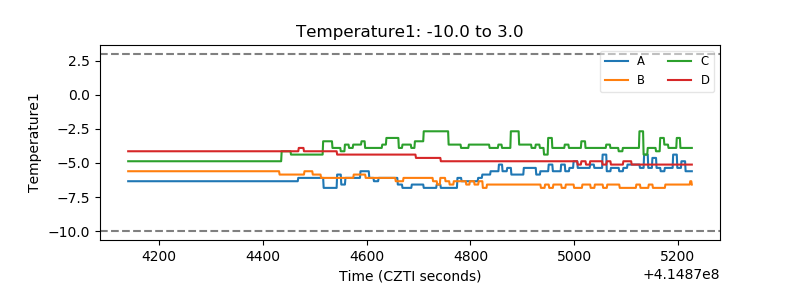 |
| Veto HV Monitor |  |
| Veto LLD | 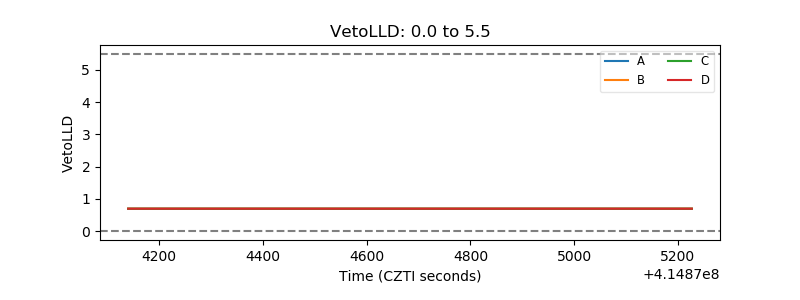 |
| Alpha Counter | 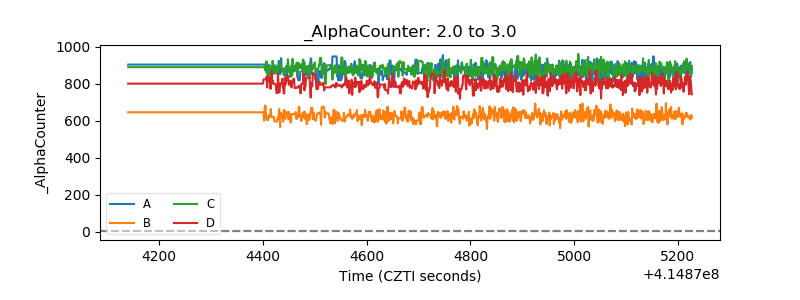 |
| _CPM_Rate | 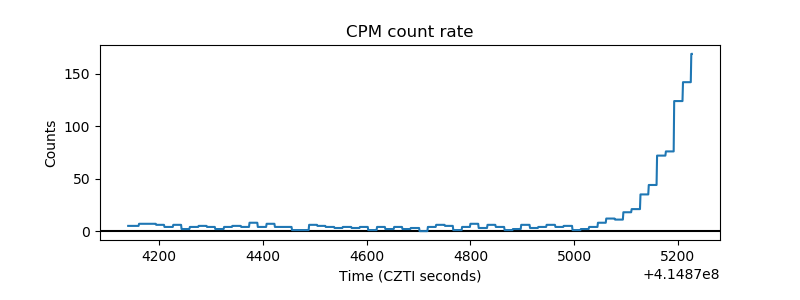 |
| CZT Counter | 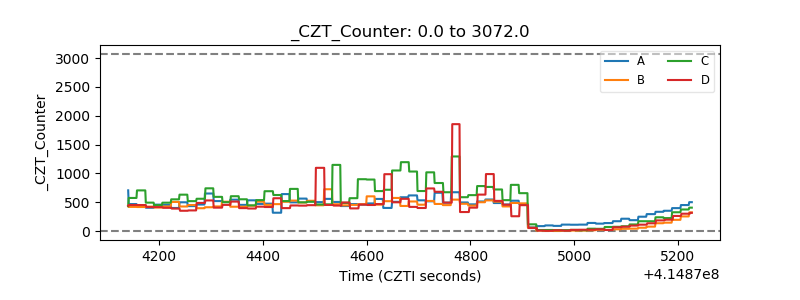 |
| +2.5 Volts monitor | 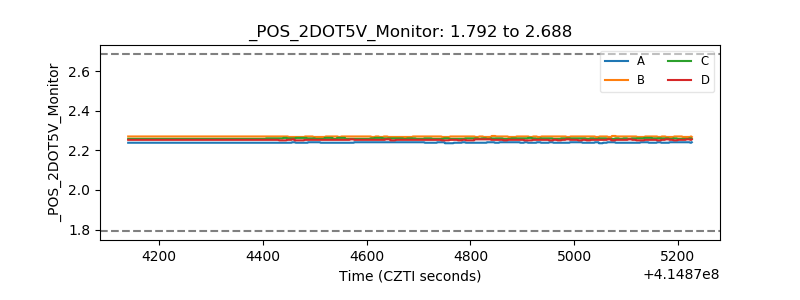 |
| +5 Volts monitor |  |
| _ROLL_ROT | 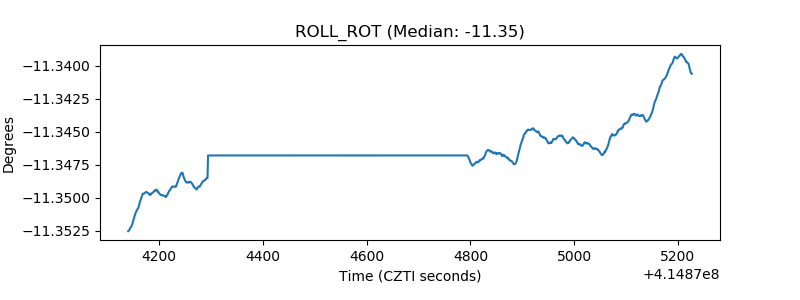 |
| _Roll_DEC | 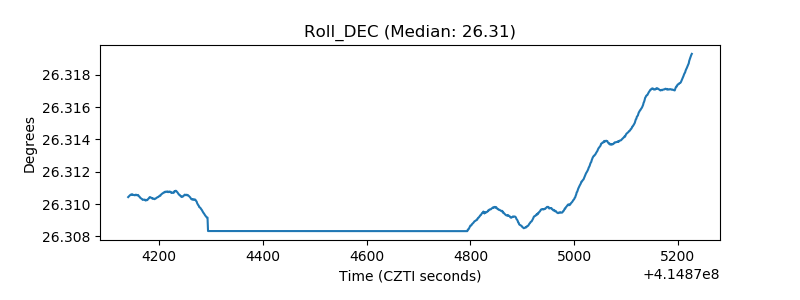 |
| _Roll_RA | 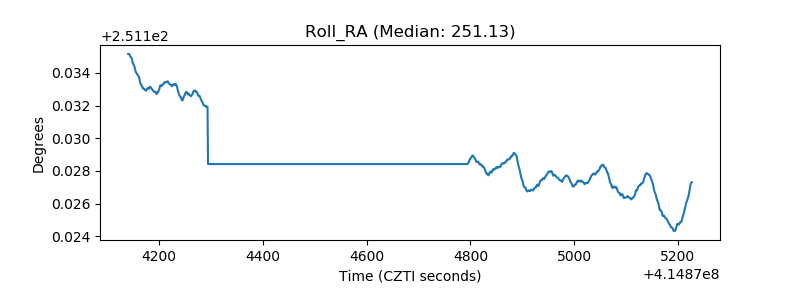 |
| Veto Counter | 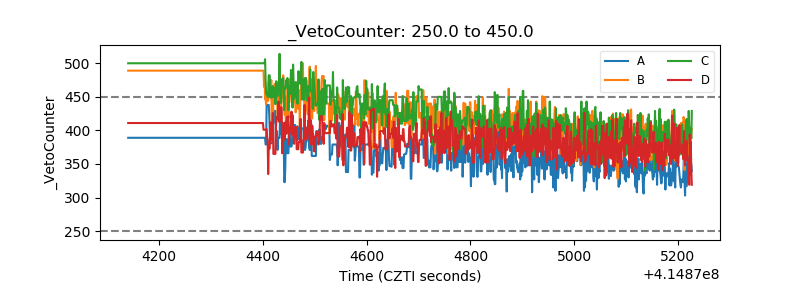 |