| Param | Original file | Final file |
|---|---|---|
| Filename | modeM0/AS1A12_029T02_9000005558_40691cztM0_level2.fits | modeM0/AS1A12_029T02_9000005558_40691cztM0_level2_quad_clean.evt |
| Size (bytes) | 390,755,520 | 93,784,320 |
| Size | 372.7 MB | 89.4 MB |
| Events in quadrant A | 2,941,355 | 649,990 |
| Events in quadrant B | 2,955,171 | 679,955 |
| Events in quadrant C | 5,070,869 | 615,857 |
| Events in quadrant D | 3,070,619 | 510,665 |
| Mode M0 | |||
|---|---|---|---|
| Quadrant | BADHDUFLAG | Total packets | Discarded packets |
| A | 0 | 12029 | 3 |
| B | 0 | 12333 | 2 |
| C | 0 | 18761 | 2 |
| D | 0 | 12950 | 2 |
| Mode M9 | |||
|---|---|---|---|
| Quadrant | BADHDUFLAG | Total packets | Discarded packets |
| A | 0 | 38 | 0 |
| B | 0 | 38 | 0 |
| C | 0 | 38 | 0 |
| D | 0 | 38 | 0 |
| Mode SS | |||
|---|---|---|---|
| Quadrant | BADHDUFLAG | Total packets | Discarded packets |
| A | 0 | 114 | 0 |
| B | 0 | 114 | 0 |
| C | 0 | 114 | 0 |
| D | 0 | 114 | 0 |
| Quadrant | Total seconds | Saturated seconds | Saturation percentage |
|---|---|---|---|
| A | 5475 | 13 | 0.237443% |
| B | 5475 | 43 | 0.785388% |
| C | 5475 | 367 | 6.703196% |
| D | 5475 | 816 | 14.904110% |
Noise dominated data is calculated using 1-second bins in cleaned event files. If a bin has >2000 counts, and if more than 50% of those come from <1% of pixels, then it is considered to be noise-dominated and hence unusable.
| Quadrant | # 1 sec bins | Bins with >0 counts | Bins with >2000 counts | High rate bins dominated by noise | Noise dominated (total time) | Noise dominated (detector-on time) | Marked lightcurve |
|---|---|---|---|---|---|---|---|
| A | 9298 | 5477 | 4 | 4 | 0.04% | 0.07% | 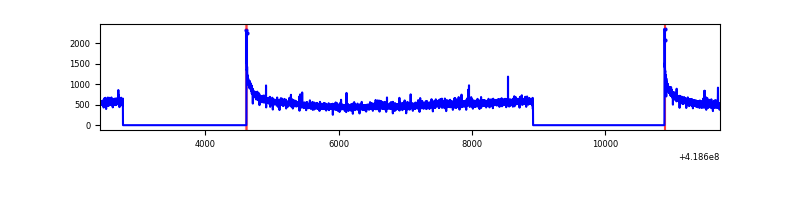 |
| B | 9298 | 5477 | 24 | 24 | 0.26% | 0.44% | 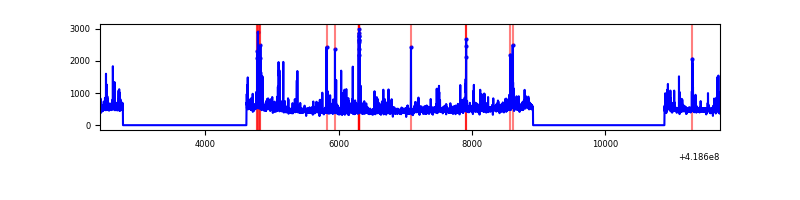 |
| C | 9298 | 5477 | 370 | 370 | 3.98% | 6.76% | 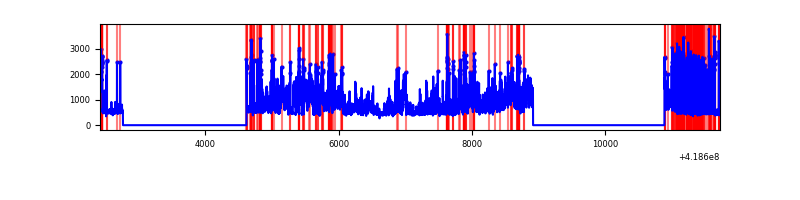 |
| D | 9298 | 5477 | 53 | 53 | 0.57% | 0.97% | 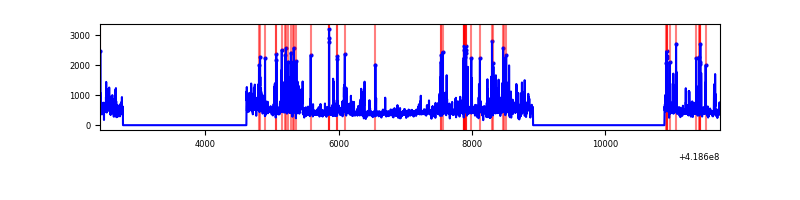 |
Top three noisy pixels from each quadrant. If the there are fewer than three noisy pixels in the level2.evt file, extra rows are filled as -1
| Pixel properties | Quadrant properties | ||||||
|---|---|---|---|---|---|---|---|
| Quadrant | DetID | PixID | Counts | Sigma | Mean | Median | Sigma |
| A | 10 | 83 | 497273 | 3885.78 | 621 | 608 | 127.8 |
| A | 2 | 79 | 22332 | 169.96 | 621 | 608 | 127.8 |
| A | 12 | 189 | 10702 | 78.97 | 621 | 608 | 127.8 |
| B | 0 | 229 | 213805 | 1788.88 | 624 | 608 | 119.2 |
| B | 5 | 255 | 100633 | 839.28 | 624 | 608 | 119.2 |
| B | 0 | 190 | 93067 | 775.8 | 624 | 608 | 119.2 |
| C | 9 | 187 | 2450283 | 17552.65 | 597 | 600 | 139.6 |
| C | 15 | 214 | 235449 | 1682.76 | 597 | 600 | 139.6 |
| C | 14 | 254 | 34564 | 243.36 | 597 | 600 | 139.6 |
| D | 2 | 250 | 261593 | 1910.2 | 549 | 534 | 136.7 |
| D | 12 | 191 | 199905 | 1458.82 | 549 | 534 | 136.7 |
| D | 2 | 249 | 165805 | 1209.31 | 549 | 534 | 136.7 |
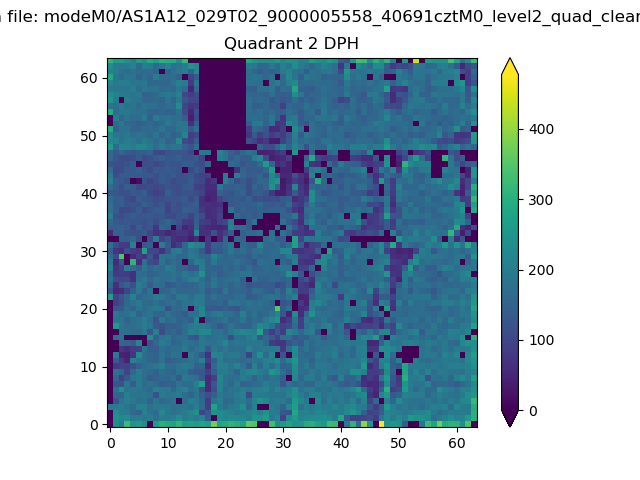
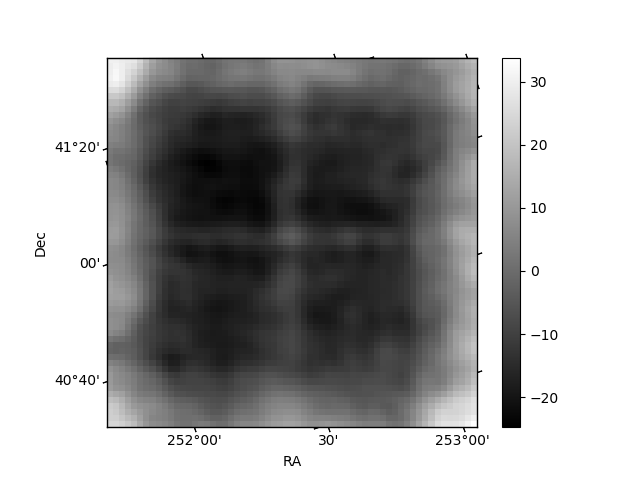
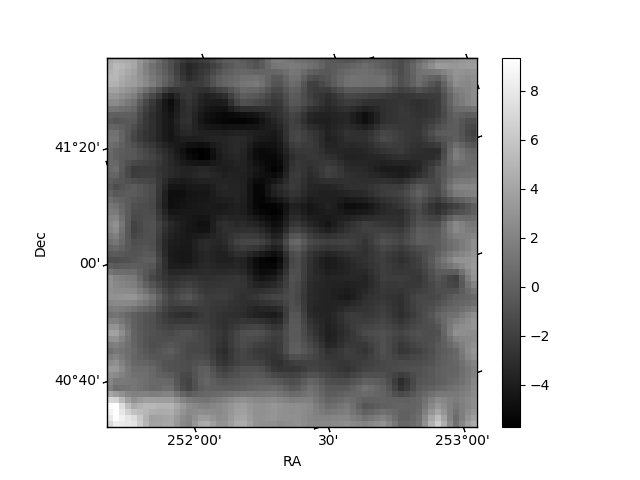
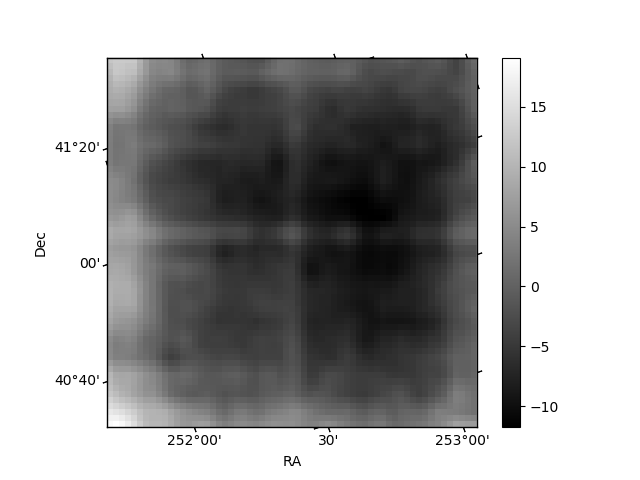
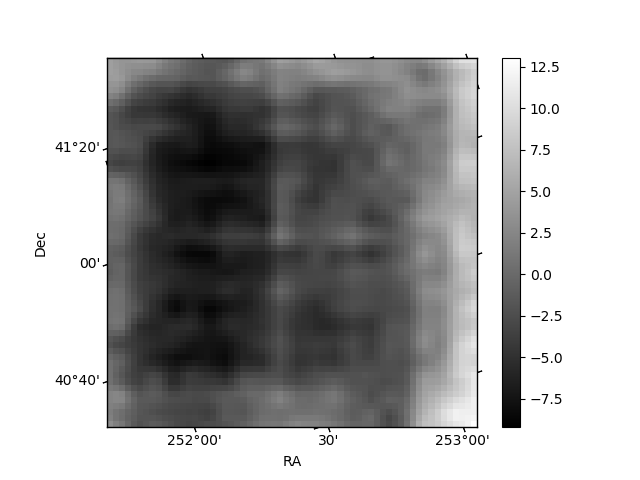
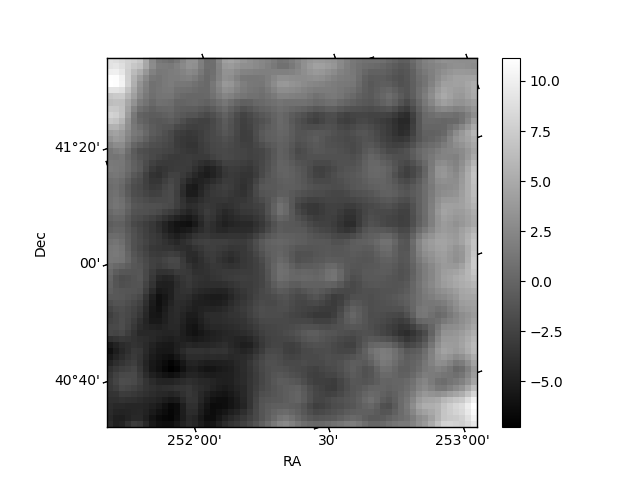
Histogram calculated using DETX and DETY for each event in the final _common_clean file
| Quadrant A | 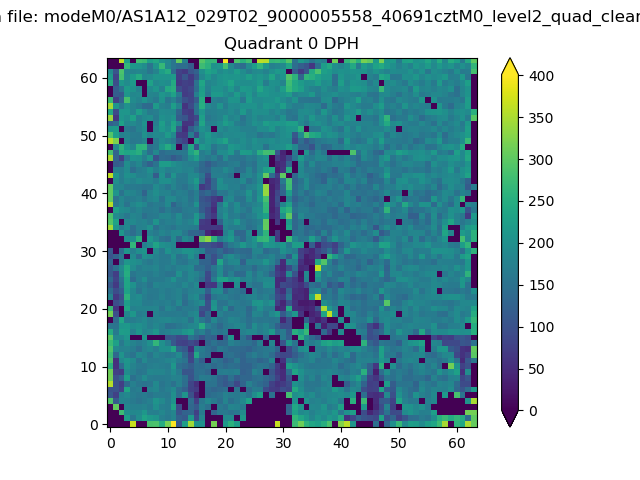 |
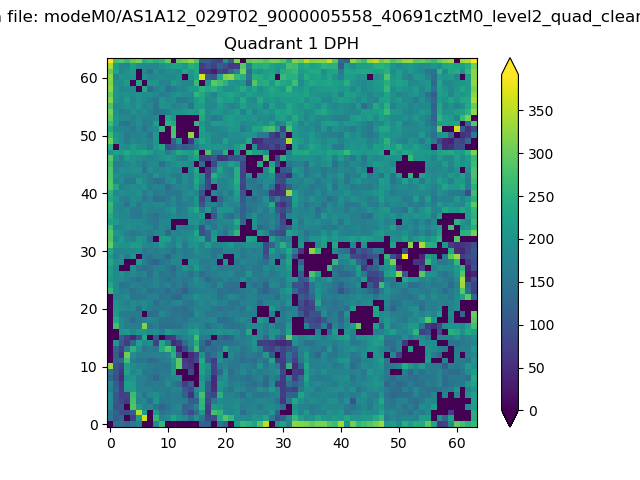 |
Quadrant B |
|---|---|---|---|
| Quadrant D | 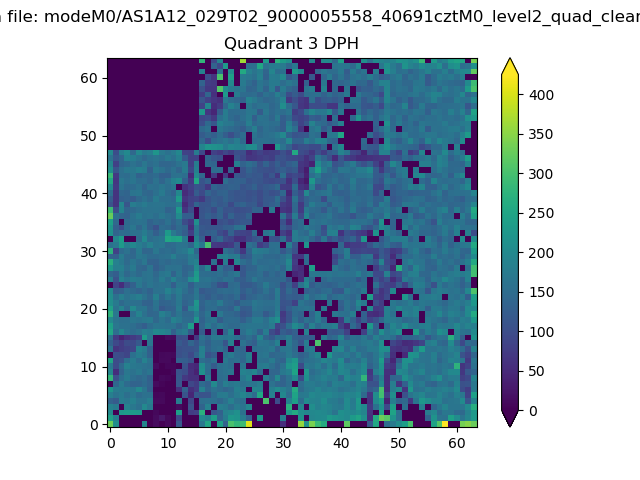 |
 |
Quadrant C |
| Plot type | Count rate plots | Images |
|---|---|---|
| Comparison with Poisson distribution Blue bars denote a histogram of data divided into 1 sec bins. Red curve is a Poisson curve with rate = median count rate of data. |
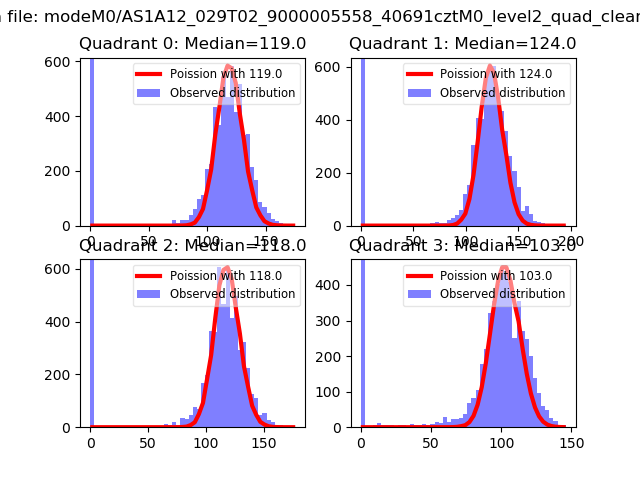 |
 |
| Quadrant-wise count rates Data is divided into 100 sec bins |
 |
|
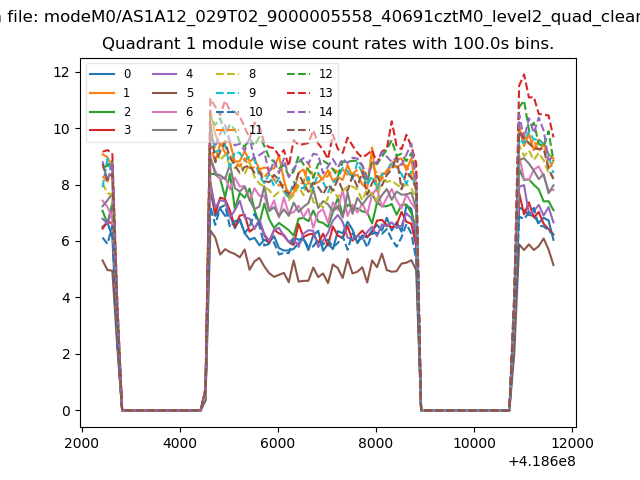
| Module-wise count rates for Quadrant A Data is divided into 100 sec bins |
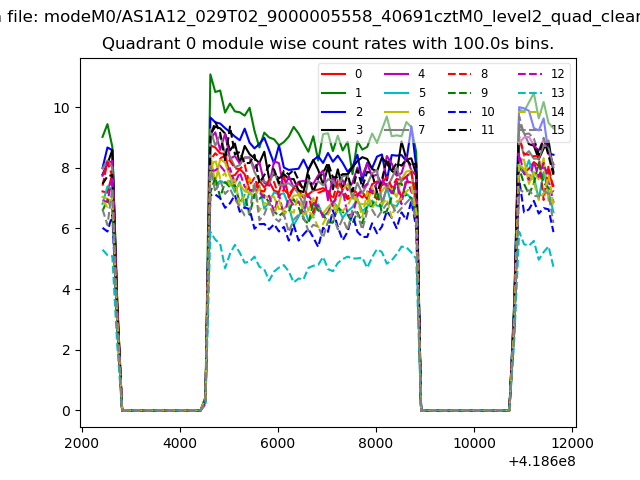 |
 |
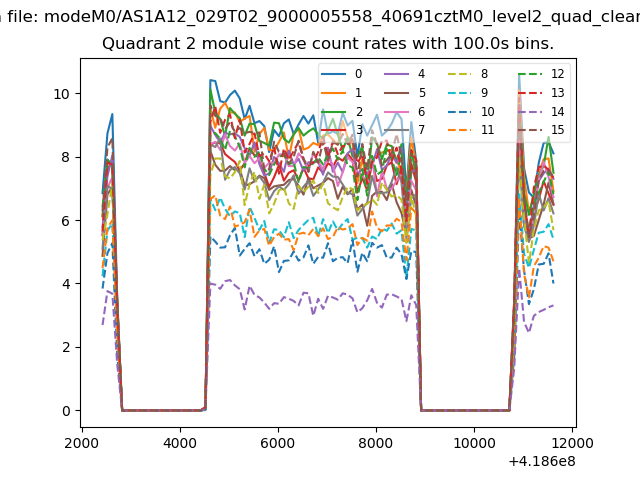
| Module-wise count rates for Quadrant B Data is divided into 100 sec bins |
 |
 |
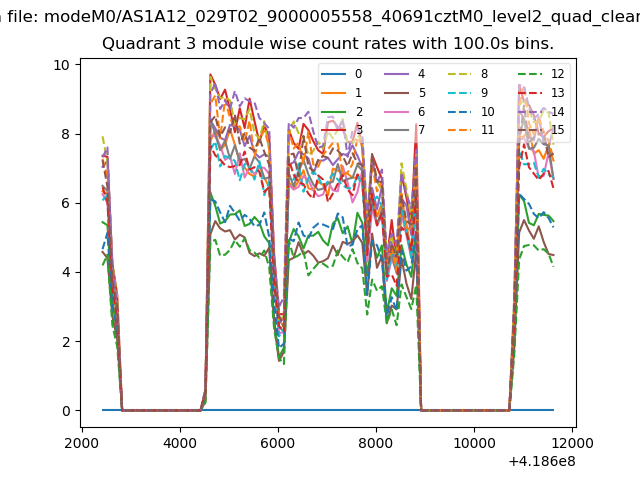
| Module-wise count rates for Quadrant C Data is divided into 100 sec bins |
 |
 |
| Module-wise count rates for Quadrant D Data is divided into 100 sec bins |
 |
 |
| Parameter | Plot |
|---|---|
| CZT HV Monitor |  |
| D_VDD | 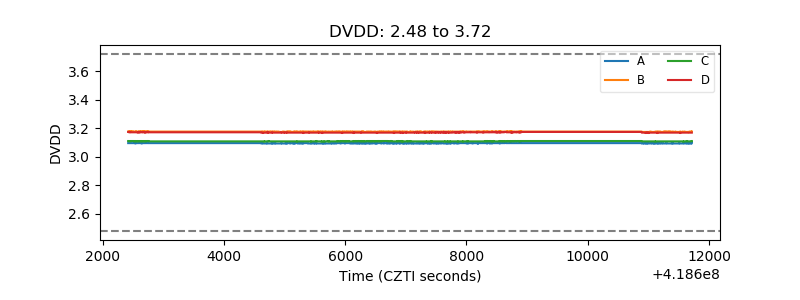 |
| Temperature 1 | 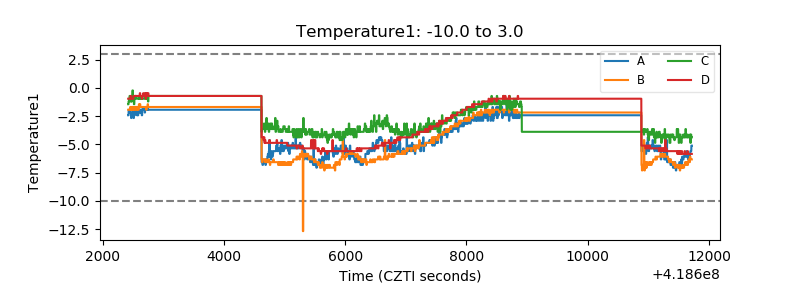 |
| Veto HV Monitor | 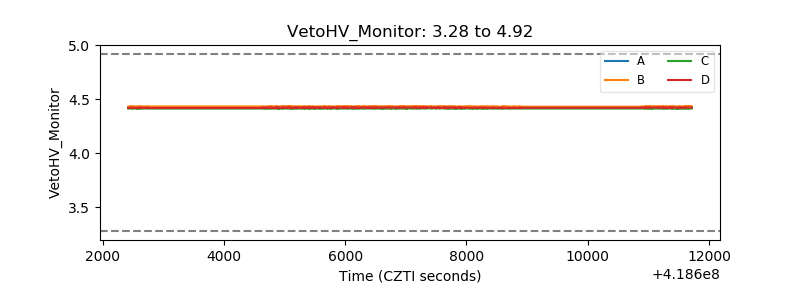 |
| Veto LLD | 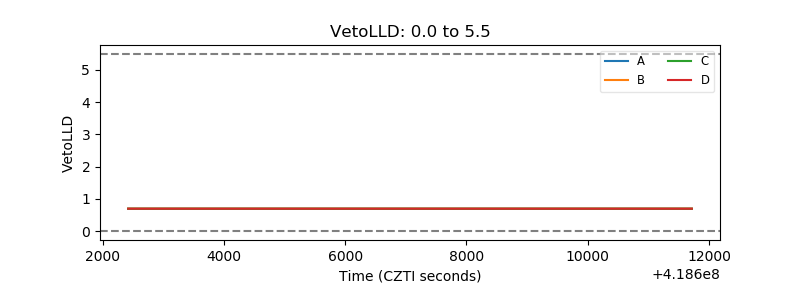 |
| Alpha Counter | 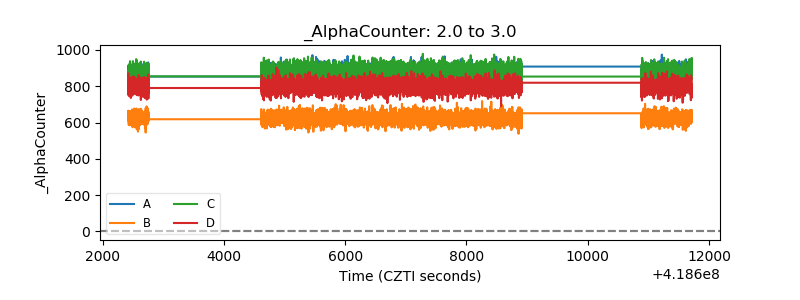 |
| _CPM_Rate | 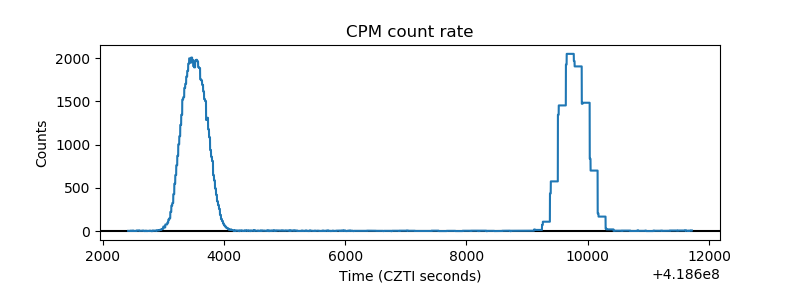 |
| CZT Counter | 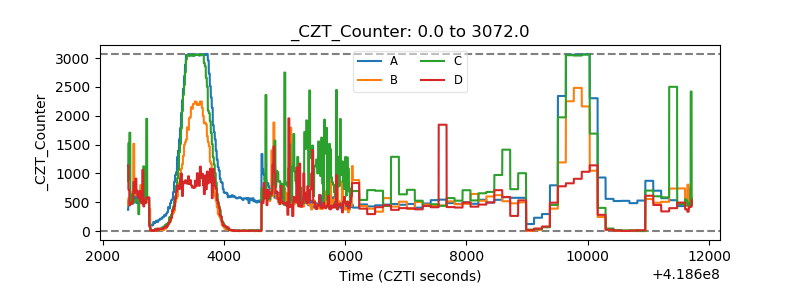 |
| +2.5 Volts monitor |  |
| +5 Volts monitor |  |
| _ROLL_ROT | 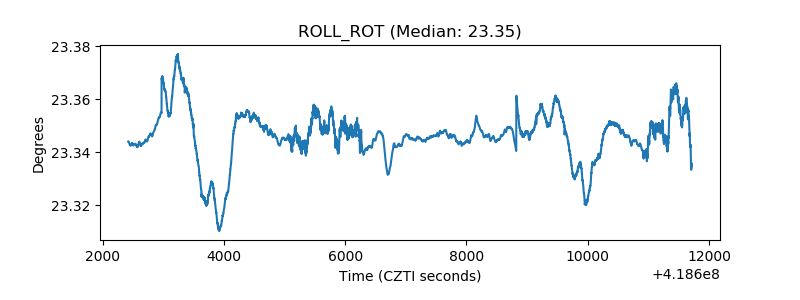 |
| _Roll_DEC | 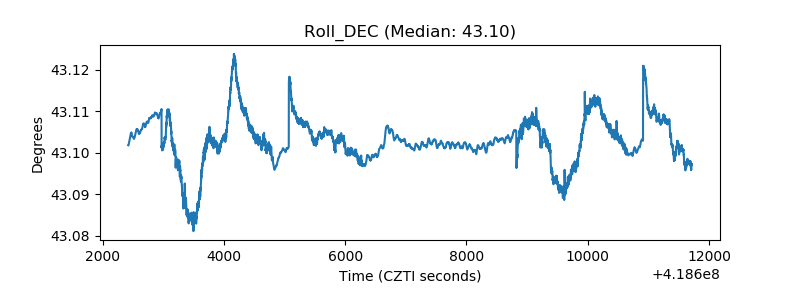 |
| _Roll_RA | 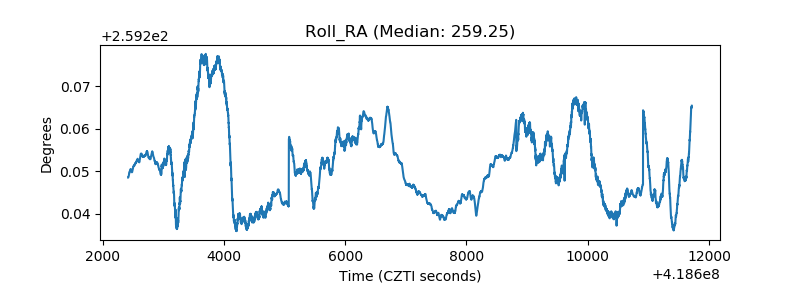 |
| Veto Counter | 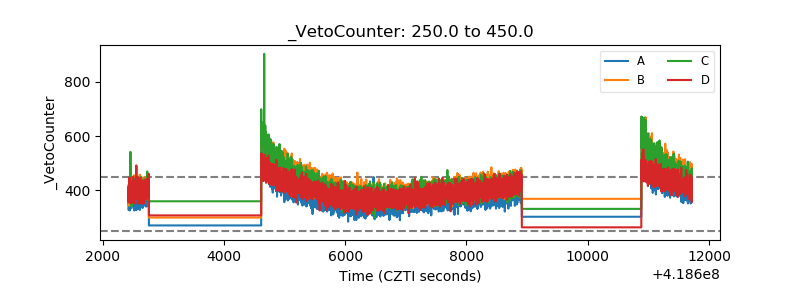 |