| Param | Original file | Final file |
|---|---|---|
| Filename | modeM0/AS1A12_029T02_9000005558_40692cztM0_level2.fits | modeM0/AS1A12_029T02_9000005558_40692cztM0_level2_quad_clean.evt |
| Size (bytes) | 377,274,240 | 81,227,520 |
| Size | 359.8 MB | 77.5 MB |
| Events in quadrant A | 2,716,088 | 590,829 |
| Events in quadrant B | 2,718,627 | 616,649 |
| Events in quadrant C | 5,804,479 | 499,289 |
| Events in quadrant D | 2,341,324 | 407,201 |
| Mode M0 | |||
|---|---|---|---|
| Quadrant | BADHDUFLAG | Total packets | Discarded packets |
| A | 0 | 11023 | 3 |
| B | 0 | 11296 | 2 |
| C | 0 | 20660 | 2 |
| D | 0 | 10739 | 2 |
| Mode M9 | |||
|---|---|---|---|
| Quadrant | BADHDUFLAG | Total packets | Discarded packets |
| A | 0 | 32 | 0 |
| B | 0 | 32 | 0 |
| C | 0 | 32 | 0 |
| D | 0 | 33 | 0 |
| Mode SS | |||
|---|---|---|---|
| Quadrant | BADHDUFLAG | Total packets | Discarded packets |
| A | 0 | 100 | 0 |
| B | 0 | 100 | 0 |
| C | 0 | 100 | 0 |
| D | 0 | 100 | 0 |
| Quadrant | Total seconds | Saturated seconds | Saturation percentage |
|---|---|---|---|
| A | 4929 | 13 | 0.263745% |
| B | 4929 | 61 | 1.237574% |
| C | 4929 | 877 | 17.792656% |
| D | 4929 | 1194 | 24.223981% |
Noise dominated data is calculated using 1-second bins in cleaned event files. If a bin has >2000 counts, and if more than 50% of those come from <1% of pixels, then it is considered to be noise-dominated and hence unusable.
| Quadrant | # 1 sec bins | Bins with >0 counts | Bins with >2000 counts | High rate bins dominated by noise | Noise dominated (total time) | Noise dominated (detector-on time) | Marked lightcurve |
|---|---|---|---|---|---|---|---|
| A | 7022 | 4930 | 5 | 5 | 0.07% | 0.10% | 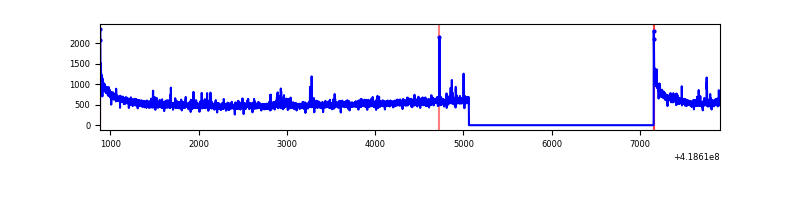 |
| B | 7022 | 4930 | 34 | 34 | 0.48% | 0.69% | 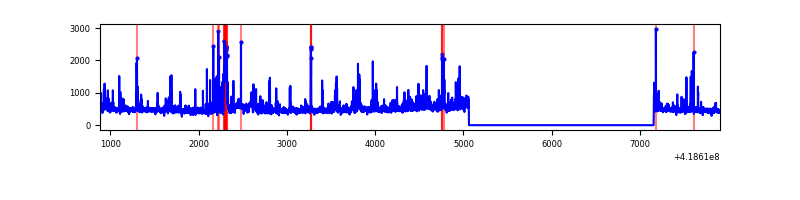 |
| C | 7022 | 4929 | 880 | 880 | 12.53% | 17.85% | 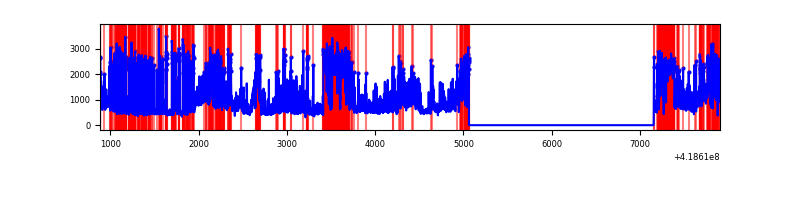 |
| D | 7022 | 4929 | 35 | 35 | 0.50% | 0.71% | 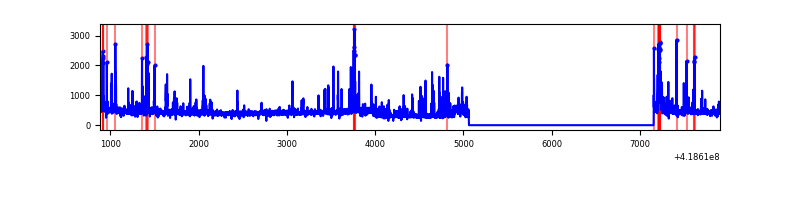 |
Top three noisy pixels from each quadrant. If the there are fewer than three noisy pixels in the level2.evt file, extra rows are filled as -1
| Pixel properties | Quadrant properties | ||||||
|---|---|---|---|---|---|---|---|
| Quadrant | DetID | PixID | Counts | Sigma | Mean | Median | Sigma |
| A | 10 | 83 | 470530 | 4107.83 | 559 | 549 | 114.4 |
| A | 12 | 189 | 50209 | 434.05 | 559 | 549 | 114.4 |
| A | 2 | 79 | 19425 | 164.98 | 559 | 549 | 114.4 |
| B | 0 | 229 | 292816 | 2735.59 | 560 | 545 | 106.8 |
| B | 5 | 255 | 104563 | 973.59 | 560 | 545 | 106.8 |
| B | 0 | 190 | 59324 | 550.16 | 560 | 545 | 106.8 |
| C | 9 | 187 | 2893283 | 24339.74 | 512 | 516 | 118.8 |
| C | 14 | 254 | 568353 | 4777.78 | 512 | 516 | 118.8 |
| C | 15 | 214 | 202515 | 1699.62 | 512 | 516 | 118.8 |
| D | 12 | 191 | 261084 | 2451.96 | 430 | 418 | 106.3 |
| D | 2 | 249 | 135594 | 1271.53 | 430 | 418 | 106.3 |
| D | 2 | 250 | 119763 | 1122.62 | 430 | 418 | 106.3 |
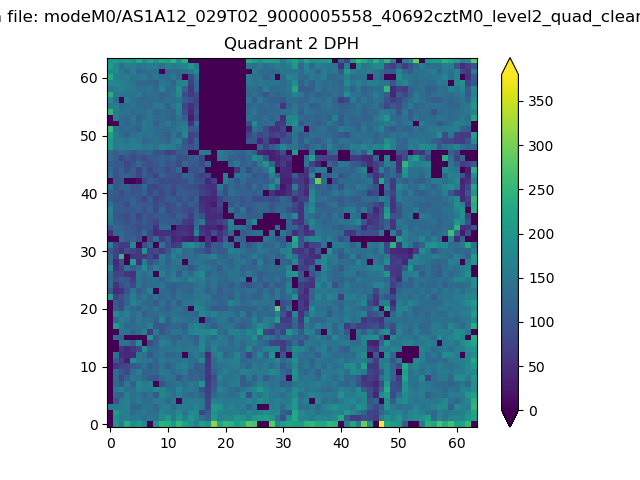
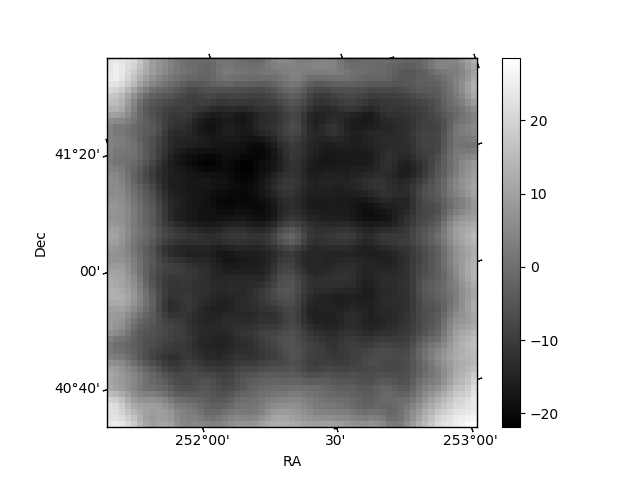
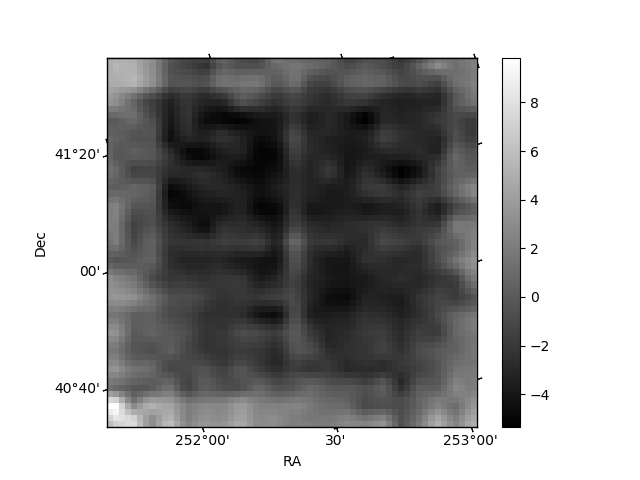
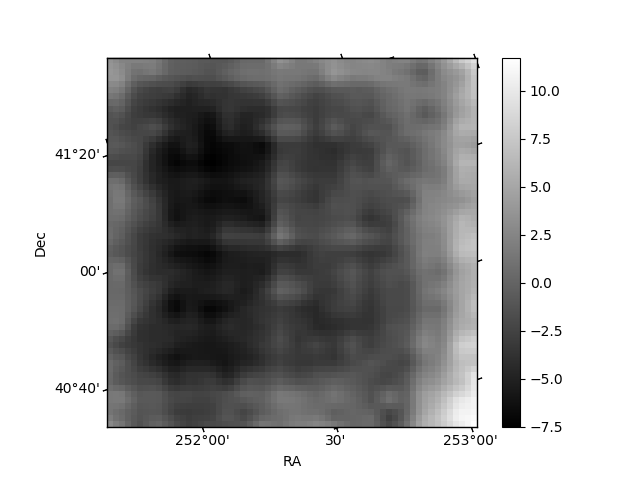
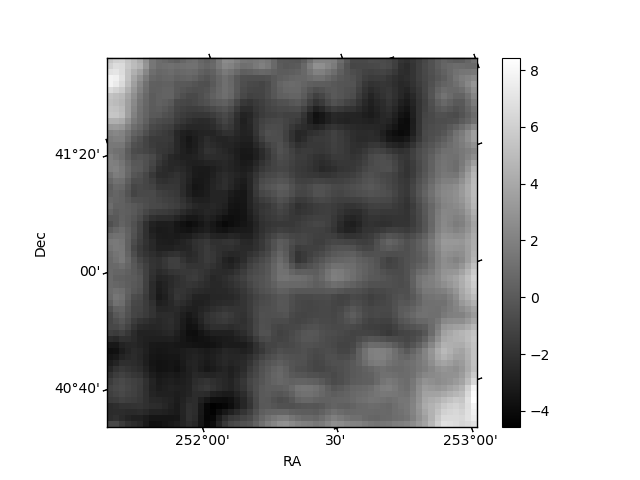
Histogram calculated using DETX and DETY for each event in the final _common_clean file
| Quadrant A | 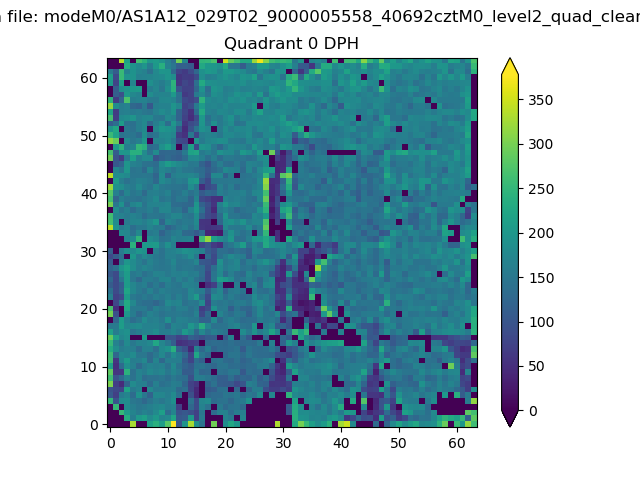 |
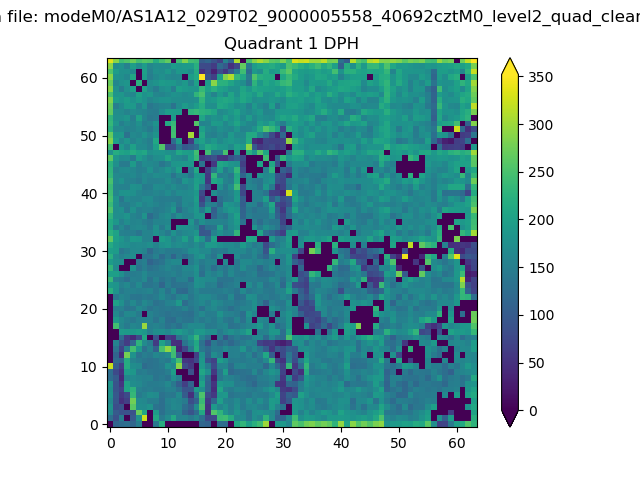 |
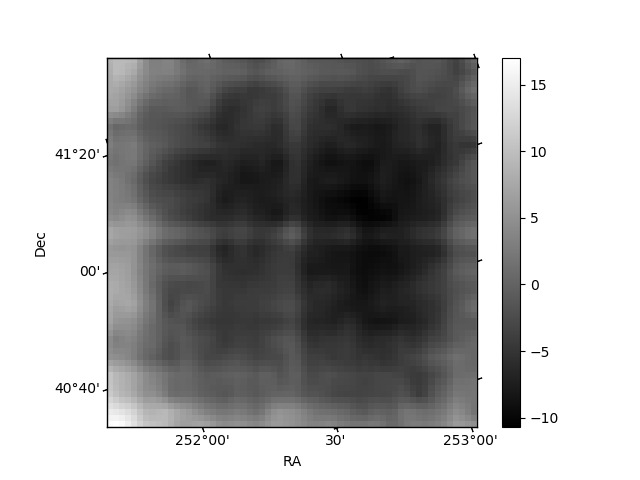
Quadrant B |
|---|---|---|---|
| Quadrant D | 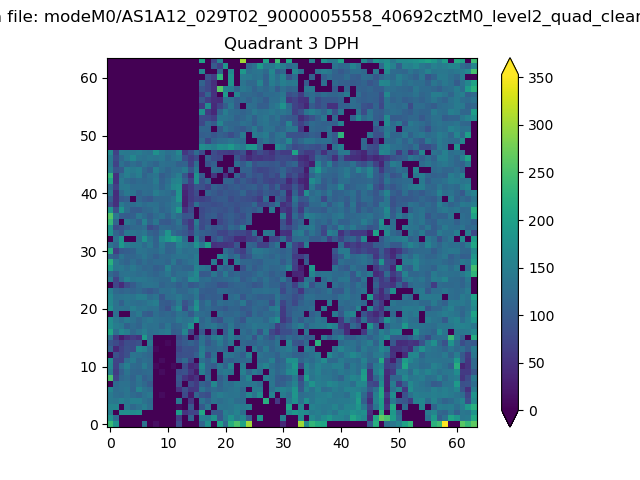 |
 |
Quadrant C |
| Plot type | Count rate plots | Images |
|---|---|---|
| Comparison with Poisson distribution Blue bars denote a histogram of data divided into 1 sec bins. Red curve is a Poisson curve with rate = median count rate of data. |
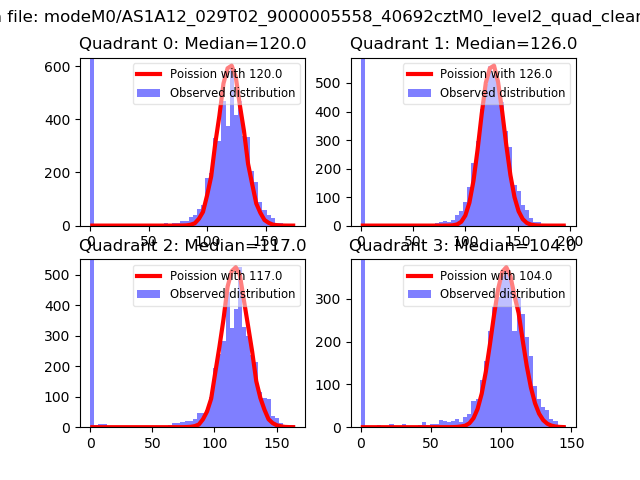 |
 |
| Quadrant-wise count rates Data is divided into 100 sec bins |
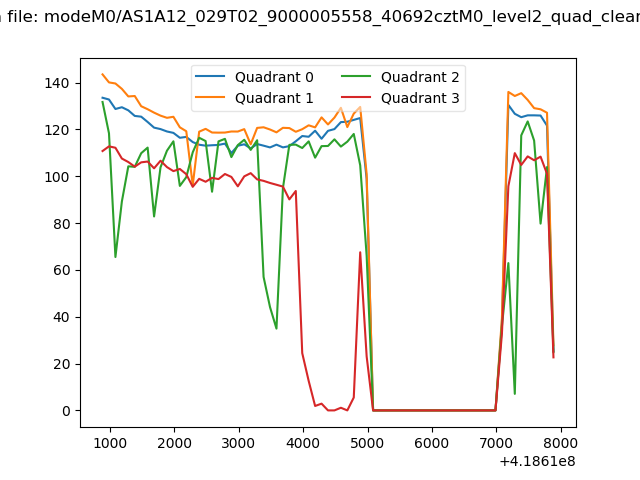 |
|
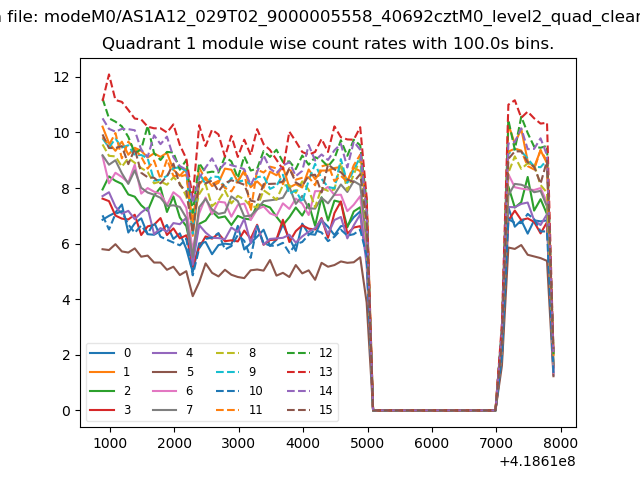
| Module-wise count rates for Quadrant A Data is divided into 100 sec bins |
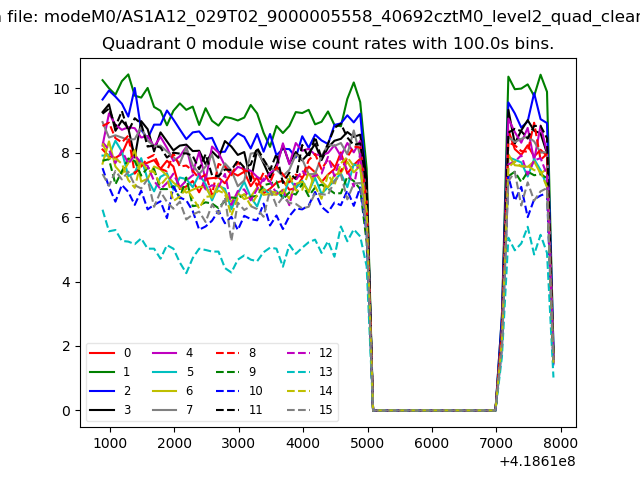 |
 |
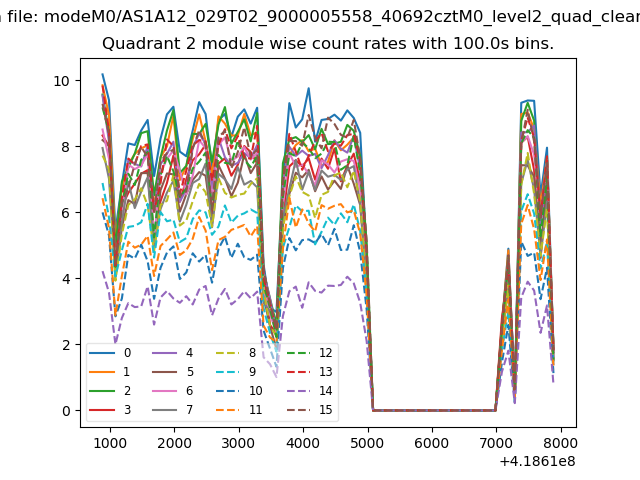
| Module-wise count rates for Quadrant B Data is divided into 100 sec bins |
 |
 |
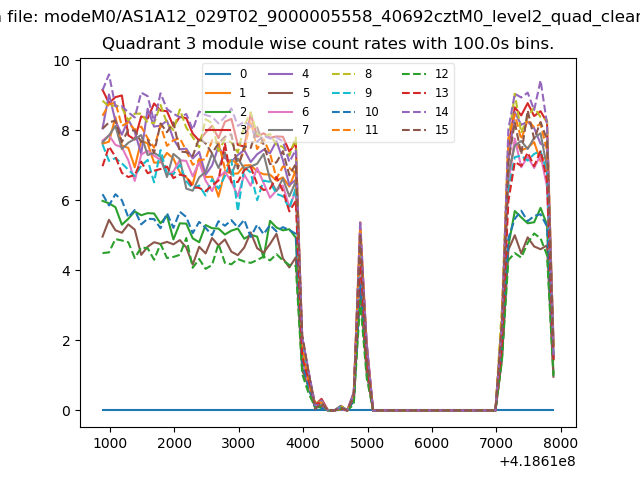
| Module-wise count rates for Quadrant C Data is divided into 100 sec bins |
 |
 |
| Module-wise count rates for Quadrant D Data is divided into 100 sec bins |
 |
 |
| Parameter | Plot |
|---|---|
| CZT HV Monitor | 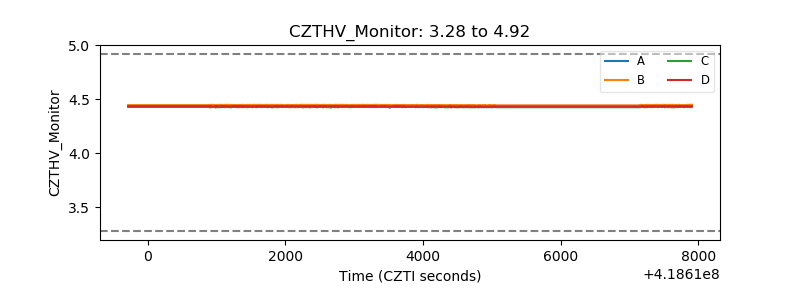 |
| D_VDD | 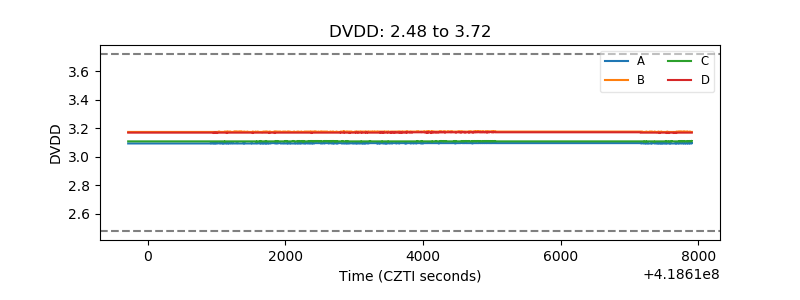 |
| Temperature 1 | 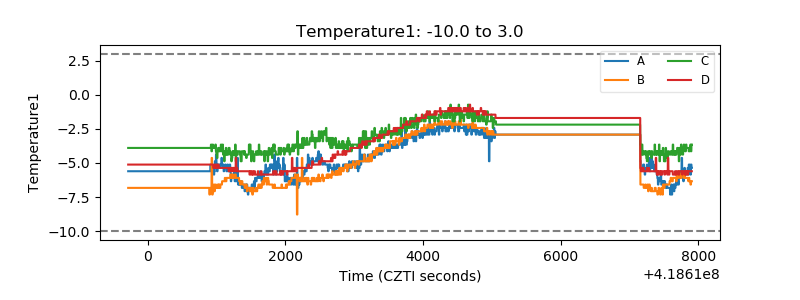 |
| Veto HV Monitor |  |
| Veto LLD | 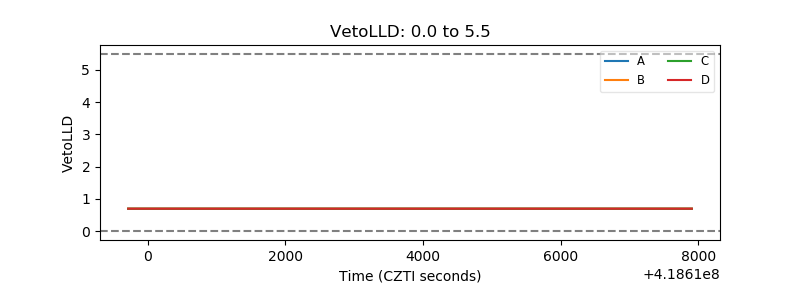 |
| Alpha Counter | 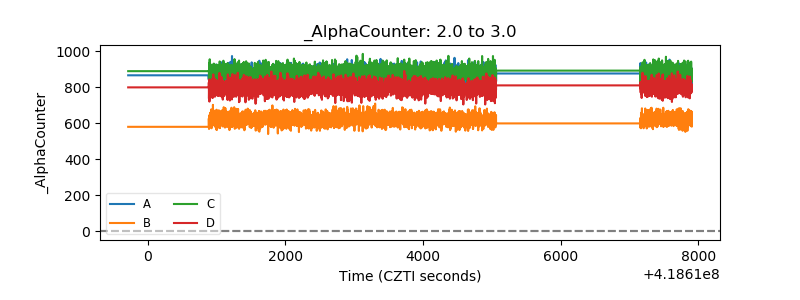 |
| _CPM_Rate | 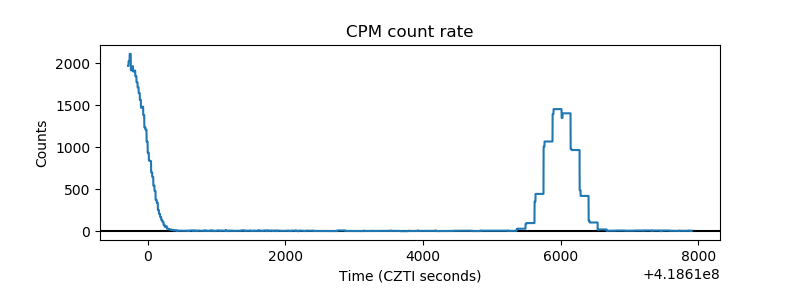 |
| CZT Counter | 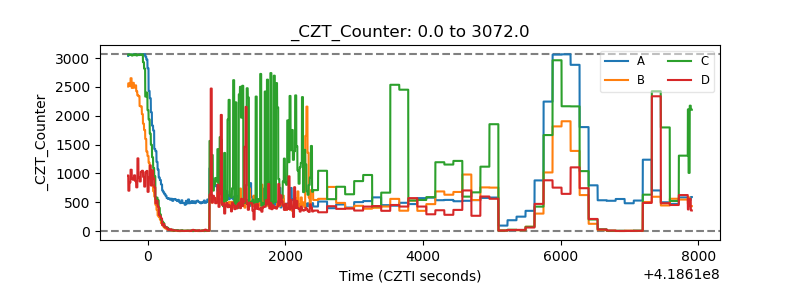 |
| +2.5 Volts monitor | 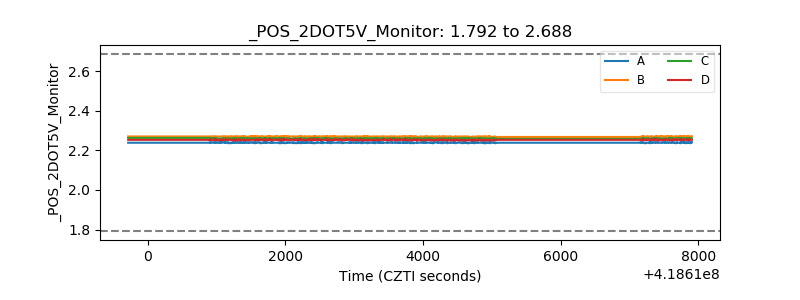 |
| +5 Volts monitor |  |
| _ROLL_ROT | 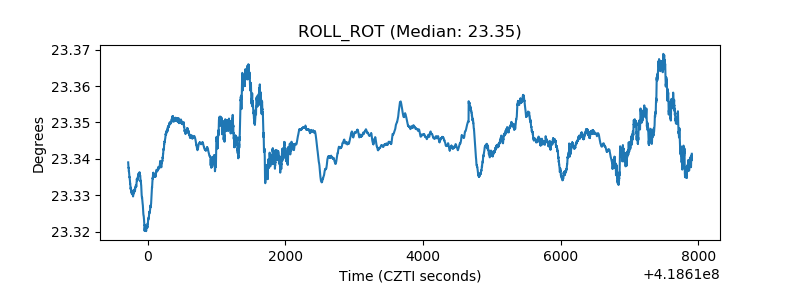 |
| _Roll_DEC | 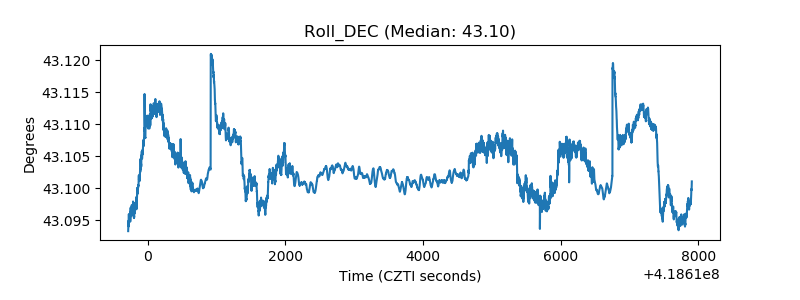 |
| _Roll_RA | 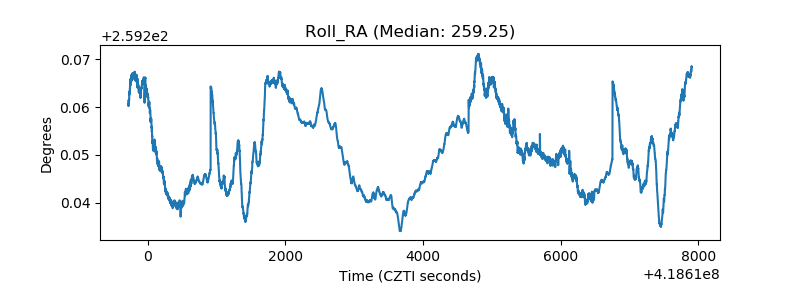 |
| Veto Counter | 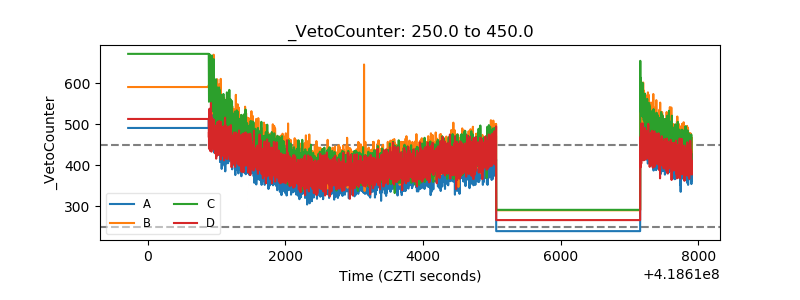 |