| Param | Original file | Final file |
|---|---|---|
| Filename | modeM0/AS1A12_029T02_9000005558_40695cztM0_level2.fits | modeM0/AS1A12_029T02_9000005558_40695cztM0_level2_quad_clean.evt |
| Size (bytes) | 512,268,480 | 81,152,640 |
| Size | 488.5 MB | 77.4 MB |
| Events in quadrant A | 2,819,815 | 586,030 |
| Events in quadrant B | 4,025,287 | 595,961 |
| Events in quadrant C | 6,750,505 | 482,786 |
| Events in quadrant D | 4,952,542 | 418,273 |
| Mode M0 | |||
|---|---|---|---|
| Quadrant | BADHDUFLAG | Total packets | Discarded packets |
| A | 0 | 11405 | 3 |
| B | 0 | 15496 | 2 |
| C | 0 | 23734 | 2 |
| D | 0 | 18499 | 2 |
| Mode M9 | |||
|---|---|---|---|
| Quadrant | BADHDUFLAG | Total packets | Discarded packets |
| A | 0 | 23 | 0 |
| B | 0 | 23 | 0 |
| C | 0 | 23 | 0 |
| D | 0 | 24 | 0 |
| Mode SS | |||
|---|---|---|---|
| Quadrant | BADHDUFLAG | Total packets | Discarded packets |
| A | 0 | 110 | 0 |
| B | 0 | 110 | 0 |
| C | 0 | 110 | 0 |
| D | 0 | 110 | 0 |
| Quadrant | Total seconds | Saturated seconds | Saturation percentage |
|---|---|---|---|
| A | 5333 | 6 | 0.112507% |
| B | 5333 | 213 | 3.994000% |
| C | 5333 | 1156 | 21.676355% |
| D | 5333 | 1290 | 24.189012% |
Noise dominated data is calculated using 1-second bins in cleaned event files. If a bin has >2000 counts, and if more than 50% of those come from <1% of pixels, then it is considered to be noise-dominated and hence unusable.
| Quadrant | # 1 sec bins | Bins with >0 counts | Bins with >2000 counts | High rate bins dominated by noise | Noise dominated (total time) | Noise dominated (detector-on time) | Marked lightcurve |
|---|---|---|---|---|---|---|---|
| A | 7247 | 5334 | 4 | 4 | 0.06% | 0.07% | 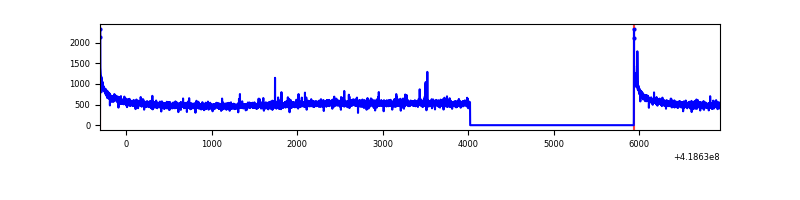 |
| B | 7247 | 5334 | 103 | 103 | 1.42% | 1.93% | 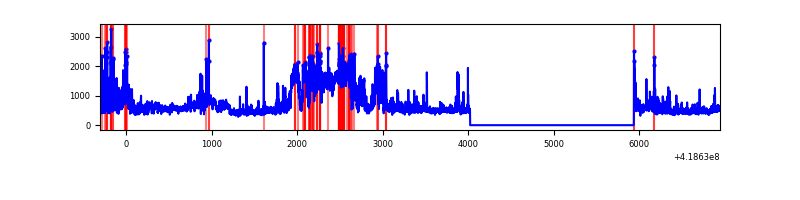 |
| C | 7247 | 5333 | 1090 | 1090 | 15.04% | 20.44% | 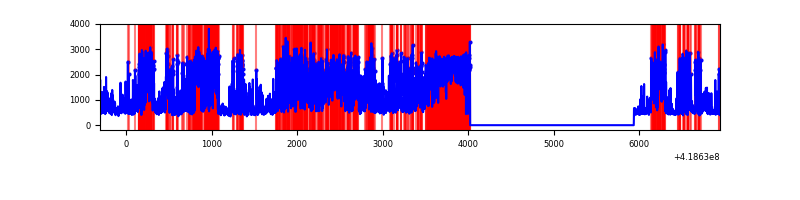 |
| D | 7247 | 5334 | 787 | 787 | 10.86% | 14.75% | 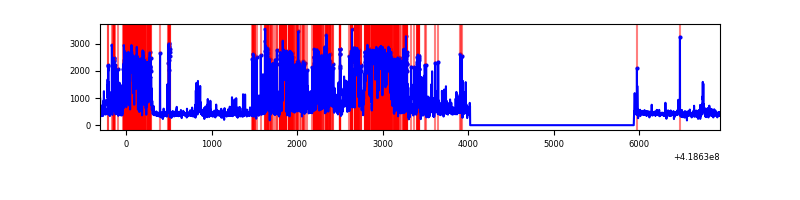 |
Top three noisy pixels from each quadrant. If the there are fewer than three noisy pixels in the level2.evt file, extra rows are filled as -1
| Pixel properties | Quadrant properties | ||||||
|---|---|---|---|---|---|---|---|
| Quadrant | DetID | PixID | Counts | Sigma | Mean | Median | Sigma |
| A | 10 | 83 | 502243 | 4122.23 | 593 | 581 | 121.7 |
| A | 6 | 10 | 11239 | 87.58 | 593 | 581 | 121.7 |
| A | 13 | 254 | 7331 | 55.47 | 593 | 581 | 121.7 |
| B | 5 | 172 | 1113456 | 9829.77 | 584 | 570 | 113.2 |
| B | 0 | 229 | 217115 | 1912.67 | 584 | 570 | 113.2 |
| B | 0 | 190 | 180249 | 1587.05 | 584 | 570 | 113.2 |
| C | 9 | 187 | 4241961 | 34053.69 | 534 | 536 | 124.6 |
| C | 15 | 214 | 222088 | 1778.8 | 534 | 536 | 124.6 |
| C | 14 | 254 | 178399 | 1428.03 | 534 | 536 | 124.6 |
| D | 12 | 227 | 1696657 | 13450.6 | 508 | 495 | 126.1 |
| D | 2 | 250 | 845401 | 6700.12 | 508 | 495 | 126.1 |
| D | 12 | 191 | 137102 | 1083.3 | 508 | 495 | 126.1 |
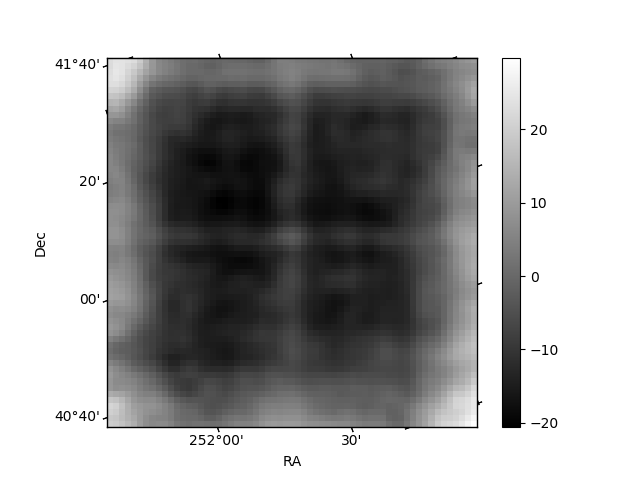
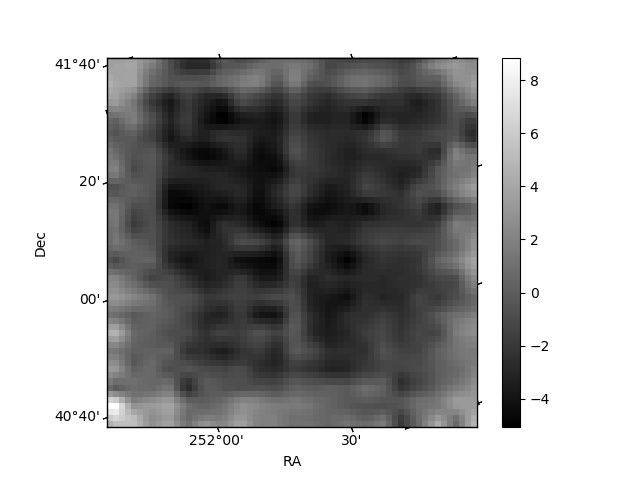
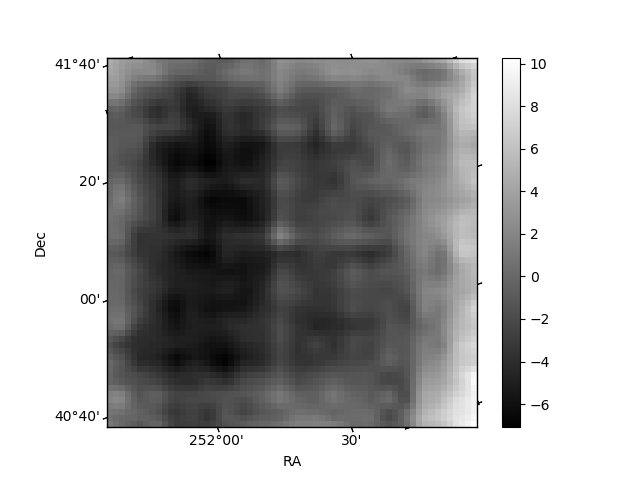
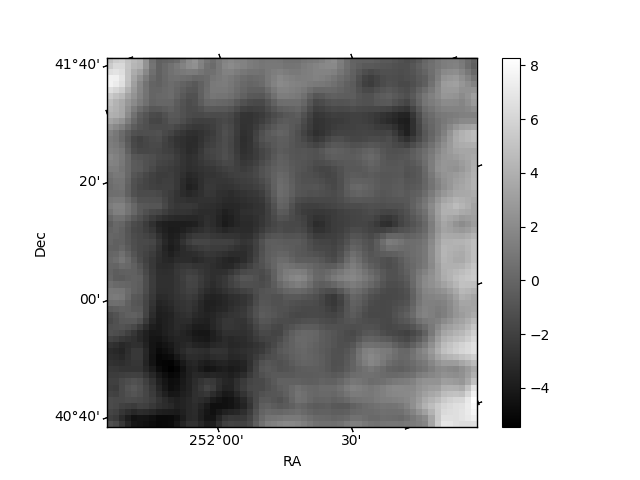
Histogram calculated using DETX and DETY for each event in the final _common_clean file
| Quadrant A | 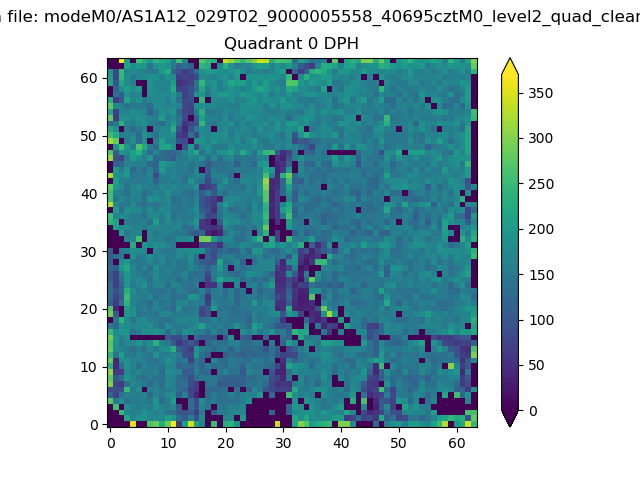 |
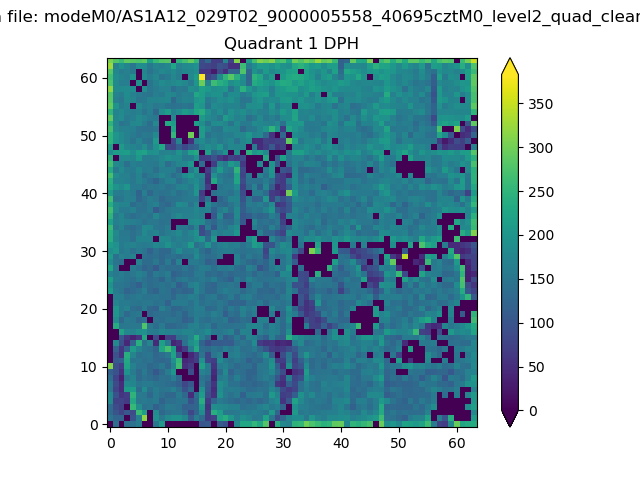 |
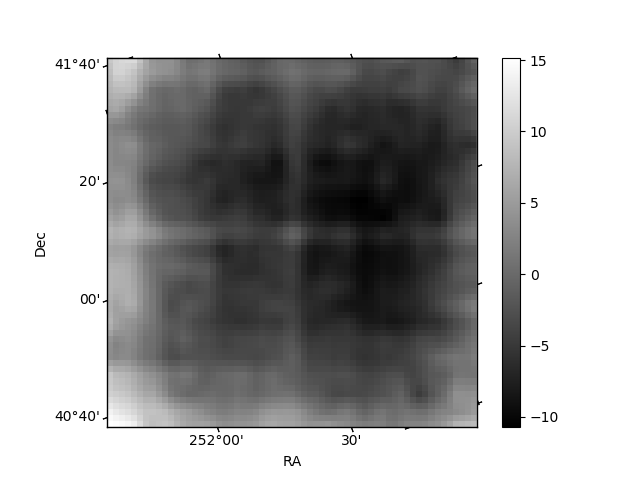
Quadrant B |
|---|---|---|---|
| Quadrant D | 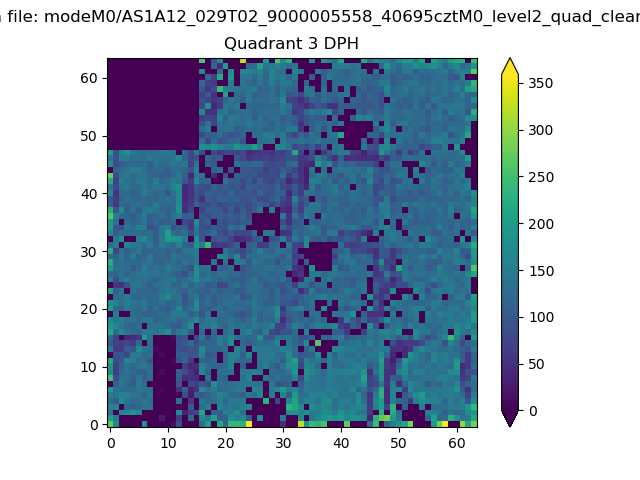 |
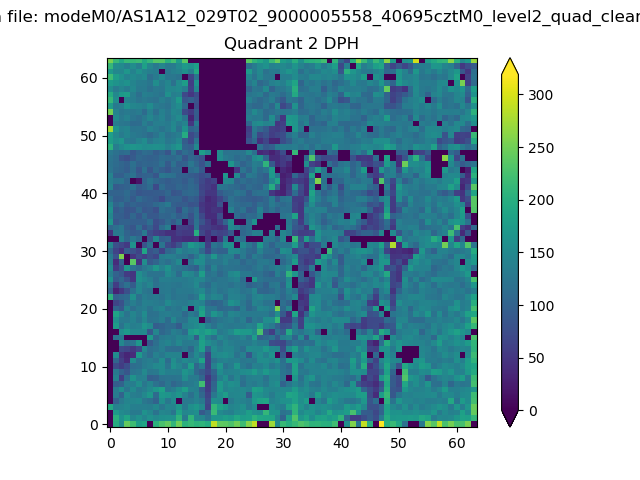 |
Quadrant C |
| Plot type | Count rate plots | Images |
|---|---|---|
| Comparison with Poisson distribution Blue bars denote a histogram of data divided into 1 sec bins. Red curve is a Poisson curve with rate = median count rate of data. |
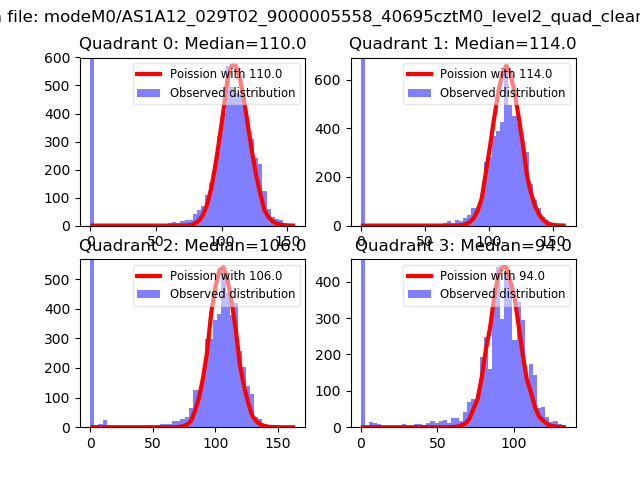 |
 |
| Quadrant-wise count rates Data is divided into 100 sec bins |
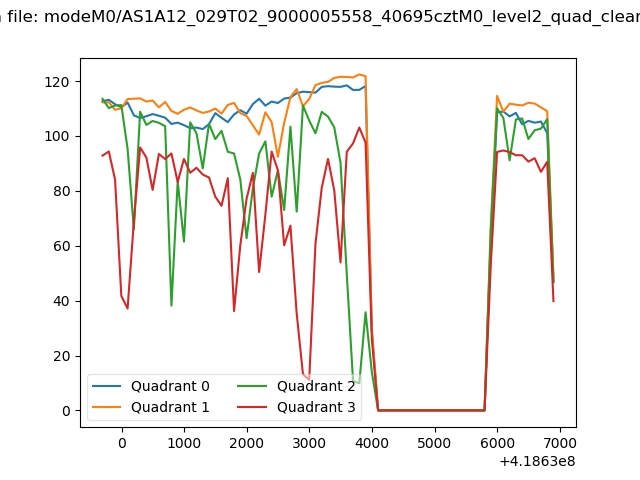 |
|
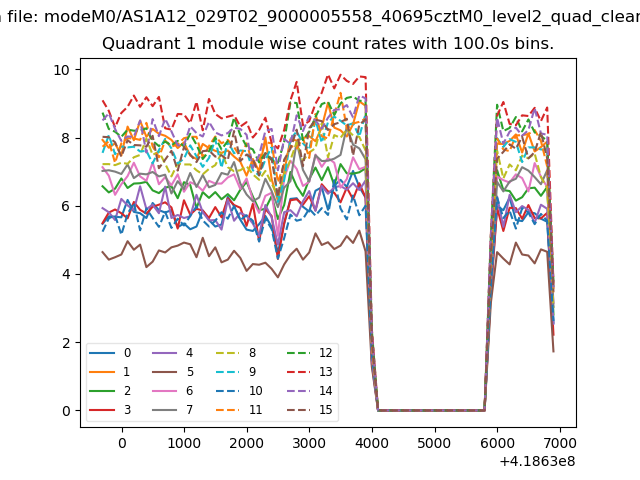
| Module-wise count rates for Quadrant A Data is divided into 100 sec bins |
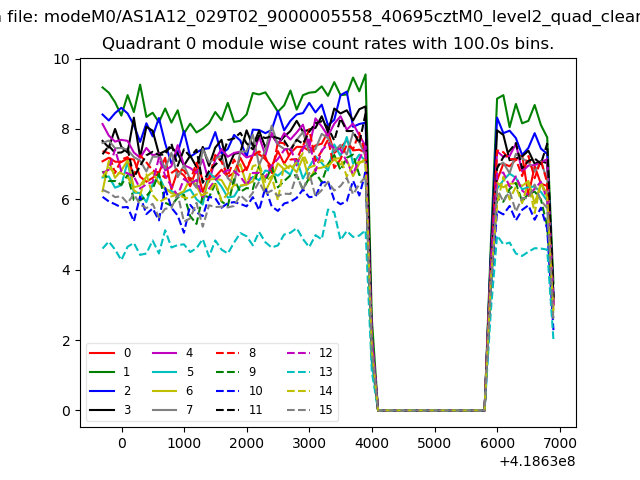 |
 |
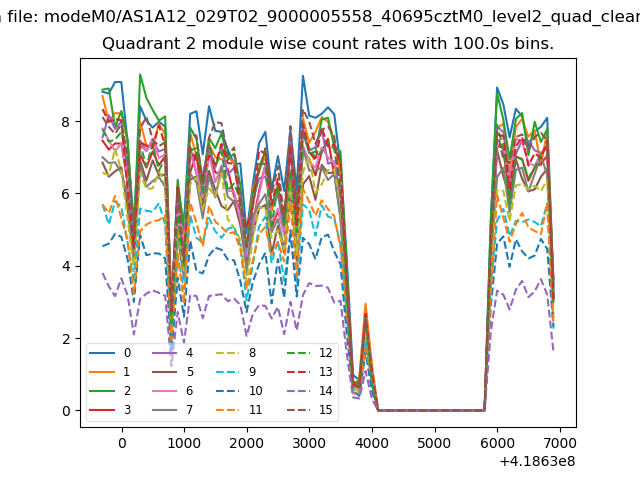
| Module-wise count rates for Quadrant B Data is divided into 100 sec bins |
 |
 |
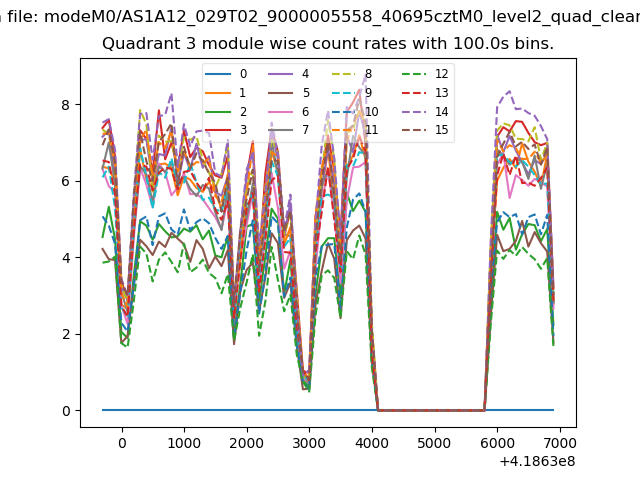
| Module-wise count rates for Quadrant C Data is divided into 100 sec bins |
 |
 |
| Module-wise count rates for Quadrant D Data is divided into 100 sec bins |
 |
 |
| Parameter | Plot |
|---|---|
| CZT HV Monitor | 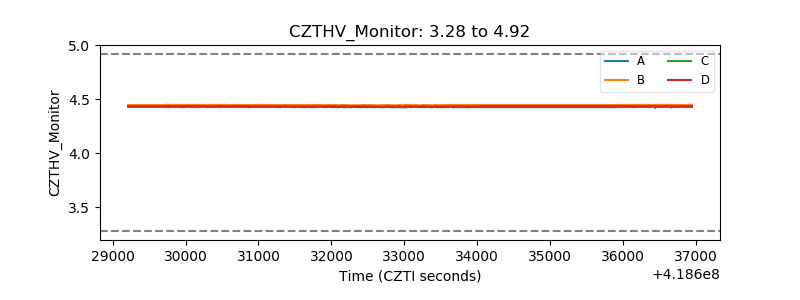 |
| D_VDD | 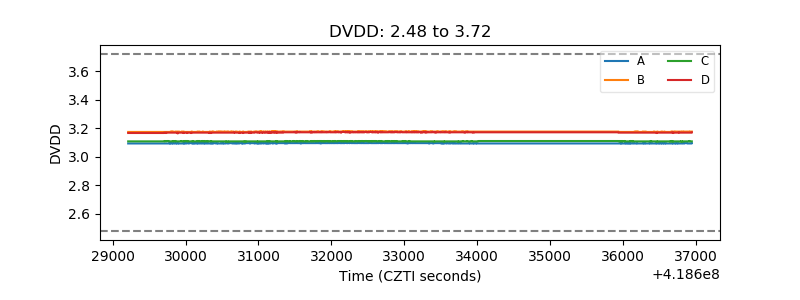 |
| Temperature 1 | 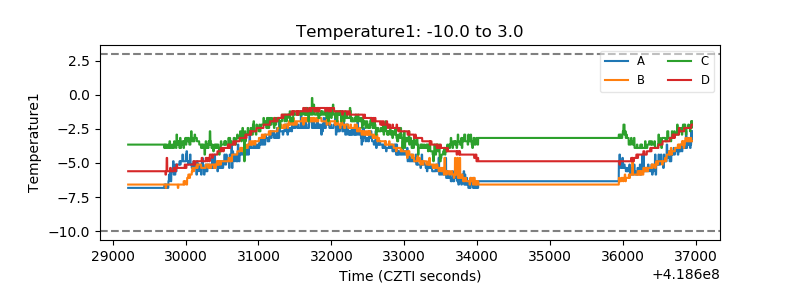 |
| Veto HV Monitor | 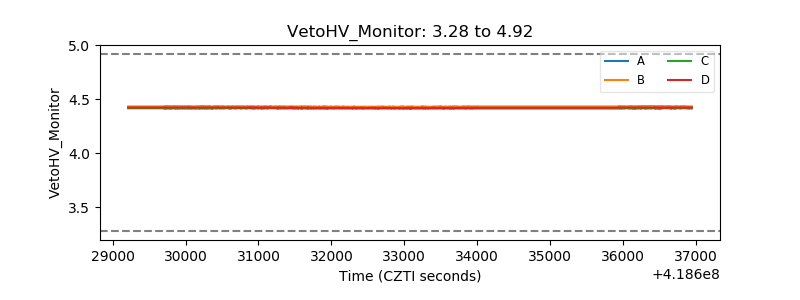 |
| Veto LLD | 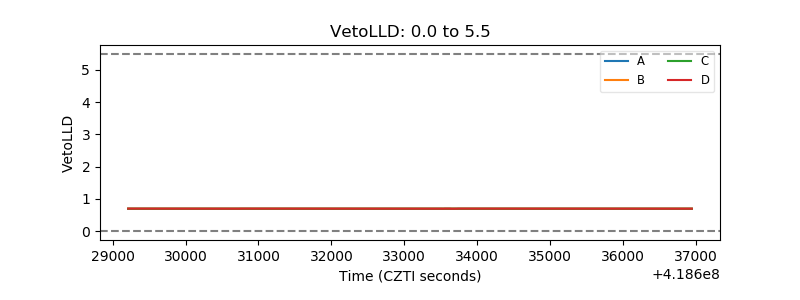 |
| Alpha Counter | 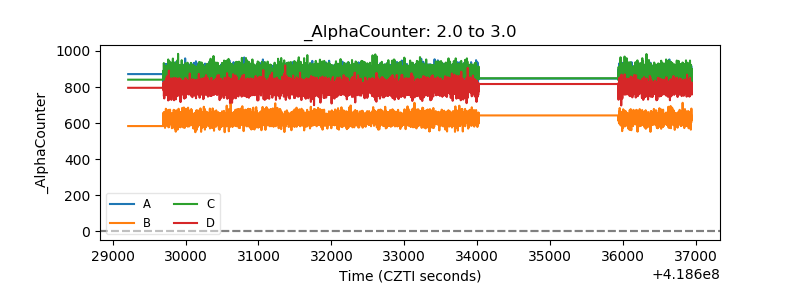 |
| _CPM_Rate | 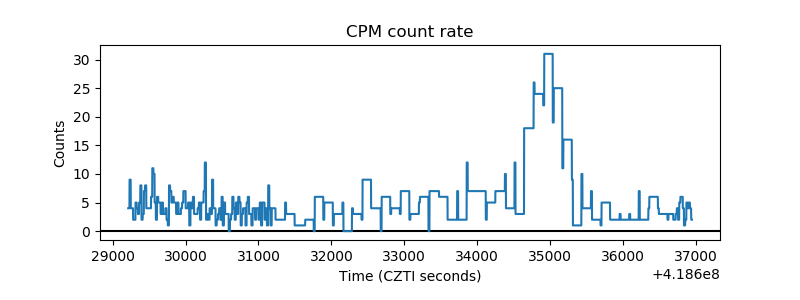 |
| CZT Counter | 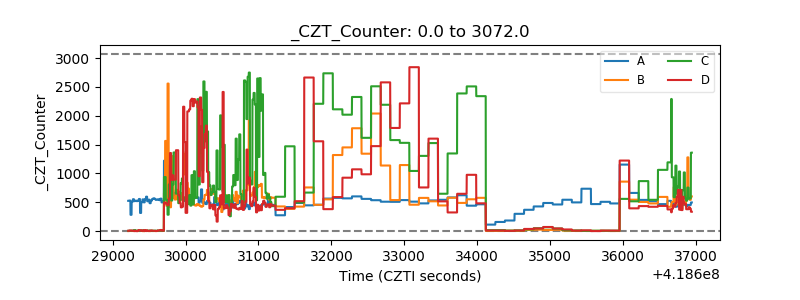 |
| +2.5 Volts monitor |  |
| +5 Volts monitor |  |
| _ROLL_ROT | 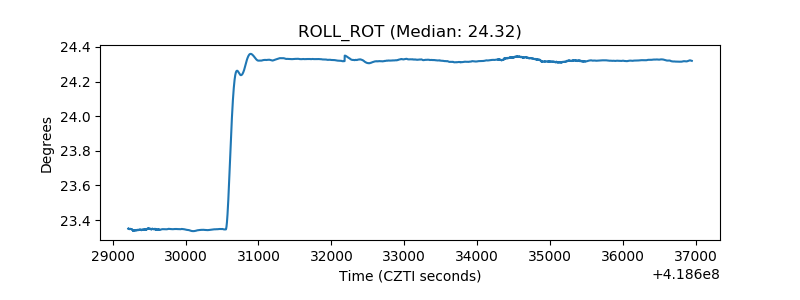 |
| _Roll_DEC | 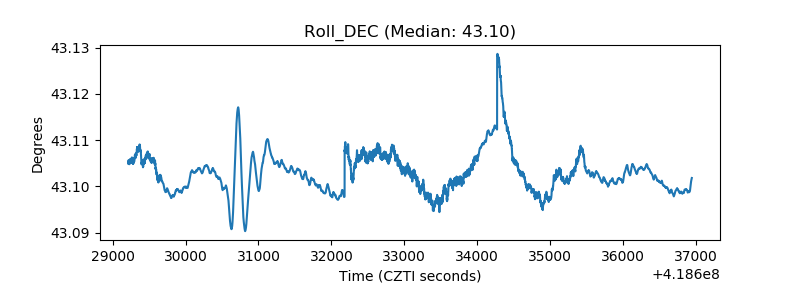 |
| _Roll_RA | 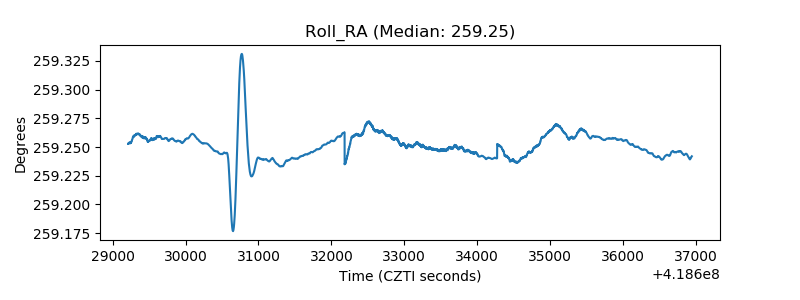 |
| Veto Counter | 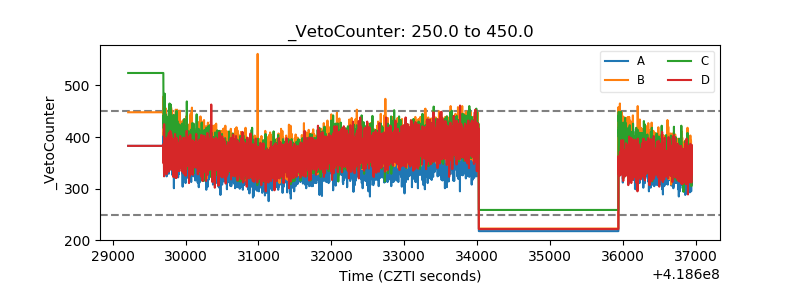 |