| Param | Original file | Final file |
|---|---|---|
| Filename | modeM0/AS1A12_029T02_9000005558_40696cztM0_level2.fits | modeM0/AS1A12_029T02_9000005558_40696cztM0_level2_quad_clean.evt |
| Size (bytes) | 419,797,440 | 87,353,280 |
| Size | 400.4 MB | 83.3 MB |
| Events in quadrant A | 3,029,955 | 602,873 |
| Events in quadrant B | 3,134,888 | 618,028 |
| Events in quadrant C | 5,879,789 | 560,121 |
| Events in quadrant D | 3,062,979 | 475,115 |
| Mode M0 | |||
|---|---|---|---|
| Quadrant | BADHDUFLAG | Total packets | Discarded packets |
| A | 0 | 12244 | 3 |
| B | 0 | 12998 | 2 |
| C | 0 | 21274 | 2 |
| D | 0 | 12837 | 2 |
| Mode M9 | |||
|---|---|---|---|
| Quadrant | BADHDUFLAG | Total packets | Discarded packets |
| A | 0 | 16 | 0 |
| B | 0 | 16 | 0 |
| C | 0 | 16 | 0 |
| D | 0 | 17 | 0 |
| Mode SS | |||
|---|---|---|---|
| Quadrant | BADHDUFLAG | Total packets | Discarded packets |
| A | 0 | 114 | 0 |
| B | 0 | 114 | 0 |
| C | 0 | 114 | 0 |
| D | 0 | 114 | 0 |
| Quadrant | Total seconds | Saturated seconds | Saturation percentage |
|---|---|---|---|
| A | 5550 | 14 | 0.252252% |
| B | 5550 | 85 | 1.531532% |
| C | 5550 | 502 | 9.045045% |
| D | 5550 | 821 | 14.792793% |
Noise dominated data is calculated using 1-second bins in cleaned event files. If a bin has >2000 counts, and if more than 50% of those come from <1% of pixels, then it is considered to be noise-dominated and hence unusable.
| Quadrant | # 1 sec bins | Bins with >0 counts | Bins with >2000 counts | High rate bins dominated by noise | Noise dominated (total time) | Noise dominated (detector-on time) | Marked lightcurve |
|---|---|---|---|---|---|---|---|
| A | 7133 | 5551 | 6 | 6 | 0.08% | 0.11% | 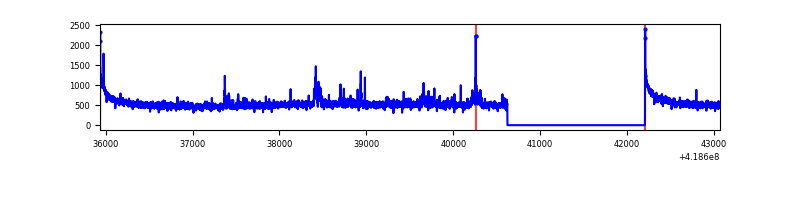 |
| B | 7133 | 5551 | 52 | 52 | 0.73% | 0.94% | 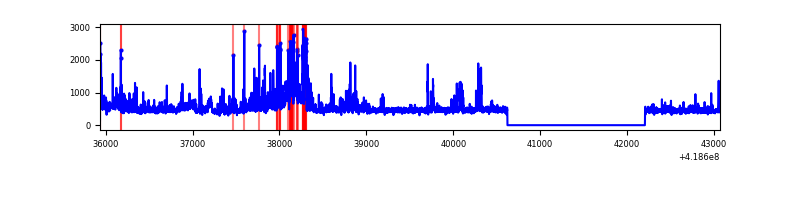 |
| C | 7133 | 5551 | 531 | 531 | 7.44% | 9.57% | 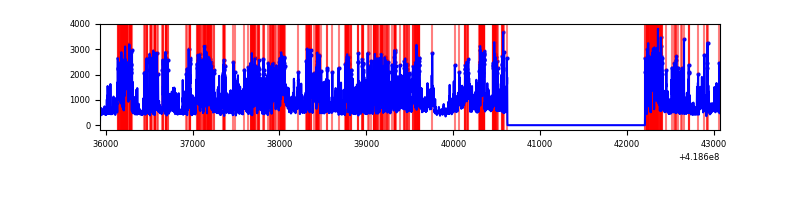 |
| D | 7132 | 5550 | 85 | 85 | 1.19% | 1.53% | 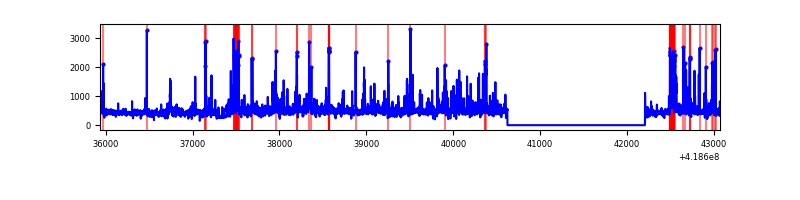 |
Top three noisy pixels from each quadrant. If the there are fewer than three noisy pixels in the level2.evt file, extra rows are filled as -1
| Pixel properties | Quadrant properties | ||||||
|---|---|---|---|---|---|---|---|
| Quadrant | DetID | PixID | Counts | Sigma | Mean | Median | Sigma |
| A | 10 | 83 | 512857 | 3985.6 | 617 | 604 | 128.5 |
| A | 12 | 189 | 59234 | 456.17 | 617 | 604 | 128.5 |
| A | 6 | 10 | 49525 | 380.63 | 617 | 604 | 128.5 |
| B | 0 | 229 | 310717 | 2611.99 | 610 | 592 | 118.7 |
| B | 0 | 190 | 186342 | 1564.46 | 610 | 592 | 118.7 |
| B | 5 | 172 | 156091 | 1309.67 | 610 | 592 | 118.7 |
| C | 9 | 187 | 3274489 | 23633.78 | 583 | 583 | 138.5 |
| C | 15 | 214 | 238763 | 1719.38 | 583 | 583 | 138.5 |
| C | 10 | 20 | 41938 | 298.53 | 583 | 583 | 138.5 |
| D | 12 | 191 | 202716 | 1480.24 | 550 | 534 | 136.6 |
| D | 2 | 250 | 191151 | 1395.56 | 550 | 534 | 136.6 |
| D | 13 | 249 | 135650 | 989.23 | 550 | 534 | 136.6 |
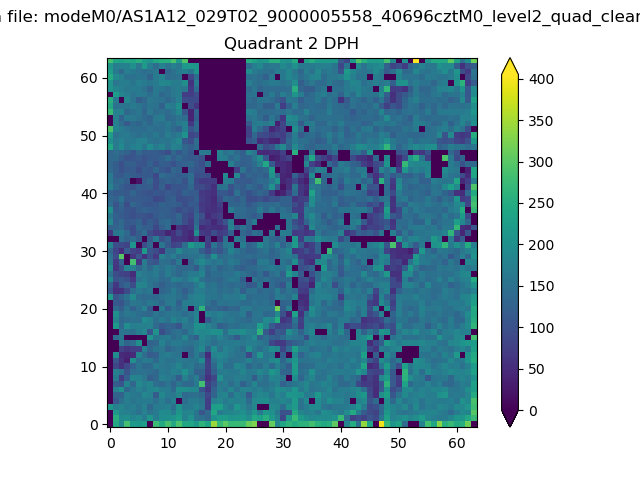
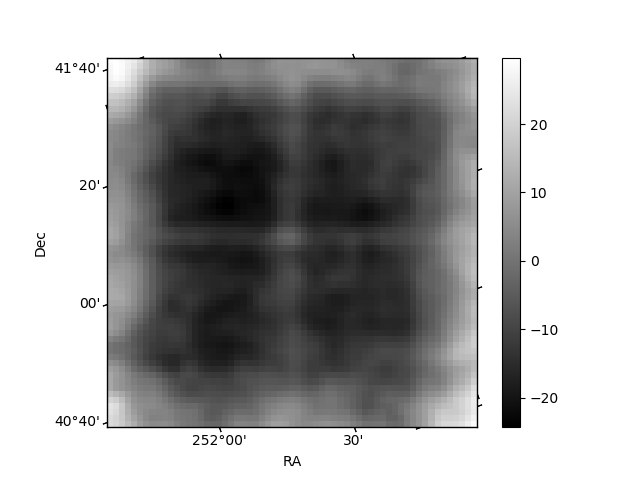
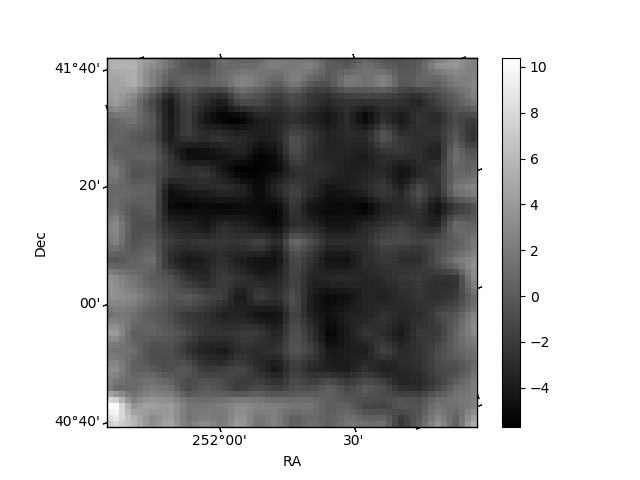
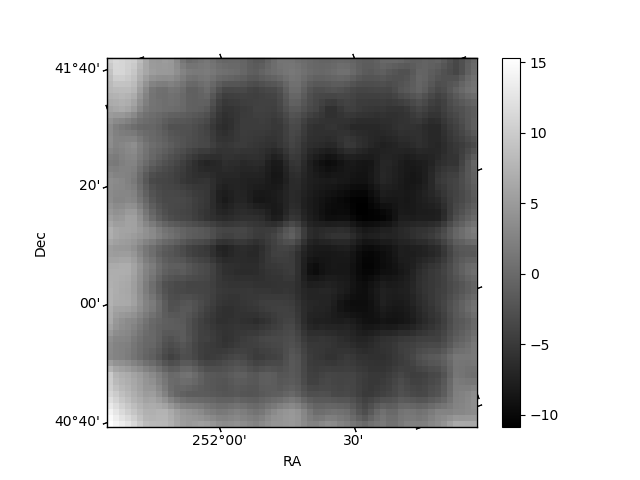
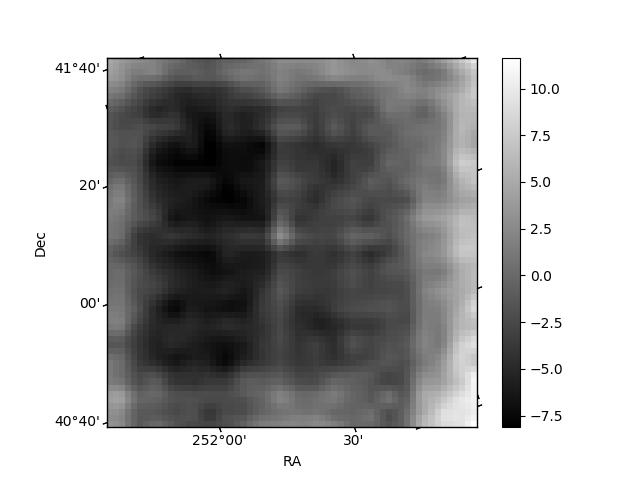
Histogram calculated using DETX and DETY for each event in the final _common_clean file
| Quadrant A | 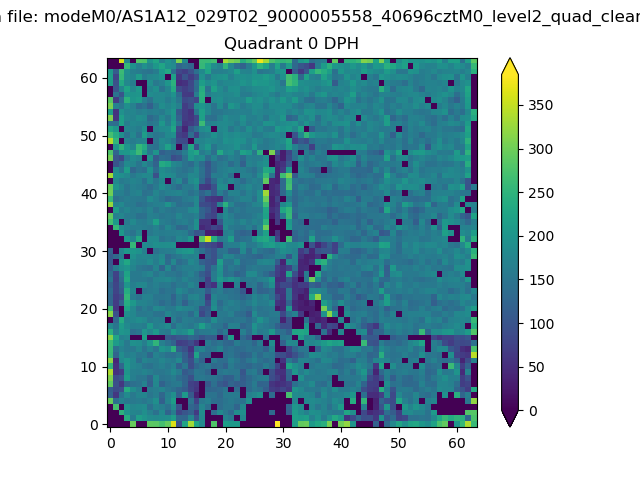 |
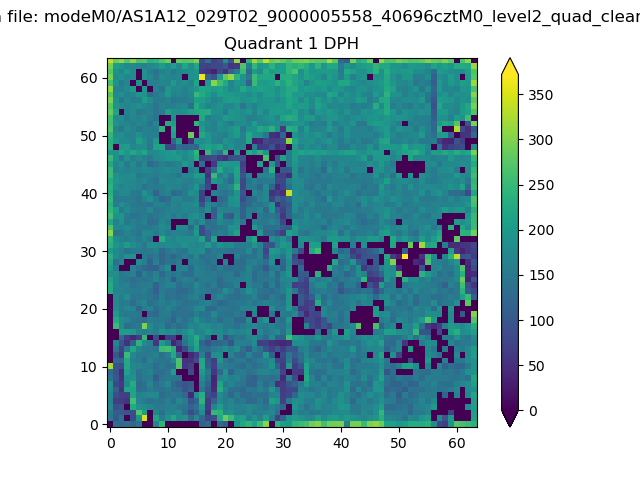 |
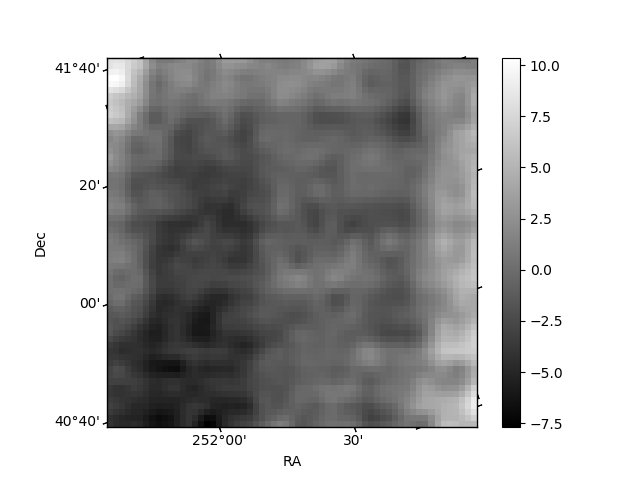
Quadrant B |
|---|---|---|---|
| Quadrant D | 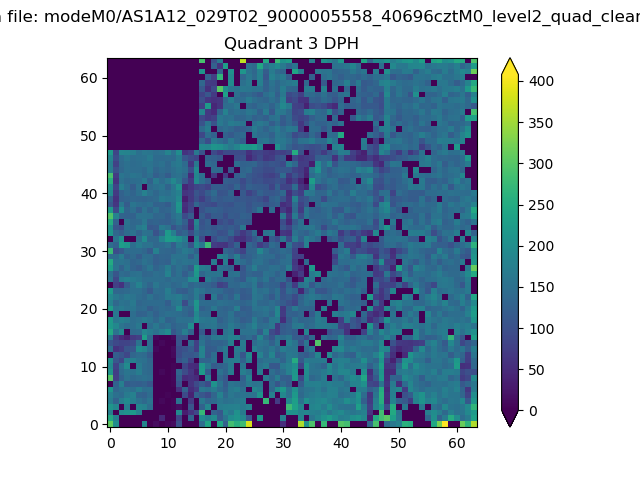 |
 |
Quadrant C |
| Plot type | Count rate plots | Images |
|---|---|---|
| Comparison with Poisson distribution Blue bars denote a histogram of data divided into 1 sec bins. Red curve is a Poisson curve with rate = median count rate of data. |
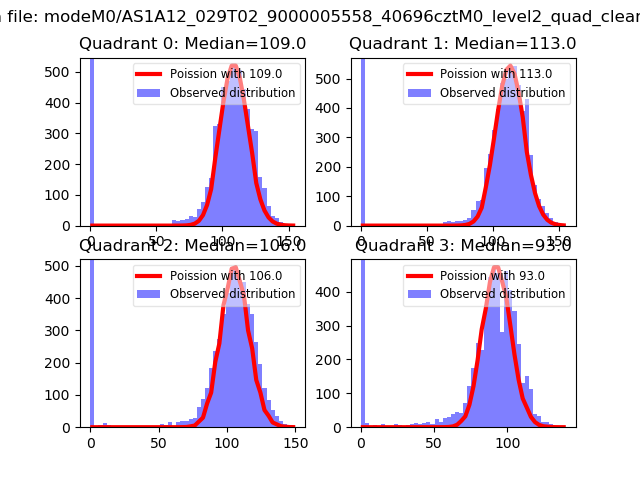 |
 |
| Quadrant-wise count rates Data is divided into 100 sec bins |
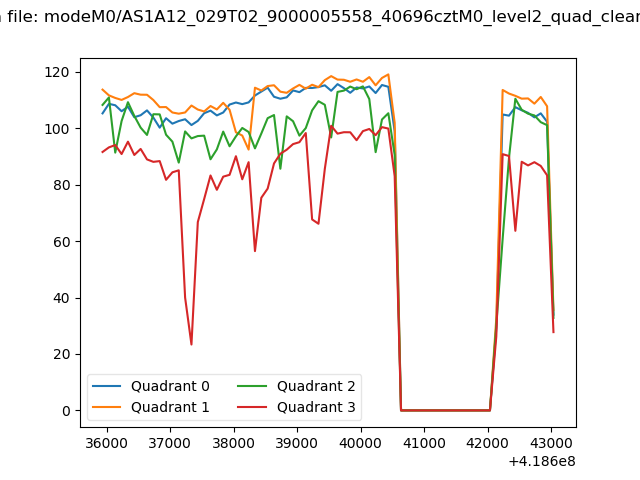 |
|
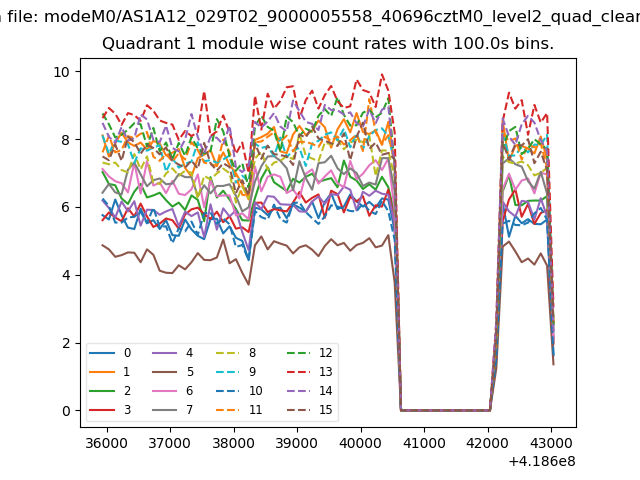
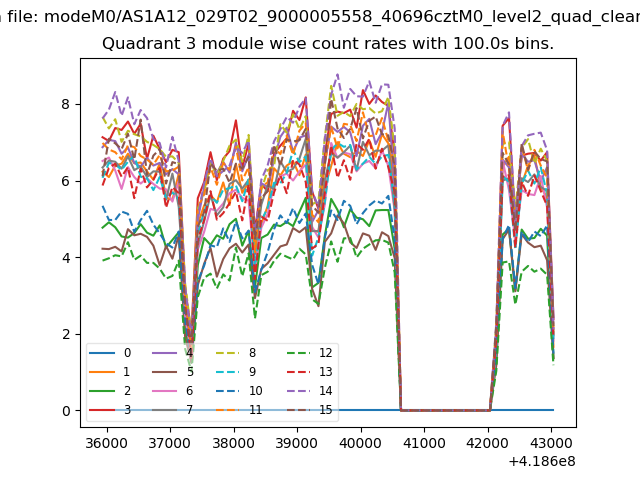
| Module-wise count rates for Quadrant A Data is divided into 100 sec bins |
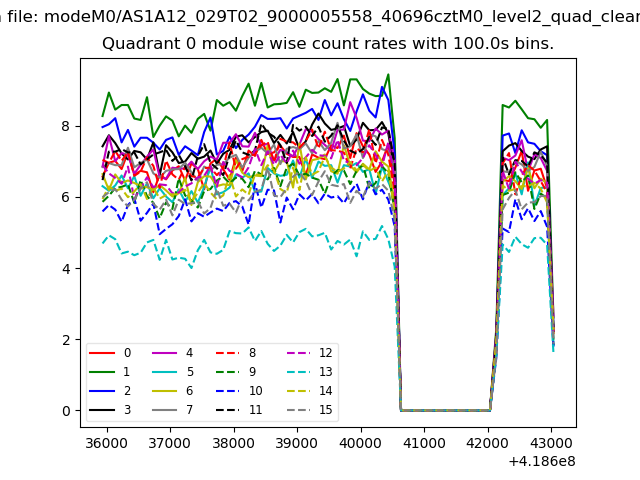 |
 |
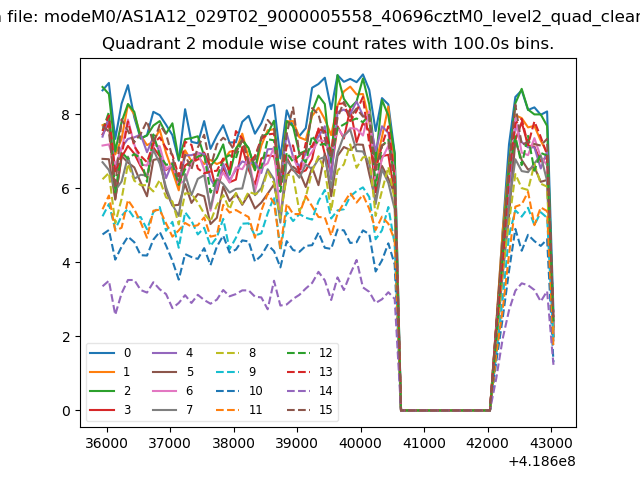
| Module-wise count rates for Quadrant B Data is divided into 100 sec bins |
 |
 |
| Module-wise count rates for Quadrant C Data is divided into 100 sec bins |
 |
 |
| Module-wise count rates for Quadrant D Data is divided into 100 sec bins |
 |
 |
| Parameter | Plot |
|---|---|
| CZT HV Monitor | 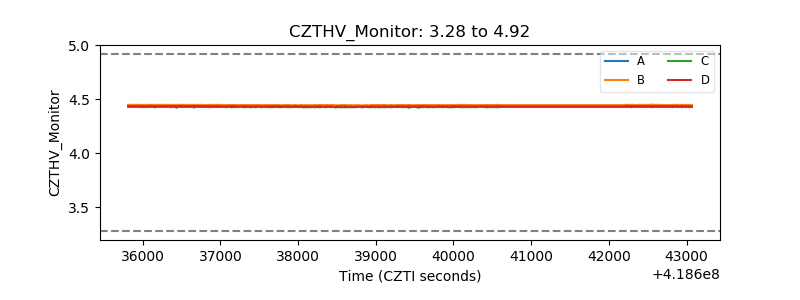 |
| D_VDD | 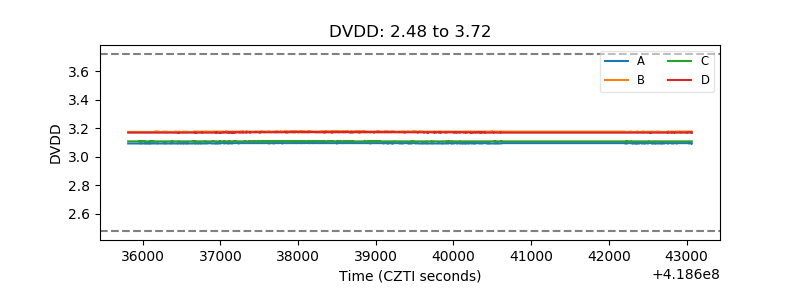 |
| Temperature 1 | 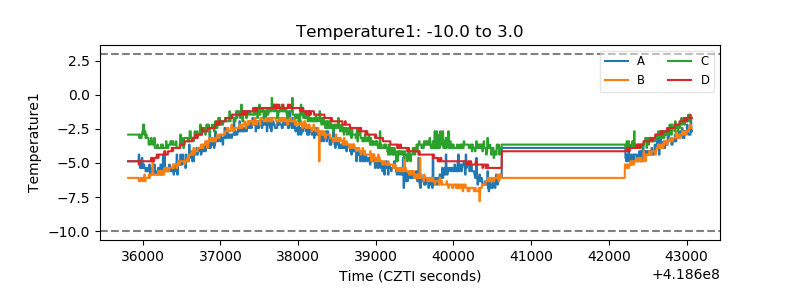 |
| Veto HV Monitor | 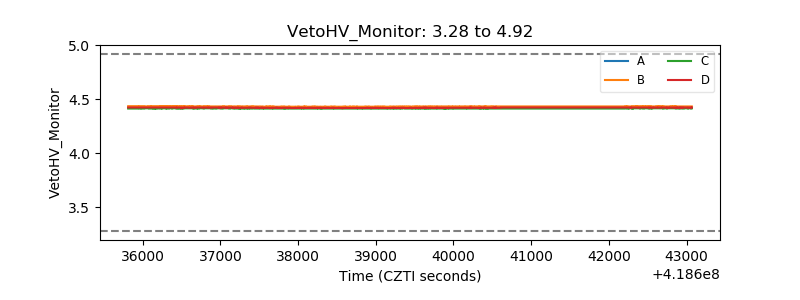 |
| Veto LLD | 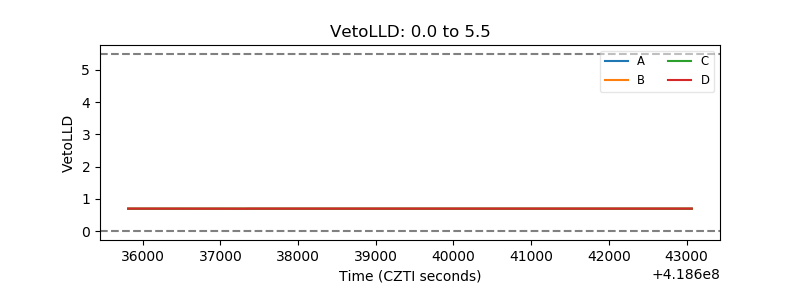 |
| Alpha Counter | 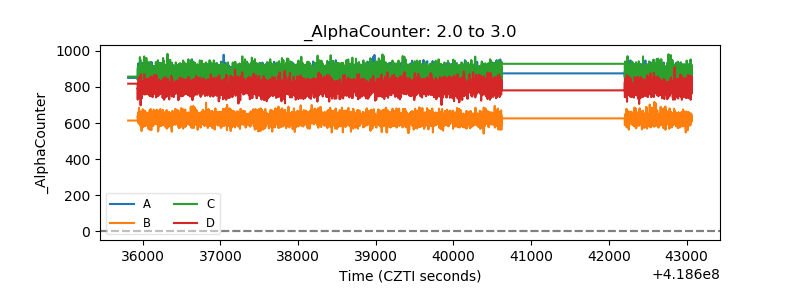 |
| _CPM_Rate | 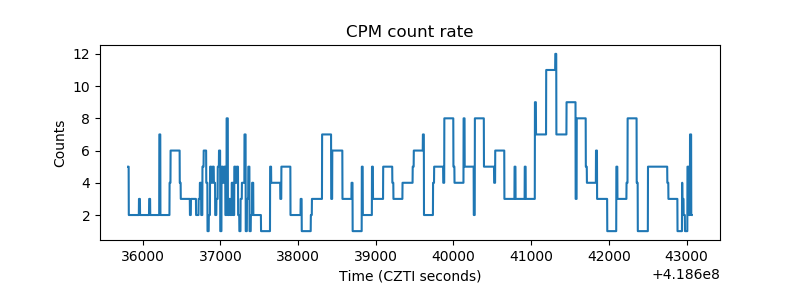 |
| CZT Counter | 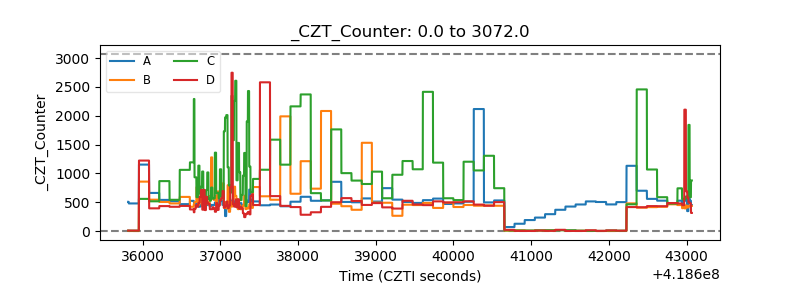 |
| +2.5 Volts monitor | 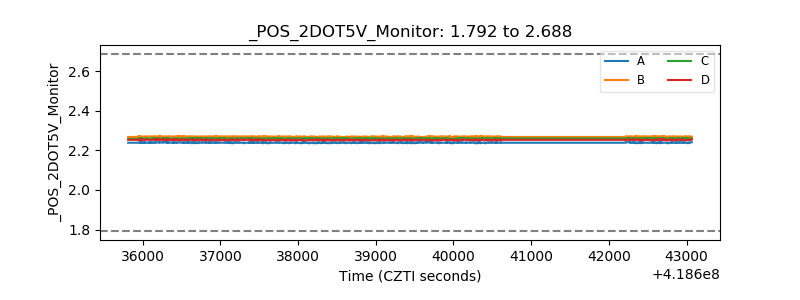 |
| +5 Volts monitor |  |
| _ROLL_ROT | 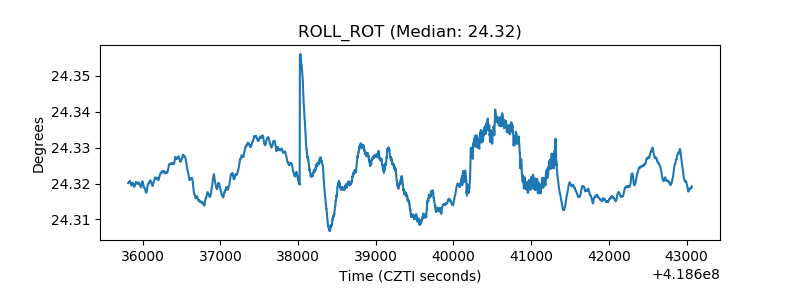 |
| _Roll_DEC | 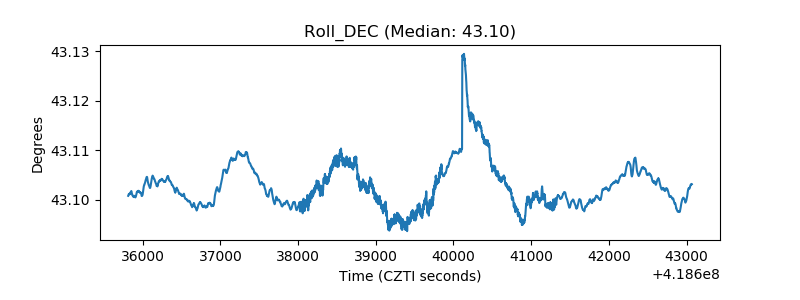 |
| _Roll_RA | 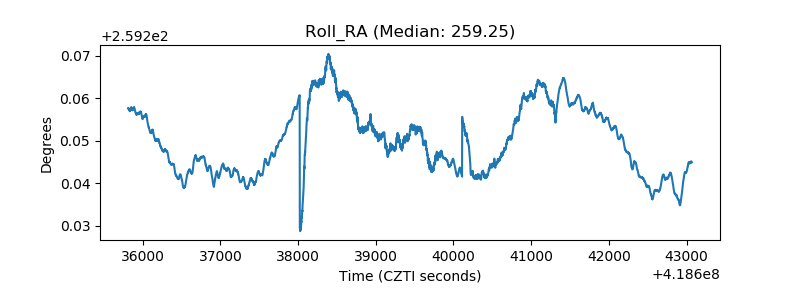 |
| Veto Counter | 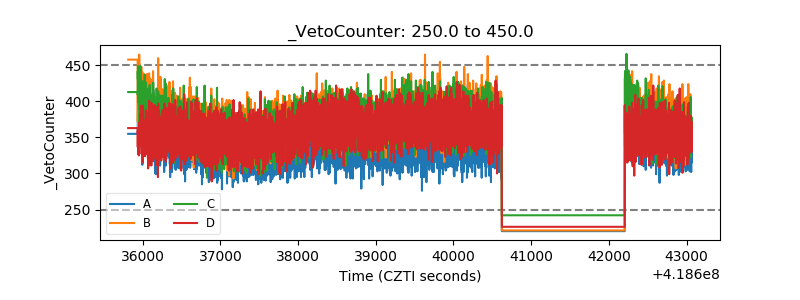 |