| Param | Original file | Final file |
|---|---|---|
| Filename | modeM0/AS1A12_029T02_9000005558_40698cztM0_level2.fits | modeM0/AS1A12_029T02_9000005558_40698cztM0_level2_quad_clean.evt |
| Size (bytes) | 403,842,240 | 94,334,400 |
| Size | 385.1 MB | 90.0 MB |
| Events in quadrant A | 3,346,461 | 638,272 |
| Events in quadrant B | 3,959,839 | 648,676 |
| Events in quadrant C | 3,800,508 | 620,260 |
| Events in quadrant D | 3,379,279 | 533,323 |
| Mode M0 | |||
|---|---|---|---|
| Quadrant | BADHDUFLAG | Total packets | Discarded packets |
| A | 0 | 13413 | 3 |
| B | 0 | 15702 | 2 |
| C | 0 | 14984 | 2 |
| D | 0 | 13871 | 2 |
| Mode M9 | |||
|---|---|---|---|
| Quadrant | BADHDUFLAG | Total packets | Discarded packets |
| A | 0 | 15 | 0 |
| B | 0 | 15 | 0 |
| C | 0 | 15 | 0 |
| D | 0 | 16 | 0 |
| Mode SS | |||
|---|---|---|---|
| Quadrant | BADHDUFLAG | Total packets | Discarded packets |
| A | 0 | 122 | 0 |
| B | 0 | 122 | 0 |
| C | 0 | 122 | 0 |
| D | 0 | 122 | 0 |
| Quadrant | Total seconds | Saturated seconds | Saturation percentage |
|---|---|---|---|
| A | 5946 | 89 | 1.496805% |
| B | 5946 | 196 | 3.296334% |
| C | 5946 | 124 | 2.085436% |
| D | 5946 | 555 | 9.334006% |
Noise dominated data is calculated using 1-second bins in cleaned event files. If a bin has >2000 counts, and if more than 50% of those come from <1% of pixels, then it is considered to be noise-dominated and hence unusable.
| Quadrant | # 1 sec bins | Bins with >0 counts | Bins with >2000 counts | High rate bins dominated by noise | Noise dominated (total time) | Noise dominated (detector-on time) | Marked lightcurve |
|---|---|---|---|---|---|---|---|
| A | 7257 | 5947 | 71 | 71 | 0.98% | 1.19% | 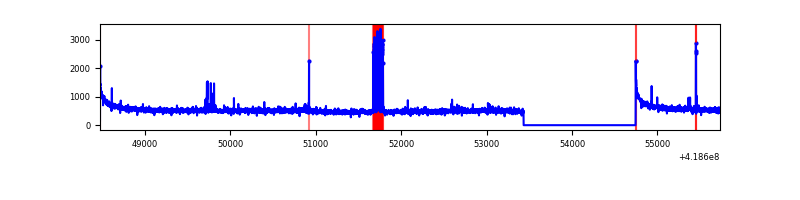 |
| B | 7257 | 5947 | 121 | 121 | 1.67% | 2.03% | 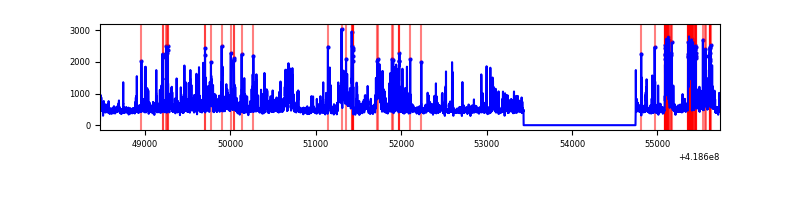 |
| C | 7257 | 5947 | 111 | 111 | 1.53% | 1.87% | 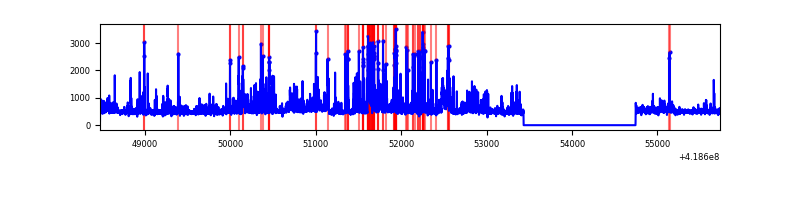 |
| D | 7257 | 5947 | 55 | 55 | 0.76% | 0.92% | 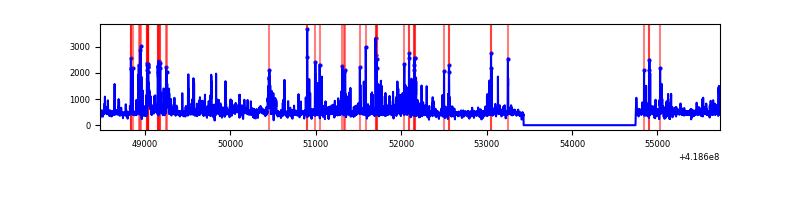 |
Top three noisy pixels from each quadrant. If the there are fewer than three noisy pixels in the level2.evt file, extra rows are filled as -1
| Pixel properties | Quadrant properties | ||||||
|---|---|---|---|---|---|---|---|
| Quadrant | DetID | PixID | Counts | Sigma | Mean | Median | Sigma |
| A | 10 | 83 | 543028 | 3983.62 | 660 | 646 | 136.2 |
| A | 6 | 10 | 201064 | 1472.0 | 660 | 646 | 136.2 |
| A | 12 | 189 | 24274 | 173.54 | 660 | 646 | 136.2 |
| B | 3 | 112 | 546711 | 4278.22 | 654 | 635 | 127.6 |
| B | 0 | 190 | 437623 | 3423.57 | 654 | 635 | 127.6 |
| B | 0 | 229 | 267096 | 2087.58 | 654 | 635 | 127.6 |
| C | 9 | 187 | 946832 | 6207.74 | 644 | 645 | 152.4 |
| C | 15 | 214 | 255389 | 1671.32 | 644 | 645 | 152.4 |
| C | 14 | 254 | 44727 | 289.21 | 644 | 645 | 152.4 |
| D | 2 | 250 | 198251 | 1273.37 | 617 | 598 | 155.2 |
| D | 12 | 191 | 178670 | 1147.22 | 617 | 598 | 155.2 |
| D | 2 | 249 | 123071 | 789.02 | 617 | 598 | 155.2 |
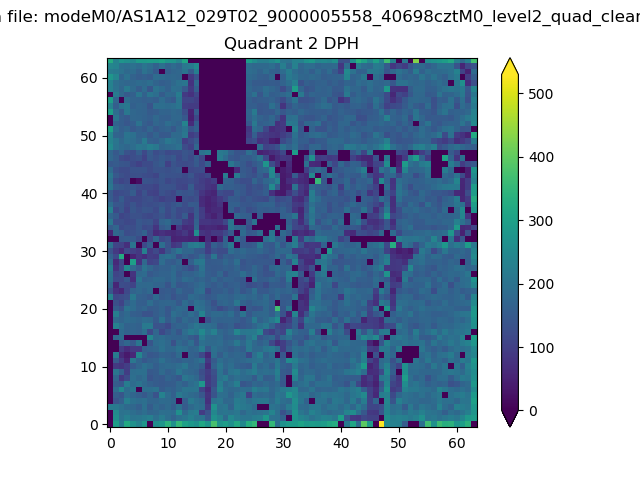
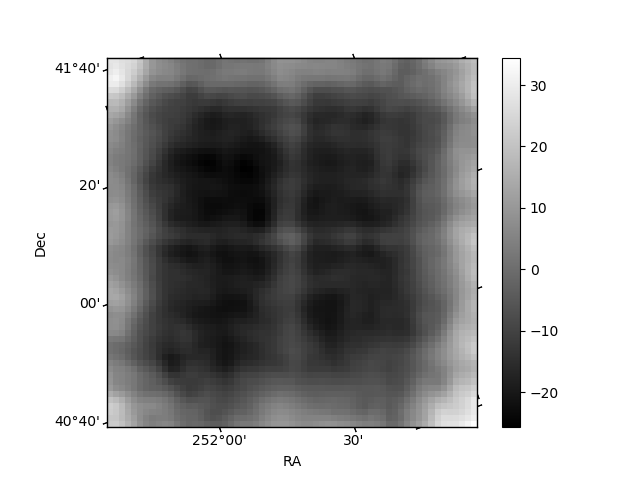
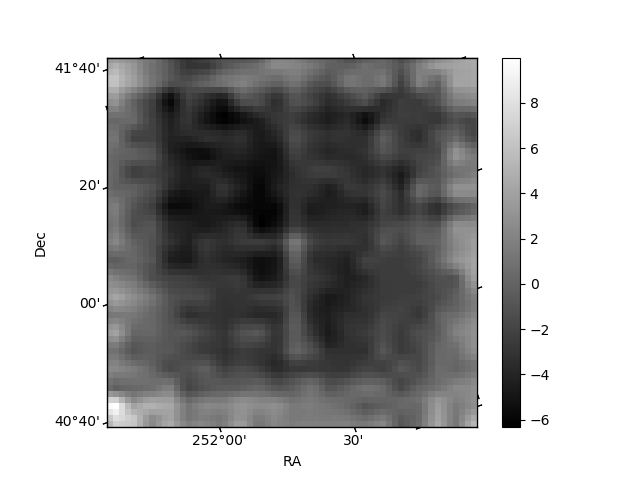
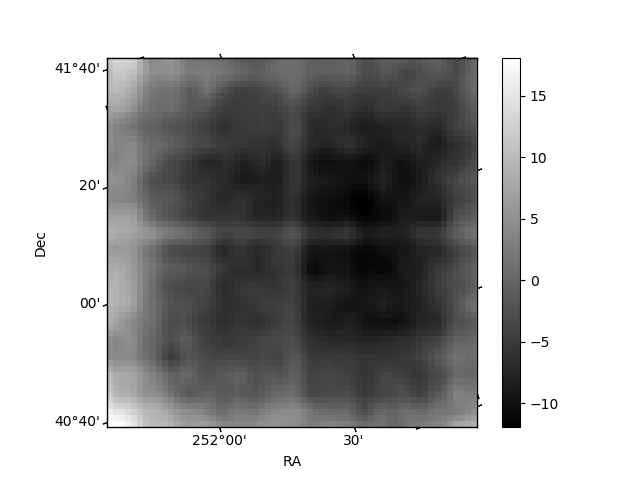
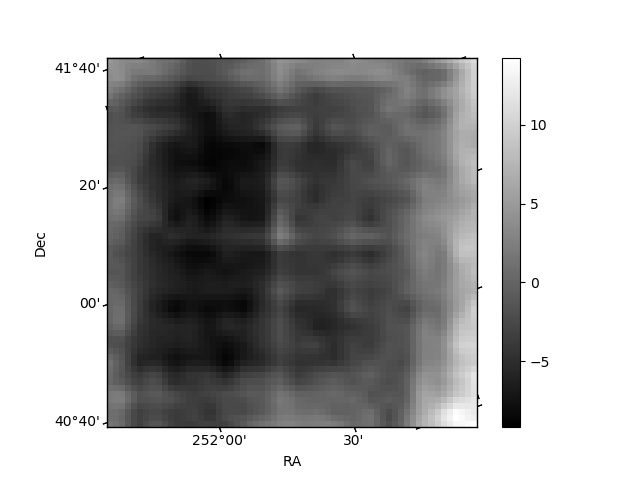
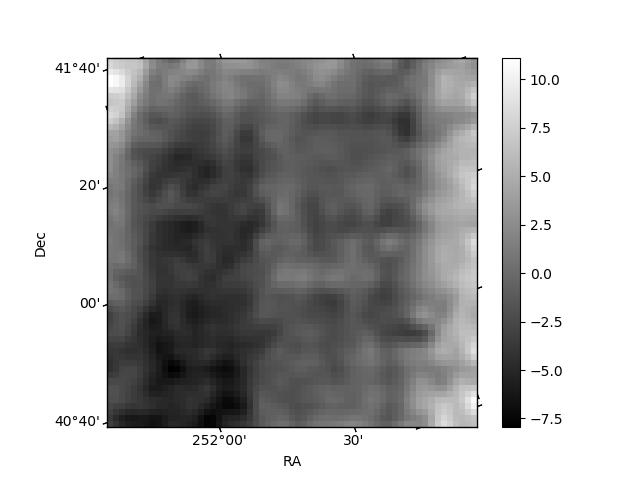
Histogram calculated using DETX and DETY for each event in the final _common_clean file
| Quadrant A | 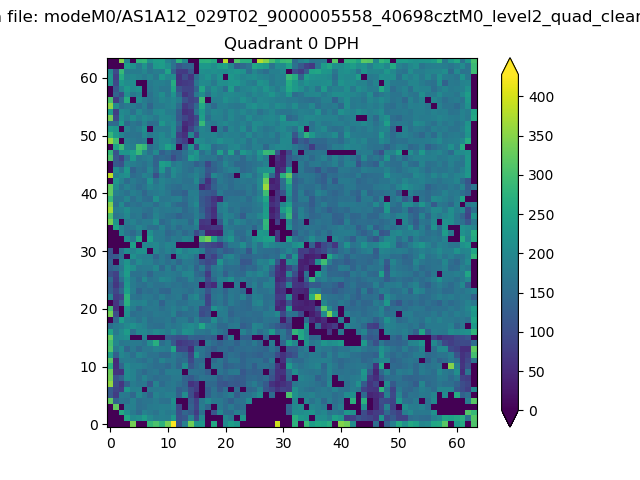 |
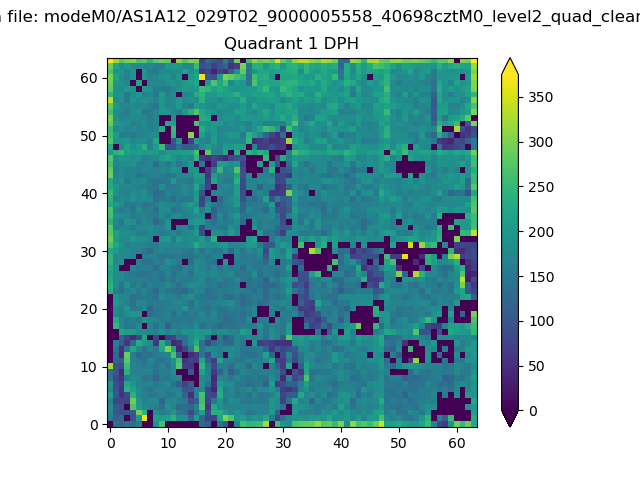 |
Quadrant B |
|---|---|---|---|
| Quadrant D | 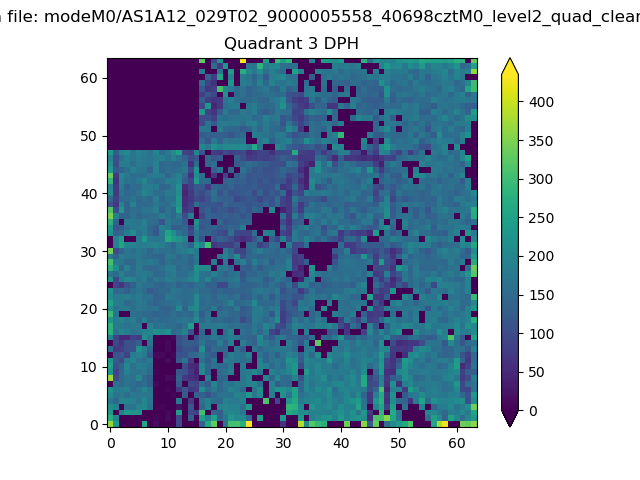 |
 |
Quadrant C |
| Plot type | Count rate plots | Images |
|---|---|---|
| Comparison with Poisson distribution Blue bars denote a histogram of data divided into 1 sec bins. Red curve is a Poisson curve with rate = median count rate of data. |
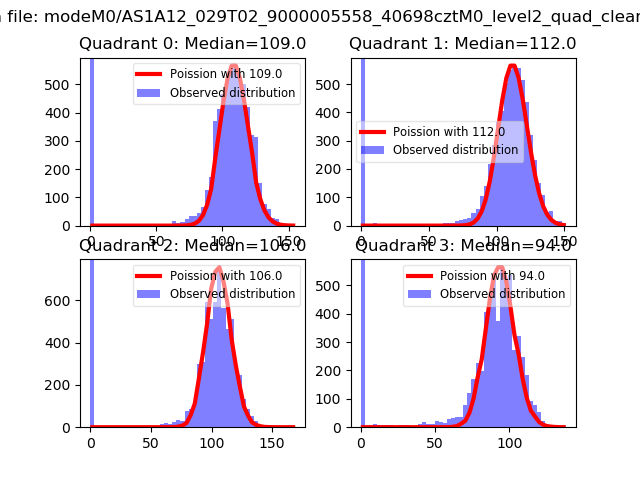 |
 |
| Quadrant-wise count rates Data is divided into 100 sec bins |
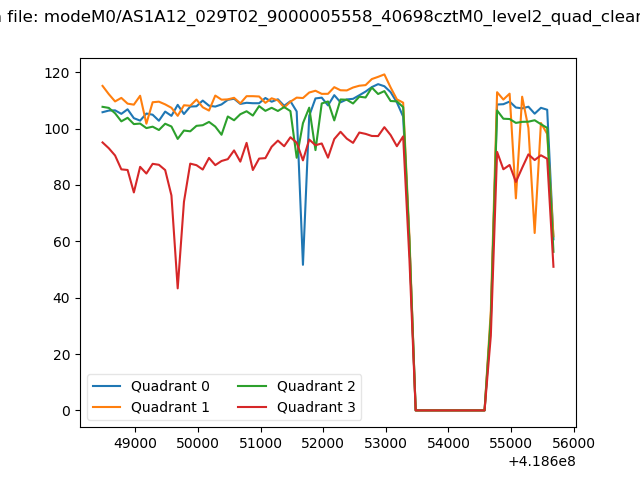 |
|
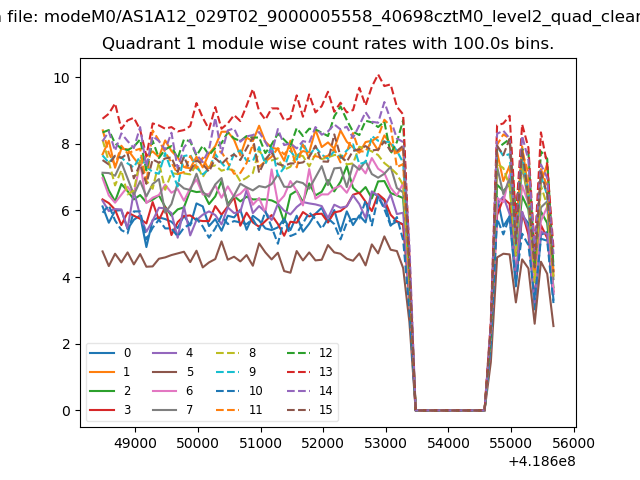
| Module-wise count rates for Quadrant A Data is divided into 100 sec bins |
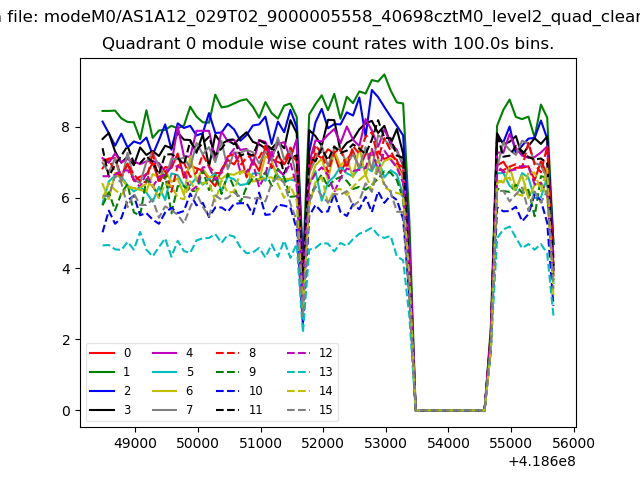 |
 |
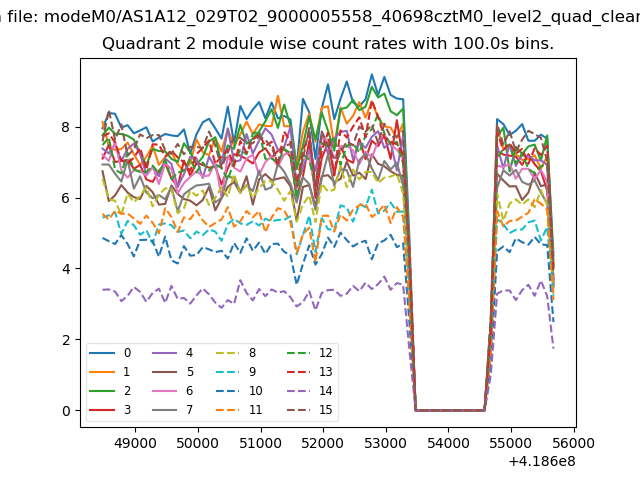
| Module-wise count rates for Quadrant B Data is divided into 100 sec bins |
 |
 |
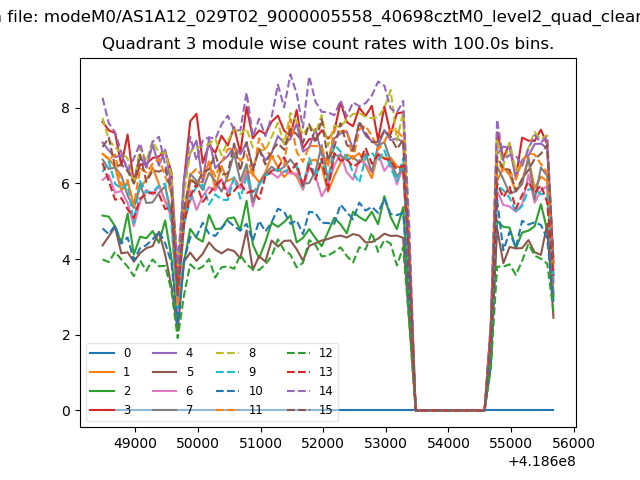
| Module-wise count rates for Quadrant C Data is divided into 100 sec bins |
 |
 |
| Module-wise count rates for Quadrant D Data is divided into 100 sec bins |
 |
 |
| Parameter | Plot |
|---|---|
| CZT HV Monitor | 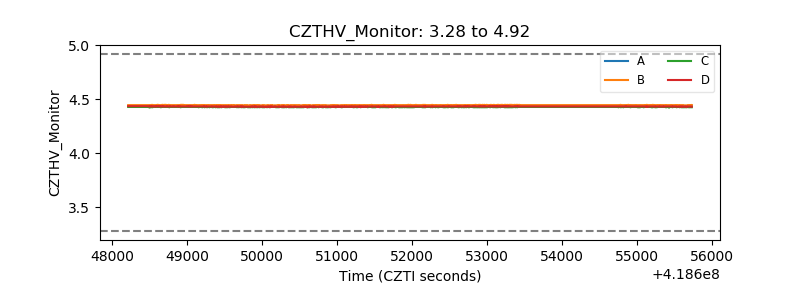 |
| D_VDD | 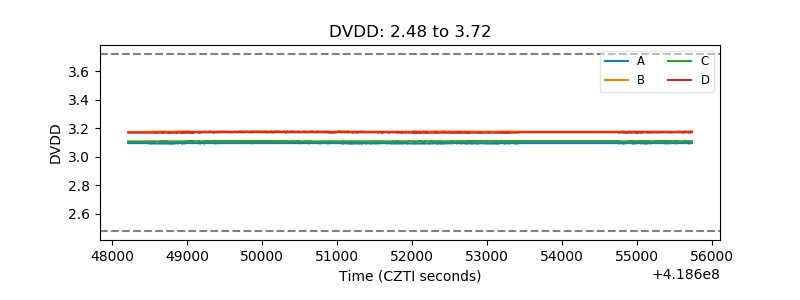 |
| Temperature 1 | 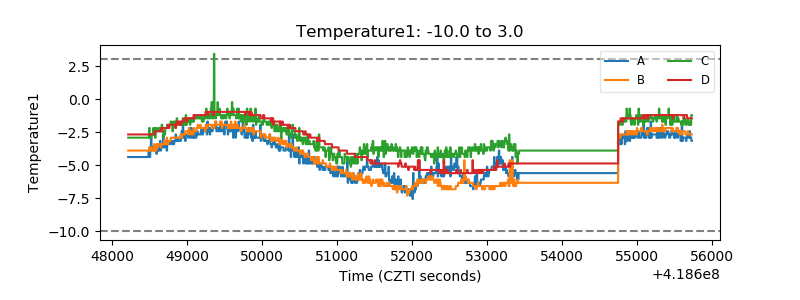 |
| Veto HV Monitor | 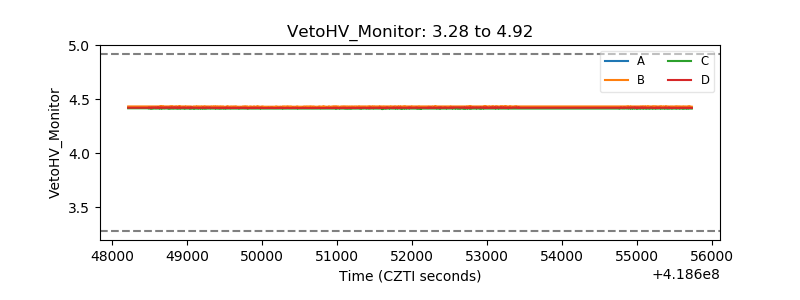 |
| Veto LLD | 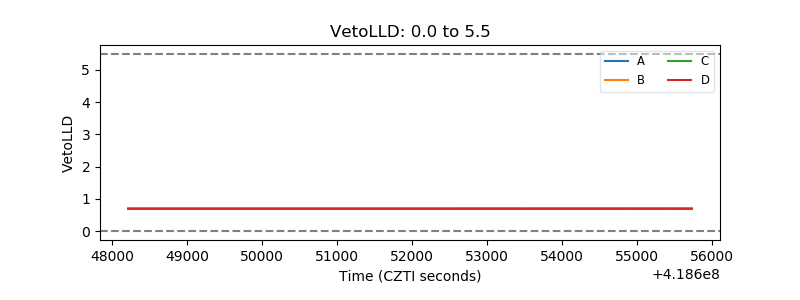 |
| Alpha Counter | 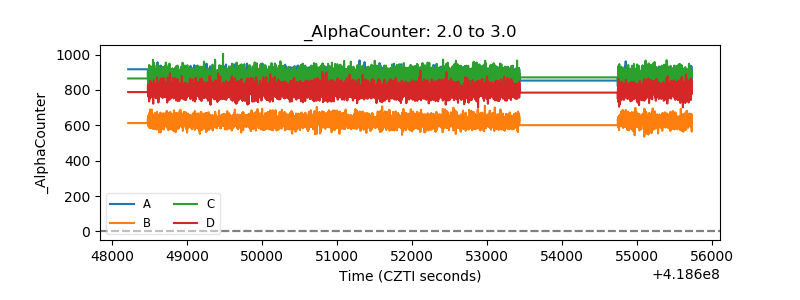 |
| _CPM_Rate | 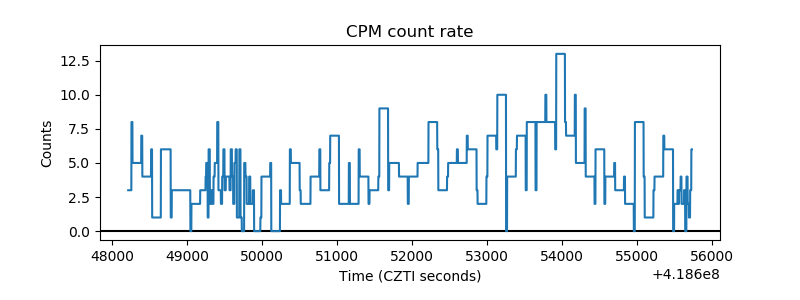 |
| CZT Counter | 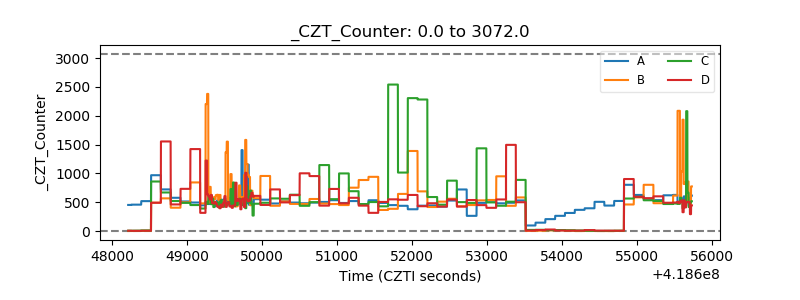 |
| +2.5 Volts monitor |  |
| +5 Volts monitor | 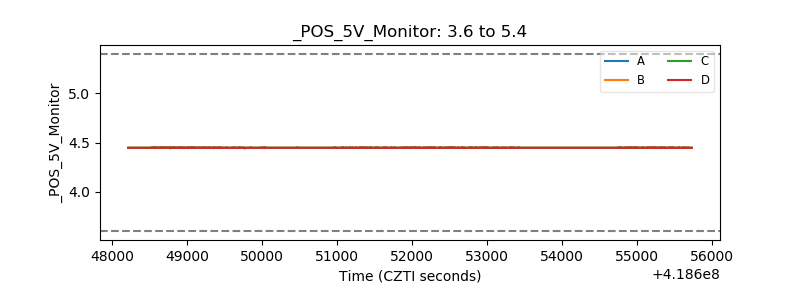 |
| _ROLL_ROT | 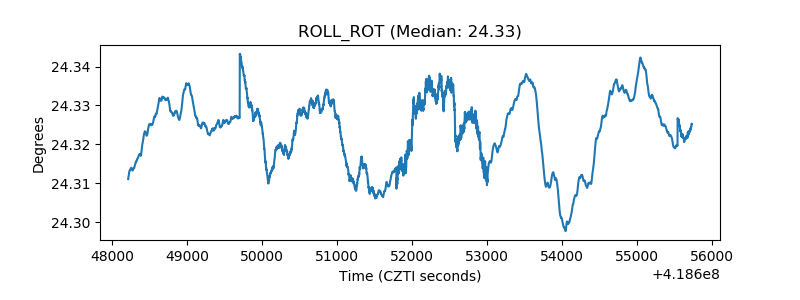 |
| _Roll_DEC | 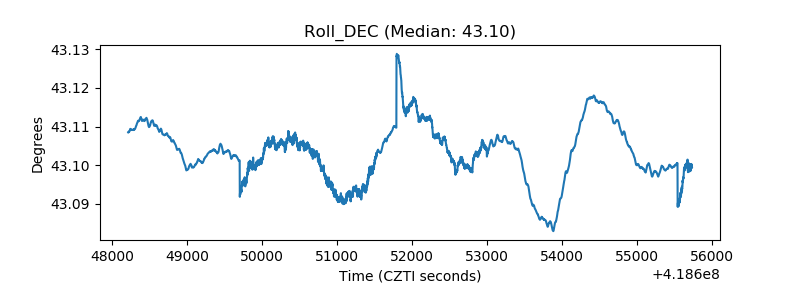 |
| _Roll_RA | 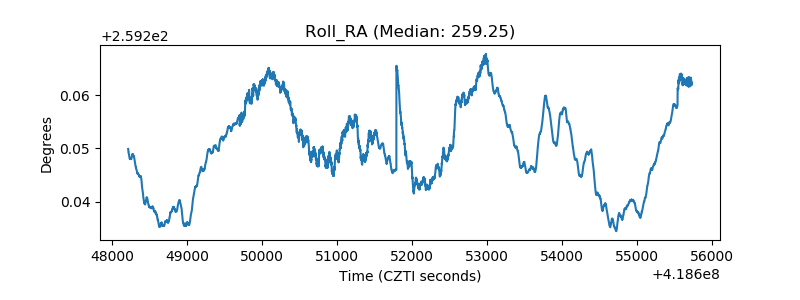 |
| Veto Counter | 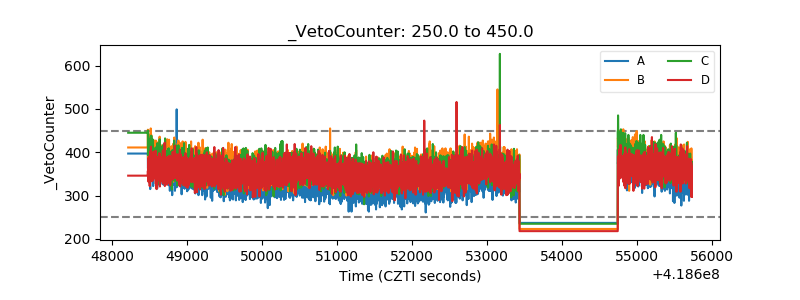 |