| Param | Original file | Final file |
|---|---|---|
| Filename | modeM0/AS1A12_029T02_9000005558_40700cztM0_level2.fits | modeM0/AS1A12_029T02_9000005558_40700cztM0_level2_quad_clean.evt |
| Size (bytes) | 472,939,200 | 101,093,760 |
| Size | 451.0 MB | 96.4 MB |
| Events in quadrant A | 3,670,904 | 697,091 |
| Events in quadrant B | 3,817,217 | 702,509 |
| Events in quadrant C | 5,390,417 | 650,573 |
| Events in quadrant D | 4,127,328 | 561,130 |
| Mode M0 | |||
|---|---|---|---|
| Quadrant | BADHDUFLAG | Total packets | Discarded packets |
| A | 0 | 14765 | 3 |
| B | 0 | 15565 | 2 |
| C | 0 | 20181 | 2 |
| D | 0 | 16487 | 2 |
| Mode M9 | |||
|---|---|---|---|
| Quadrant | BADHDUFLAG | Total packets | Discarded packets |
| A | 0 | 22 | 0 |
| B | 0 | 22 | 0 |
| C | 0 | 22 | 0 |
| D | 0 | 23 | 0 |
| Mode SS | |||
|---|---|---|---|
| Quadrant | BADHDUFLAG | Total packets | Discarded packets |
| A | 0 | 130 | 0 |
| B | 0 | 130 | 0 |
| C | 0 | 130 | 0 |
| D | 0 | 130 | 0 |
| Quadrant | Total seconds | Saturated seconds | Saturation percentage |
|---|---|---|---|
| A | 6443 | 25 | 0.388018% |
| B | 6443 | 178 | 2.762688% |
| C | 6443 | 446 | 6.922241% |
| D | 6443 | 761 | 11.811268% |
Noise dominated data is calculated using 1-second bins in cleaned event files. If a bin has >2000 counts, and if more than 50% of those come from <1% of pixels, then it is considered to be noise-dominated and hence unusable.
| Quadrant | # 1 sec bins | Bins with >0 counts | Bins with >2000 counts | High rate bins dominated by noise | Noise dominated (total time) | Noise dominated (detector-on time) | Marked lightcurve |
|---|---|---|---|---|---|---|---|
| A | 7785 | 6444 | 8 | 8 | 0.10% | 0.12% | 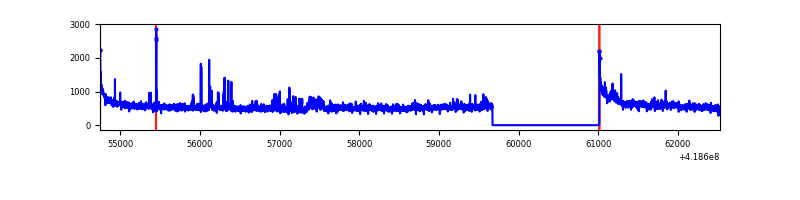 |
| B | 7785 | 6444 | 103 | 103 | 1.32% | 1.60% | 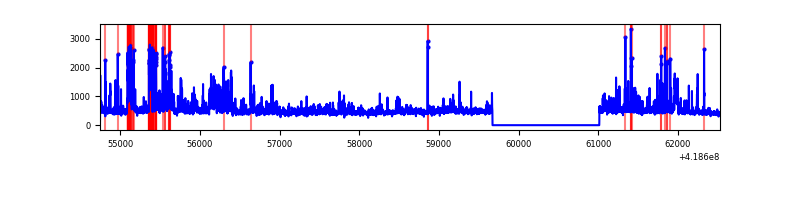 |
| C | 7785 | 6444 | 445 | 445 | 5.72% | 6.91% | 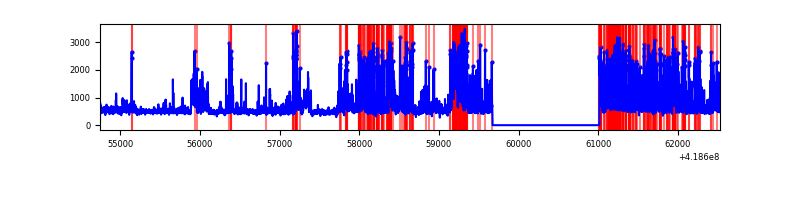 |
| D | 7785 | 6444 | 231 | 231 | 2.97% | 3.58% | 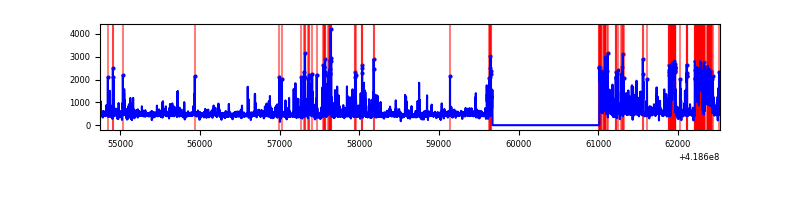 |
Top three noisy pixels from each quadrant. If the there are fewer than three noisy pixels in the level2.evt file, extra rows are filled as -1
| Pixel properties | Quadrant properties | ||||||
|---|---|---|---|---|---|---|---|
| Quadrant | DetID | PixID | Counts | Sigma | Mean | Median | Sigma |
| A | 10 | 83 | 582504 | 3907.36 | 722 | 708 | 148.9 |
| A | 6 | 10 | 237361 | 1589.37 | 722 | 708 | 148.9 |
| A | 13 | 248 | 25292 | 165.11 | 722 | 708 | 148.9 |
| B | 3 | 112 | 508218 | 3626.95 | 714 | 693 | 139.9 |
| B | 0 | 229 | 208111 | 1482.28 | 714 | 693 | 139.9 |
| B | 0 | 190 | 94335 | 669.2 | 714 | 693 | 139.9 |
| C | 9 | 187 | 2363561 | 14509.61 | 694 | 698 | 162.8 |
| C | 15 | 214 | 272746 | 1670.56 | 694 | 698 | 162.8 |
| C | 12 | 249 | 42449 | 256.38 | 694 | 698 | 162.8 |
| D | 1 | 47 | 432772 | 2596.71 | 665 | 647 | 166.4 |
| D | 2 | 250 | 398960 | 2393.52 | 665 | 647 | 166.4 |
| D | 12 | 227 | 309137 | 1853.76 | 665 | 647 | 166.4 |
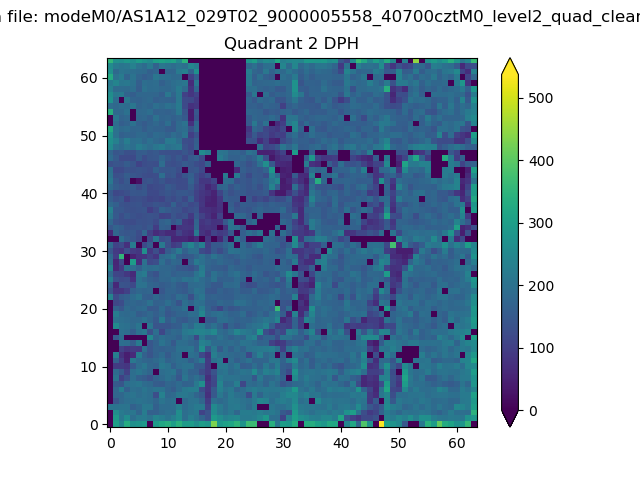
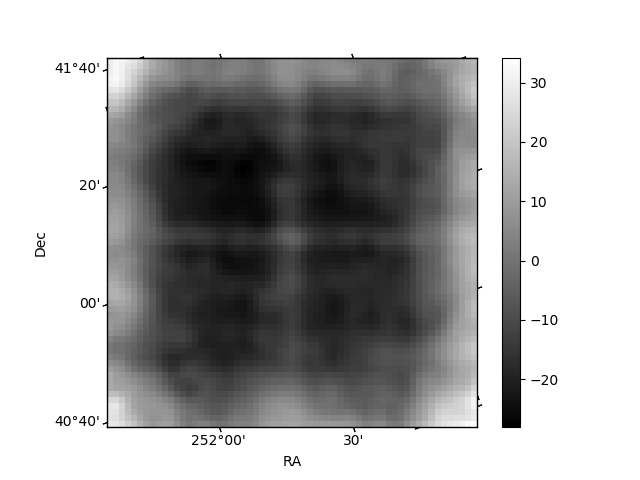
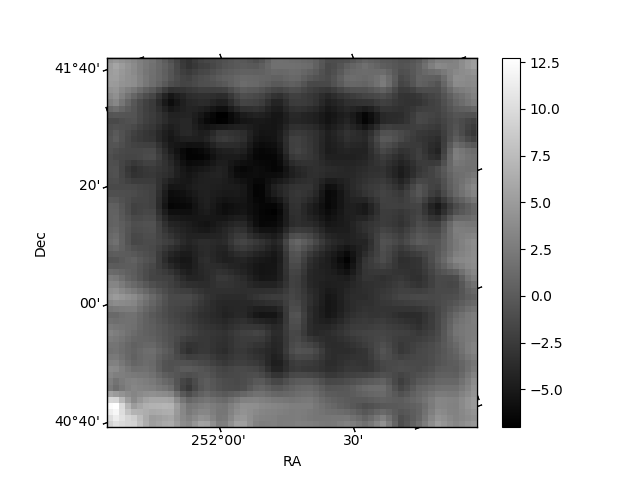
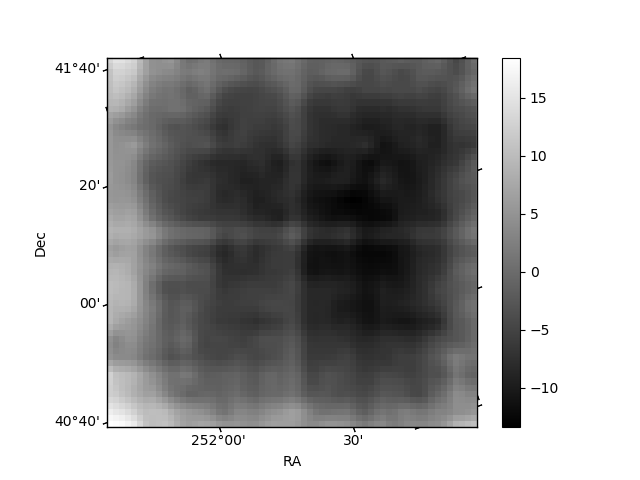
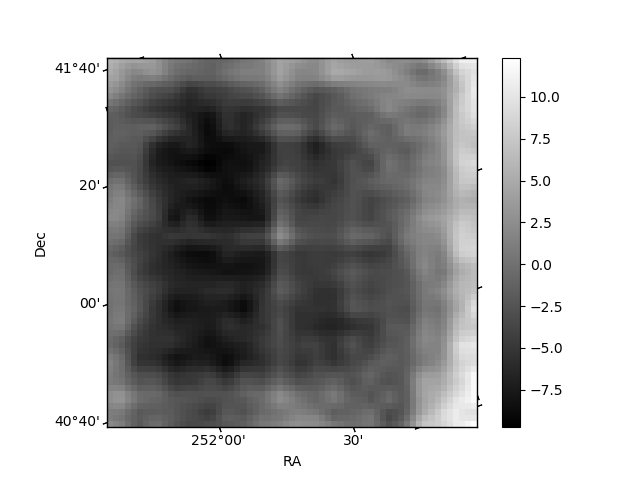
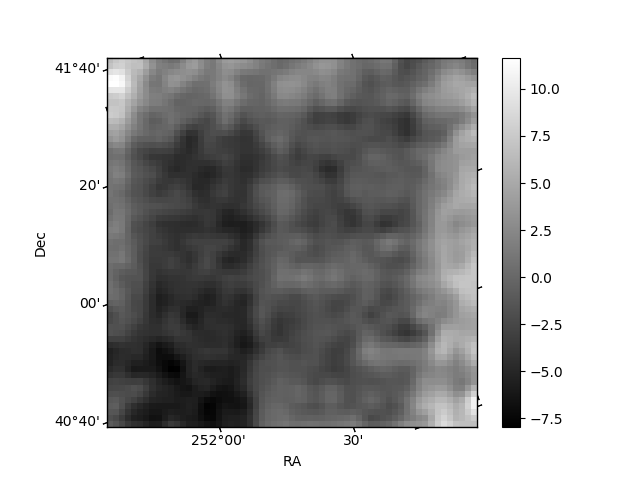
Histogram calculated using DETX and DETY for each event in the final _common_clean file
| Quadrant A | 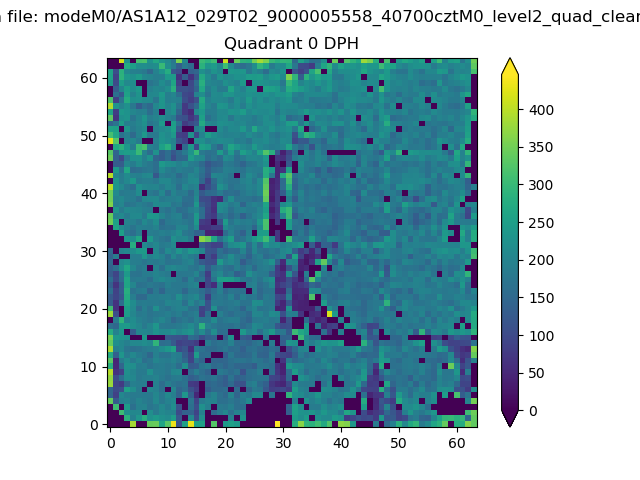 |
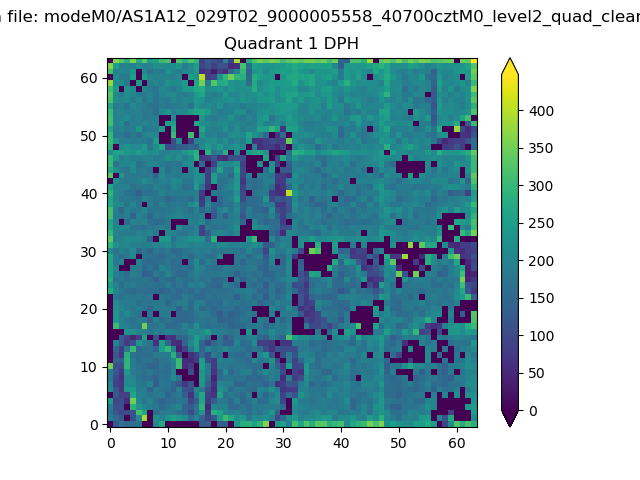 |
Quadrant B |
|---|---|---|---|
| Quadrant D | 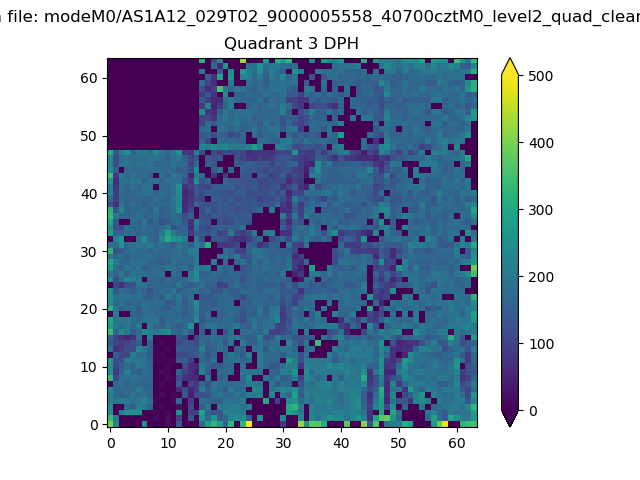 |
 |
Quadrant C |
| Plot type | Count rate plots | Images |
|---|---|---|
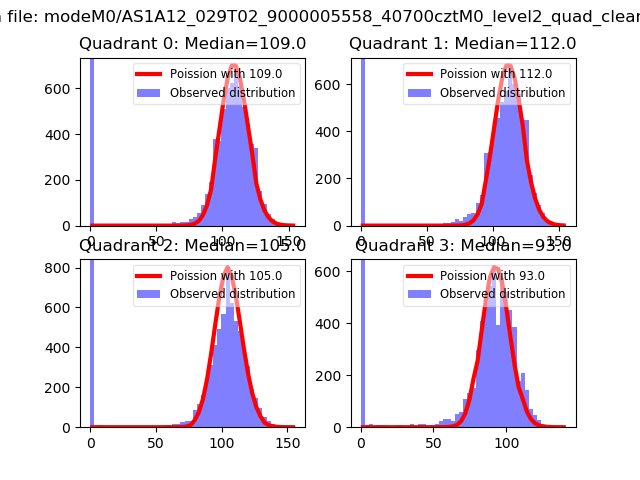
| Comparison with Poisson distribution Blue bars denote a histogram of data divided into 1 sec bins. Red curve is a Poisson curve with rate = median count rate of data. |
 |
 |
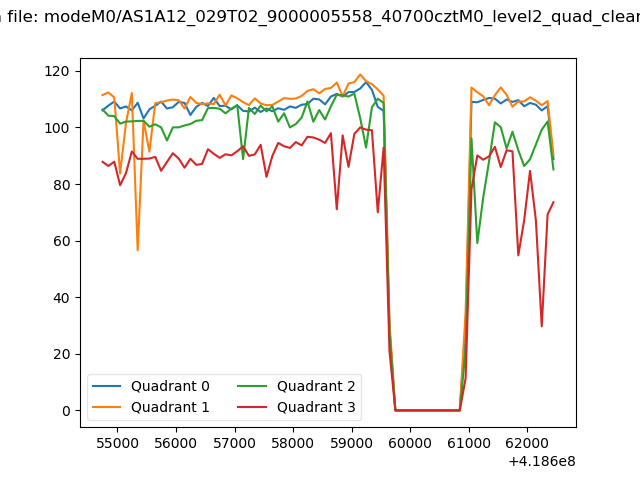
| Quadrant-wise count rates Data is divided into 100 sec bins |
 |
|
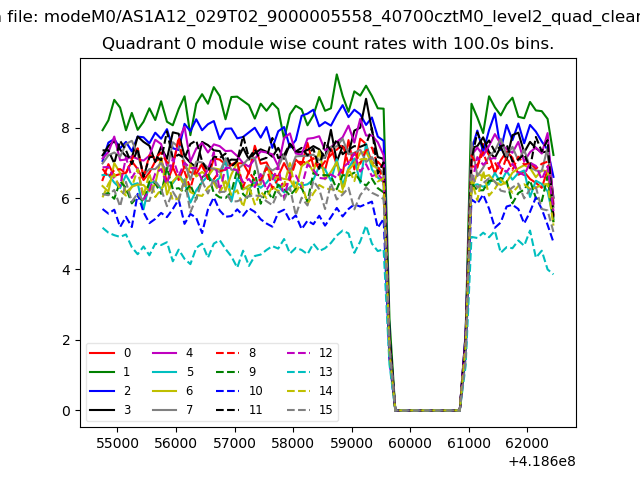
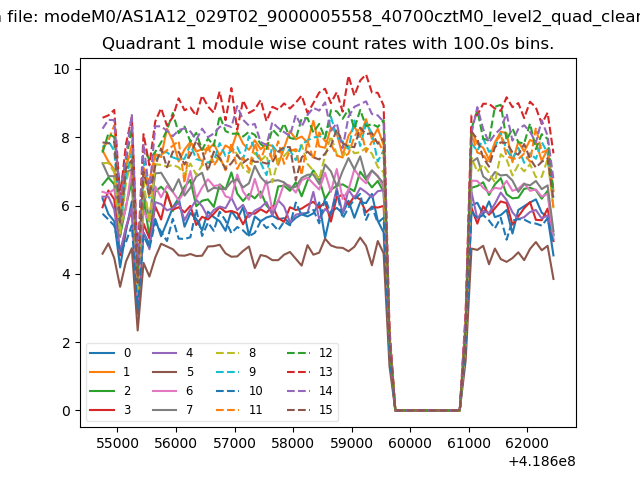
| Module-wise count rates for Quadrant A Data is divided into 100 sec bins |
 |
 |
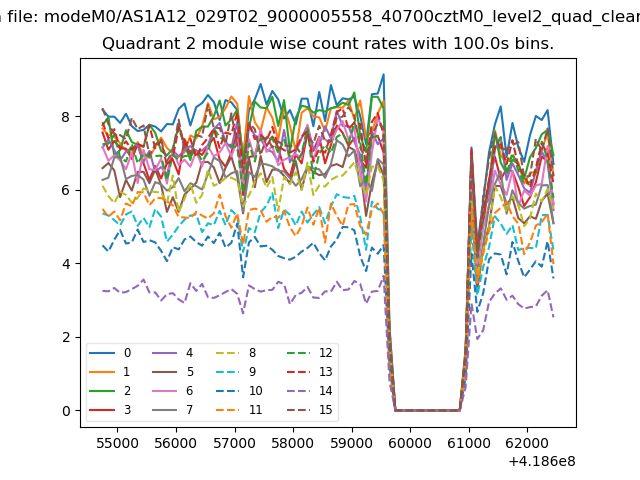
| Module-wise count rates for Quadrant B Data is divided into 100 sec bins |
 |
 |
| Module-wise count rates for Quadrant C Data is divided into 100 sec bins |
 |
 |
| Module-wise count rates for Quadrant D Data is divided into 100 sec bins |
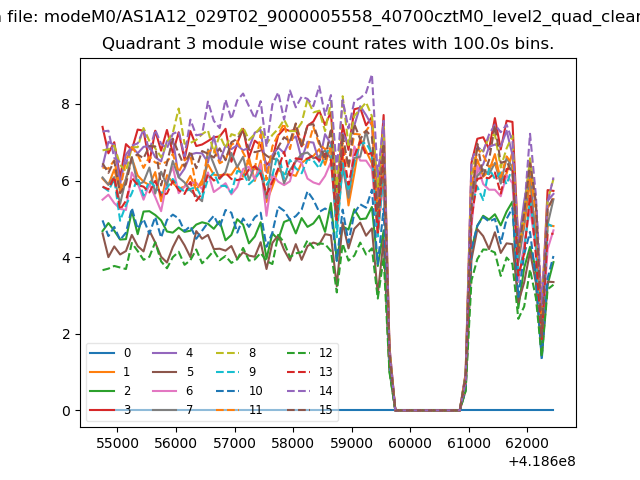 |
 |
| Parameter | Plot |
|---|---|
| CZT HV Monitor |  |
| D_VDD | 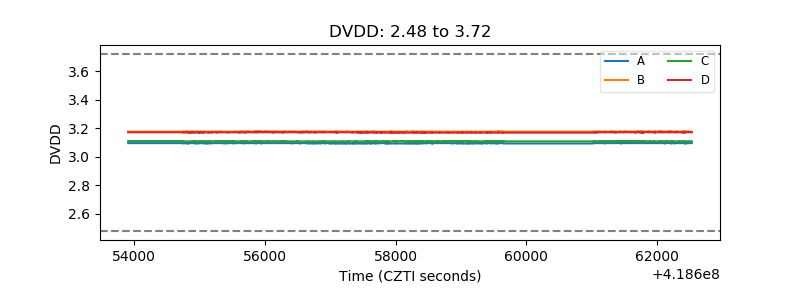 |
| Temperature 1 | 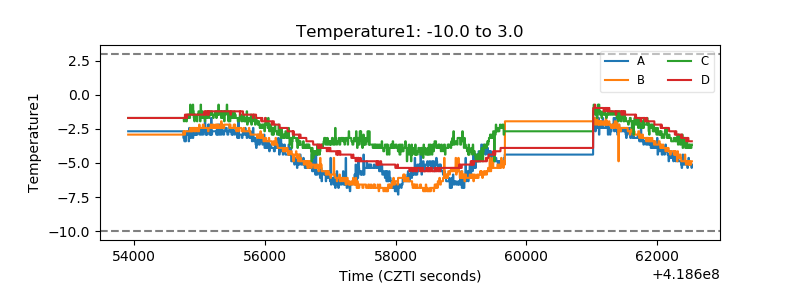 |
| Veto HV Monitor | 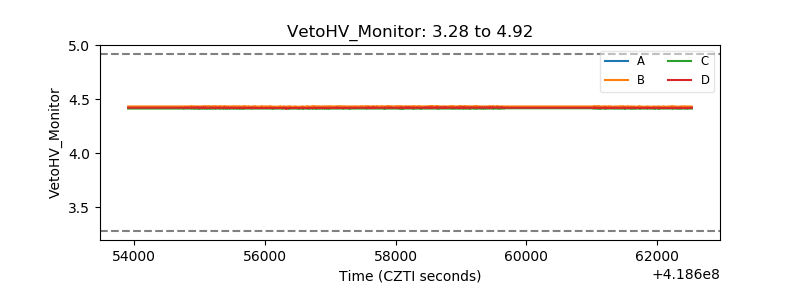 |
| Veto LLD | 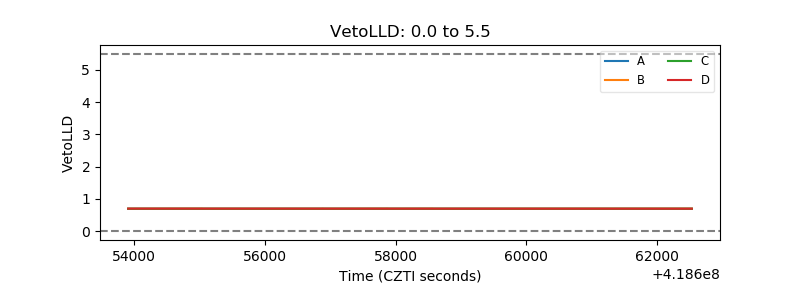 |
| Alpha Counter | 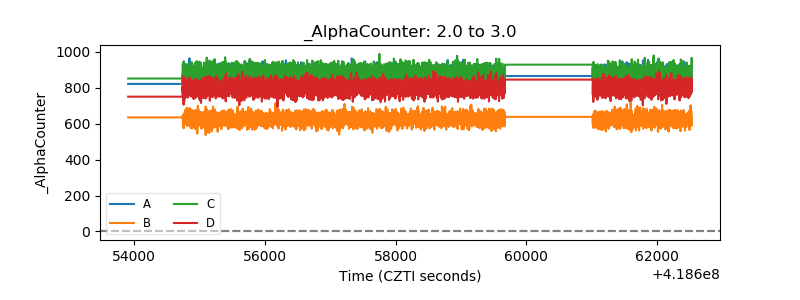 |
| _CPM_Rate | 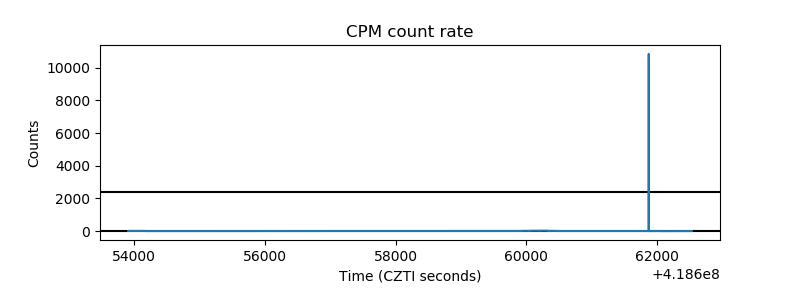 |
| CZT Counter | 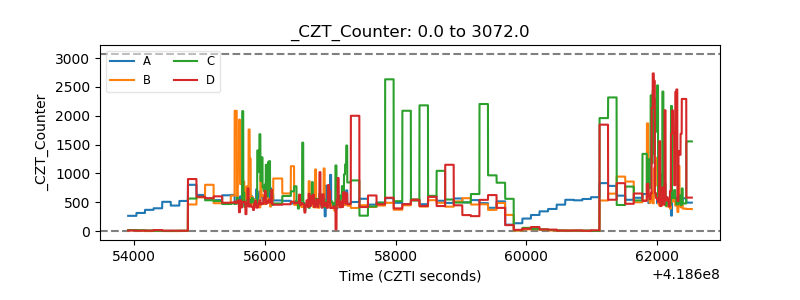 |
| +2.5 Volts monitor |  |
| +5 Volts monitor | 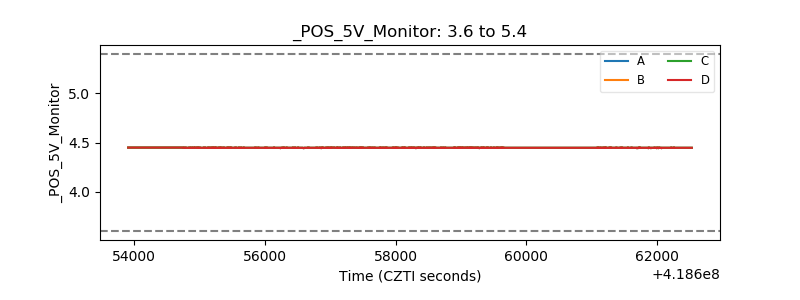 |
| _ROLL_ROT | 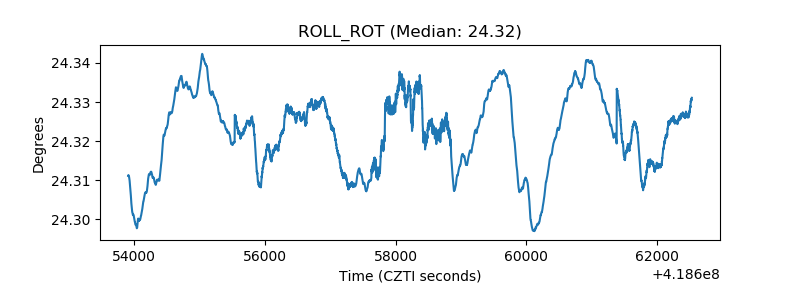 |
| _Roll_DEC | 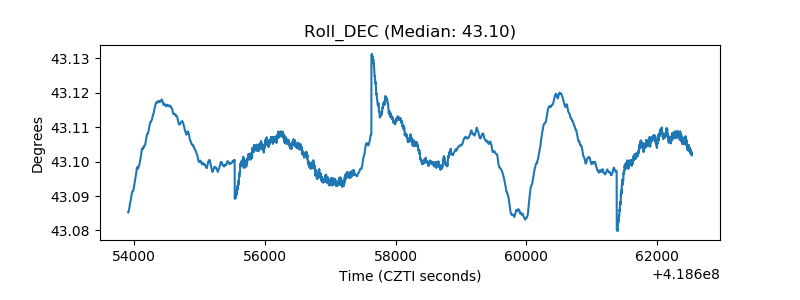 |
| _Roll_RA | 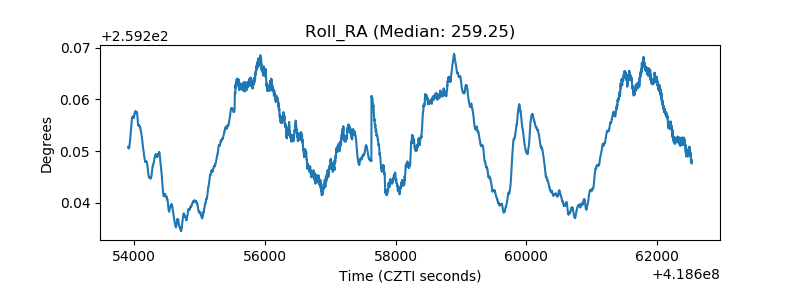 |
| Veto Counter | 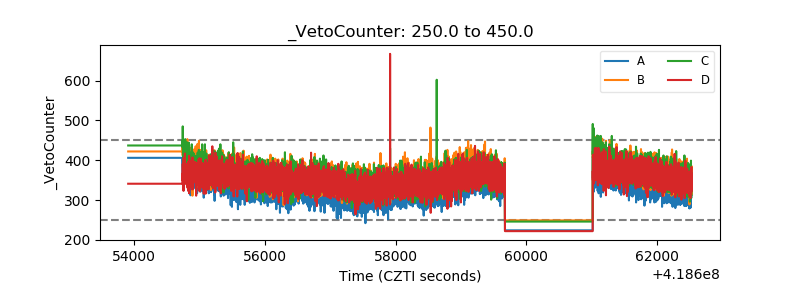 |