| Param | Original file | Final file |
|---|---|---|
| Filename | modeM0/AS1A12_029T02_9000005558_40701cztM0_level2.fits | modeM0/AS1A12_029T02_9000005558_40701cztM0_level2_quad_clean.evt |
| Size (bytes) | 702,901,440 | 149,944,320 |
| Size | 670.3 MB | 143.0 MB |
| Events in quadrant A | 5,026,308 | 1,034,331 |
| Events in quadrant B | 4,777,079 | 1,061,773 |
| Events in quadrant C | 9,092,516 | 940,399 |
| Events in quadrant D | 6,386,203 | 844,002 |
| Mode M0 | |||
|---|---|---|---|
| Quadrant | BADHDUFLAG | Total packets | Discarded packets |
| A | 0 | 20612 | 3 |
| B | 0 | 20650 | 2 |
| C | 0 | 33472 | 2 |
| D | 0 | 25511 | 2 |
| Mode M9 | |||
|---|---|---|---|
| Quadrant | BADHDUFLAG | Total packets | Discarded packets |
| A | 0 | 30 | 0 |
| B | 0 | 30 | 0 |
| C | 0 | 30 | 0 |
| D | 0 | 30 | 0 |
| Mode SS | |||
|---|---|---|---|
| Quadrant | BADHDUFLAG | Total packets | Discarded packets |
| A | 0 | 194 | 0 |
| B | 0 | 194 | 0 |
| C | 0 | 194 | 0 |
| D | 0 | 194 | 0 |
| Quadrant | Total seconds | Saturated seconds | Saturation percentage |
|---|---|---|---|
| A | 9505 | 39 | 0.410310% |
| B | 9505 | 65 | 0.683851% |
| C | 9505 | 964 | 10.142031% |
| D | 9505 | 1139 | 11.983167% |
Noise dominated data is calculated using 1-second bins in cleaned event files. If a bin has >2000 counts, and if more than 50% of those come from <1% of pixels, then it is considered to be noise-dominated and hence unusable.
| Quadrant | # 1 sec bins | Bins with >0 counts | Bins with >2000 counts | High rate bins dominated by noise | Noise dominated (total time) | Noise dominated (detector-on time) | Marked lightcurve |
|---|---|---|---|---|---|---|---|
| A | 12491 | 9507 | 25 | 25 | 0.20% | 0.26% | 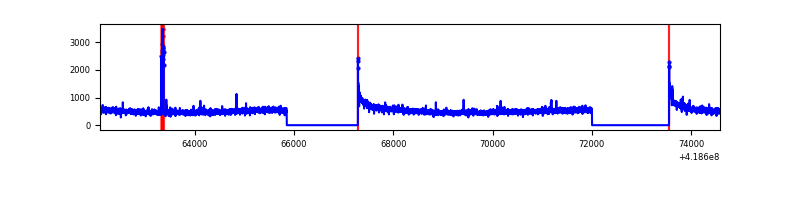 |
| B | 12491 | 9507 | 30 | 30 | 0.24% | 0.32% | 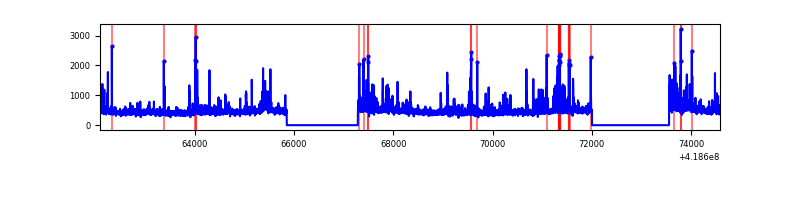 |
| C | 12491 | 9507 | 913 | 913 | 7.31% | 9.60% |  |
| D | 12491 | 9507 | 401 | 401 | 3.21% | 4.22% | 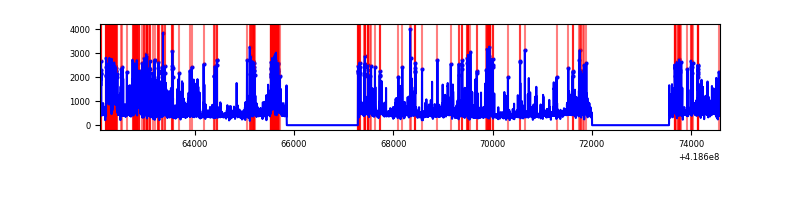 |
Top three noisy pixels from each quadrant. If the there are fewer than three noisy pixels in the level2.evt file, extra rows are filled as -1
| Pixel properties | Quadrant properties | ||||||
|---|---|---|---|---|---|---|---|
| Quadrant | DetID | PixID | Counts | Sigma | Mean | Median | Sigma |
| A | 10 | 83 | 735665 | 3414.34 | 1042 | 1020 | 215.2 |
| A | 6 | 10 | 239205 | 1106.99 | 1042 | 1020 | 215.2 |
| A | 13 | 254 | 12729 | 54.42 | 1042 | 1020 | 215.2 |
| B | 0 | 229 | 305687 | 1507.22 | 1043 | 1012 | 202.1 |
| B | 5 | 255 | 124359 | 610.2 | 1043 | 1012 | 202.1 |
| B | 3 | 112 | 113008 | 554.04 | 1043 | 1012 | 202.1 |
| C | 9 | 187 | 4668535 | 20015.65 | 992 | 996 | 233.2 |
| C | 15 | 214 | 391052 | 1672.66 | 992 | 996 | 233.2 |
| C | 14 | 254 | 110756 | 470.68 | 992 | 996 | 233.2 |
| D | 12 | 227 | 976786 | 4070.92 | 968 | 941 | 239.7 |
| D | 1 | 47 | 625944 | 2607.32 | 968 | 941 | 239.7 |
| D | 2 | 250 | 366787 | 1526.2 | 968 | 941 | 239.7 |
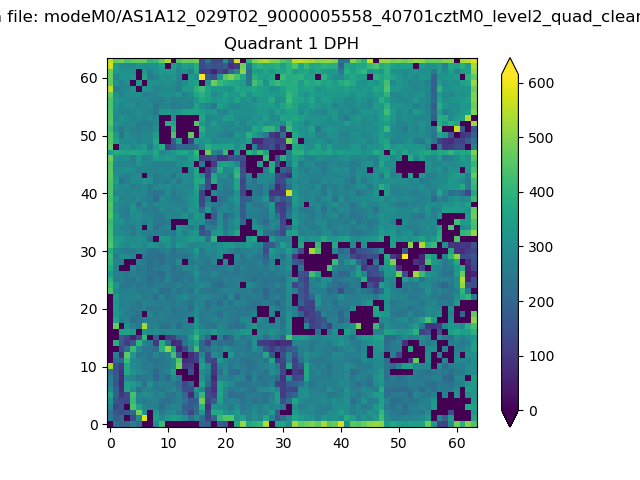
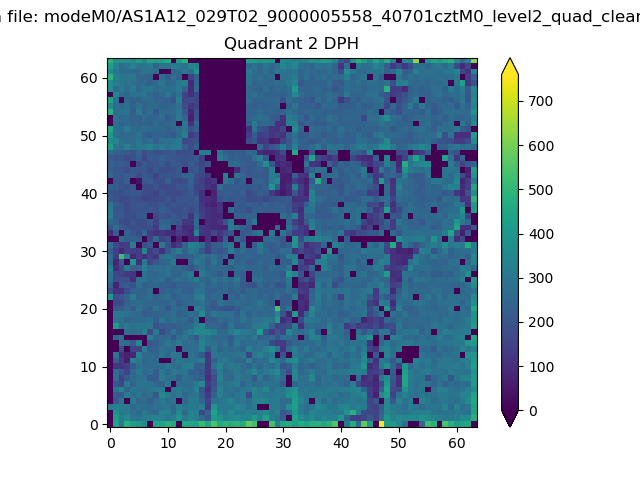
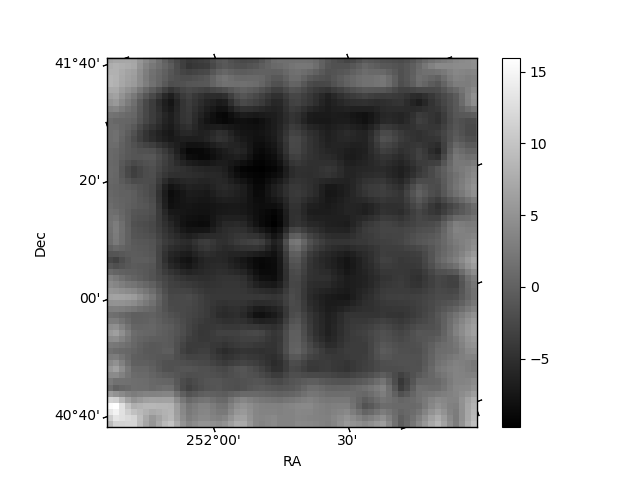
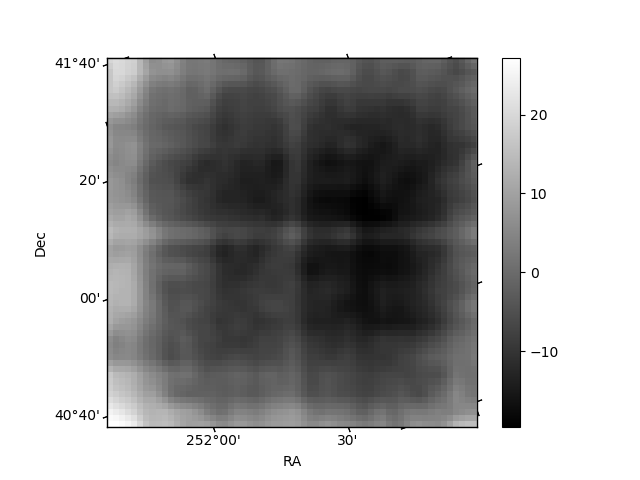
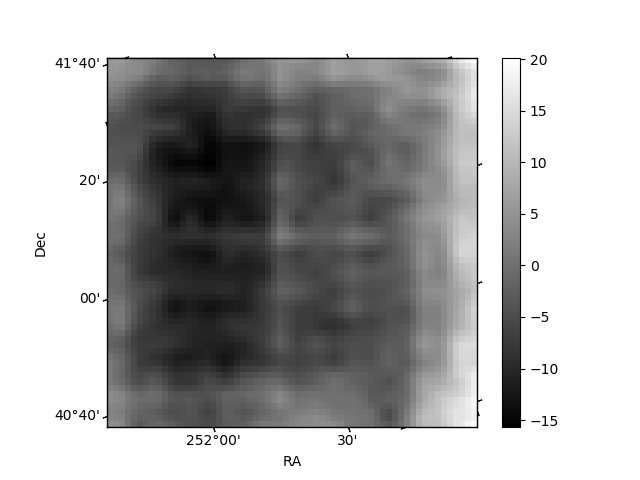
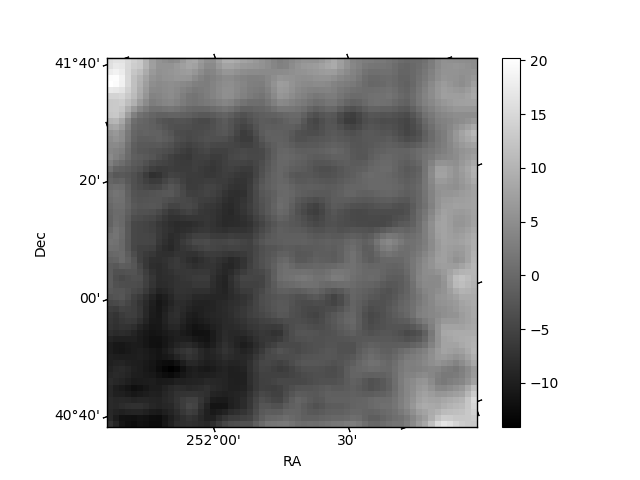
Histogram calculated using DETX and DETY for each event in the final _common_clean file
| Quadrant A | 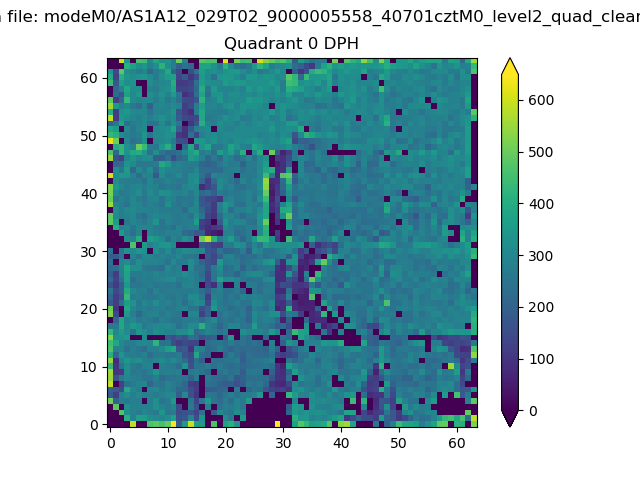 |
 |
Quadrant B |
|---|---|---|---|
| Quadrant D | 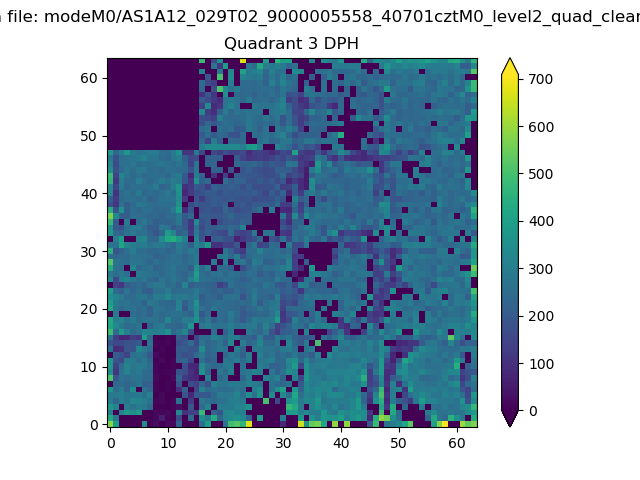 |
 |
Quadrant C |
| Plot type | Count rate plots | Images |
|---|---|---|
| Comparison with Poisson distribution Blue bars denote a histogram of data divided into 1 sec bins. Red curve is a Poisson curve with rate = median count rate of data. |
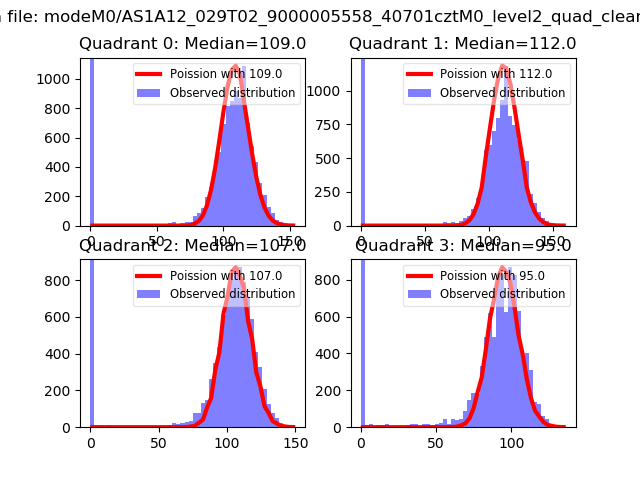 |
 |
| Quadrant-wise count rates Data is divided into 100 sec bins |
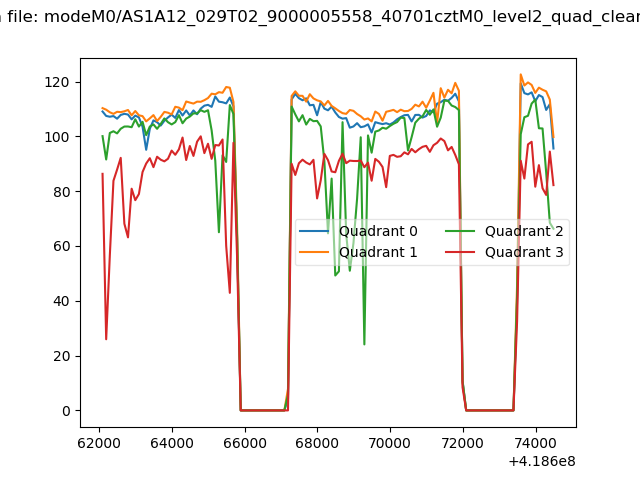 |
|
| Module-wise count rates for Quadrant A Data is divided into 100 sec bins |
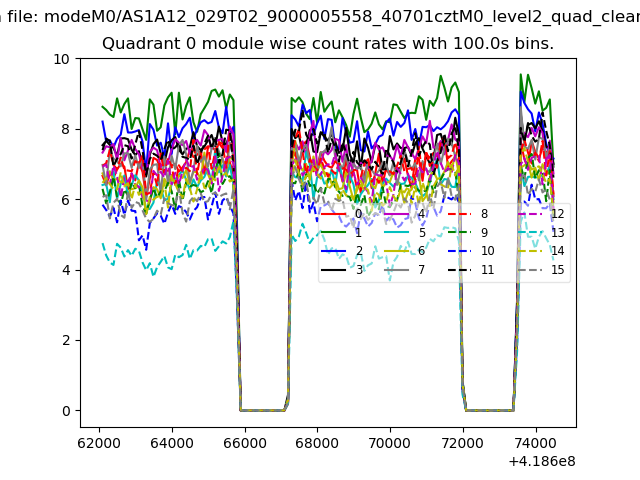 |
 |
| Module-wise count rates for Quadrant B Data is divided into 100 sec bins |
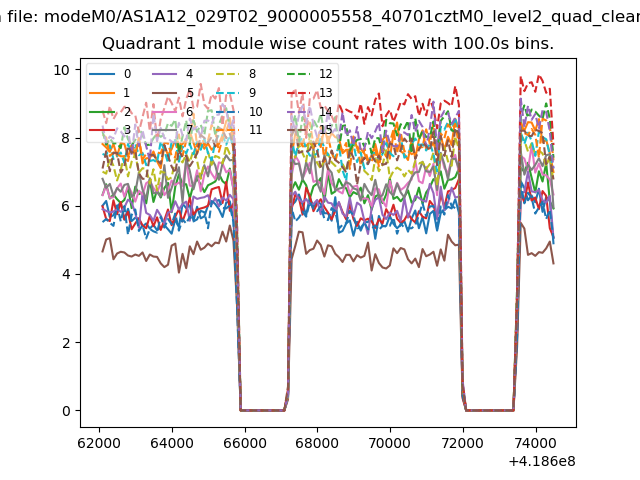 |
 |
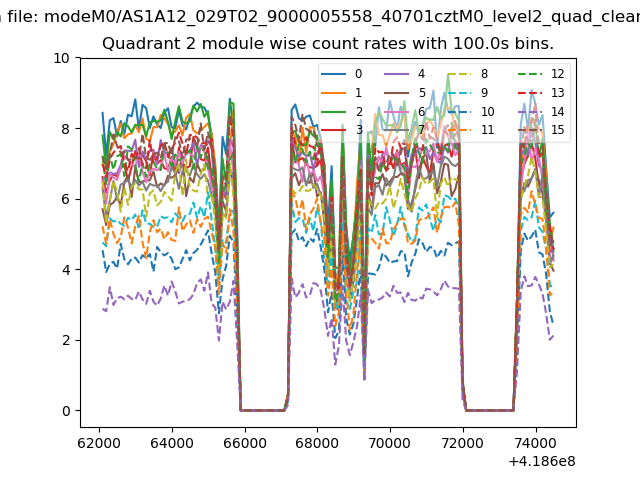
| Module-wise count rates for Quadrant C Data is divided into 100 sec bins |
 |
 |
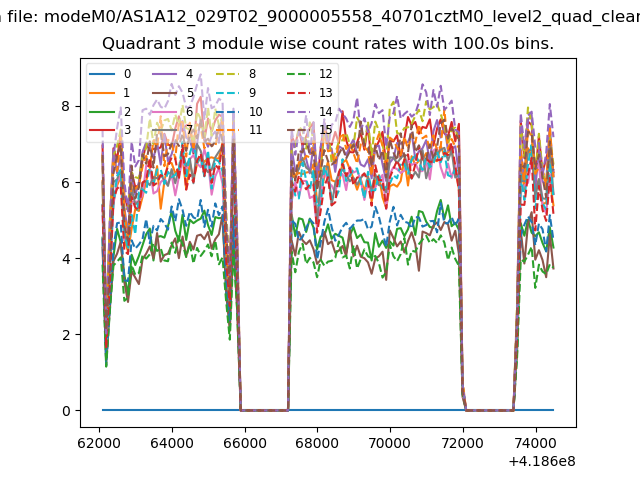
| Module-wise count rates for Quadrant D Data is divided into 100 sec bins |
 |
 |
| Parameter | Plot |
|---|---|
| CZT HV Monitor | 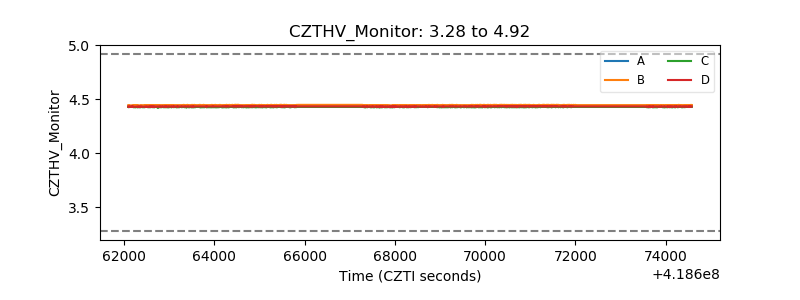 |
| D_VDD | 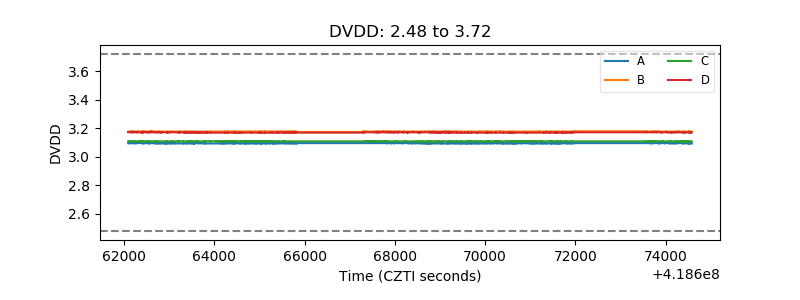 |
| Temperature 1 | 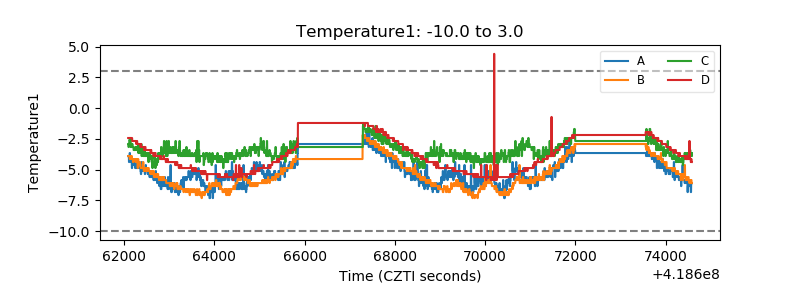 |
| Veto HV Monitor | 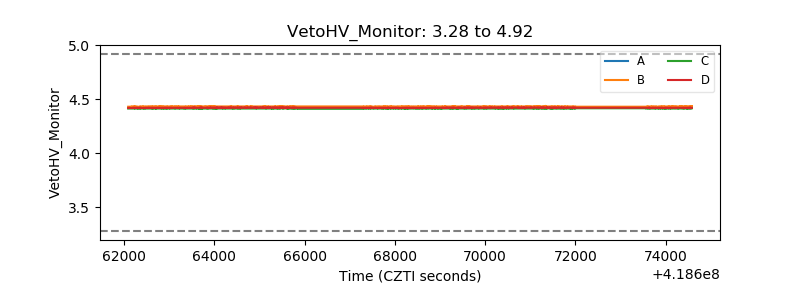 |
| Veto LLD | 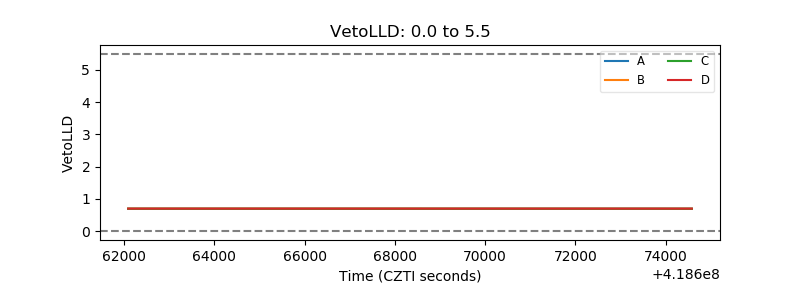 |
| Alpha Counter | 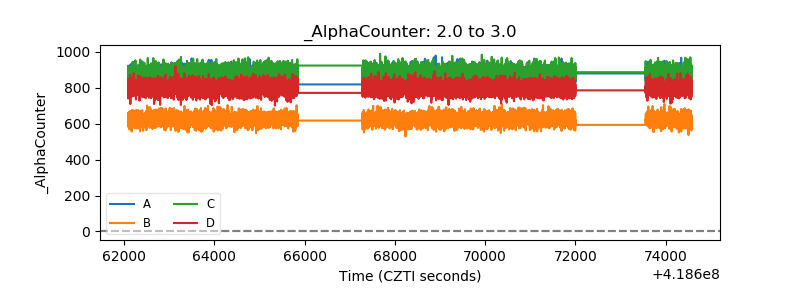 |
| _CPM_Rate | 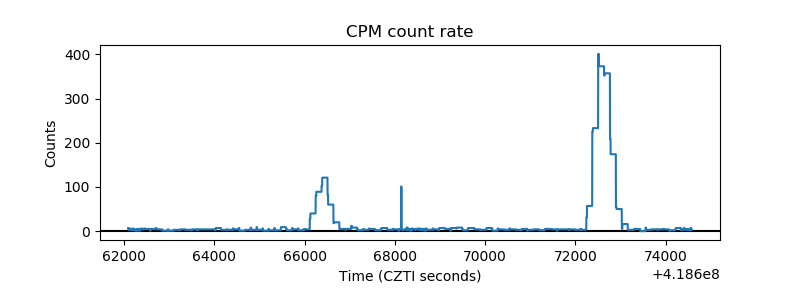 |
| CZT Counter | 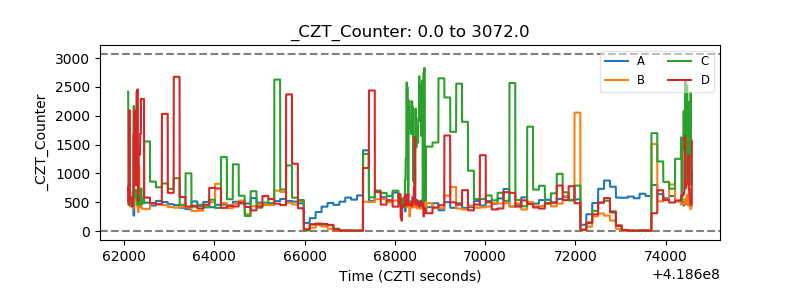 |
| +2.5 Volts monitor | 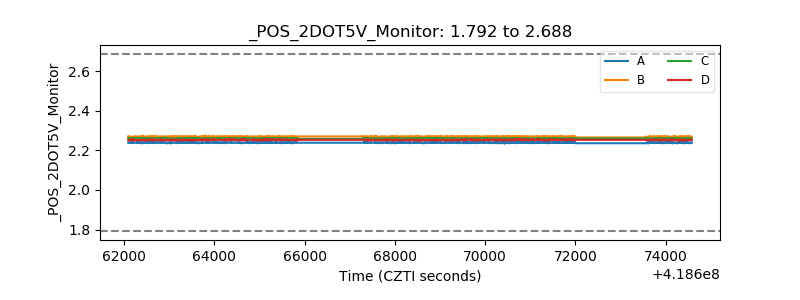 |
| +5 Volts monitor | 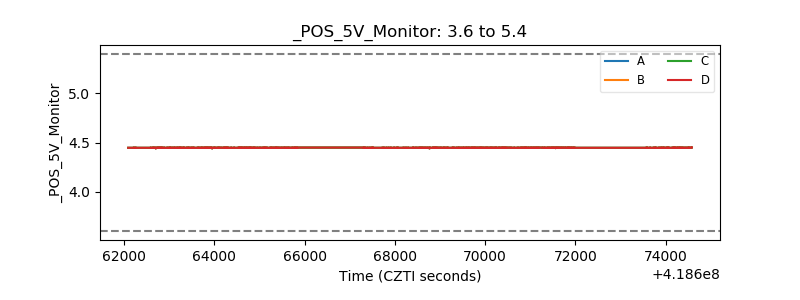 |
| _ROLL_ROT | 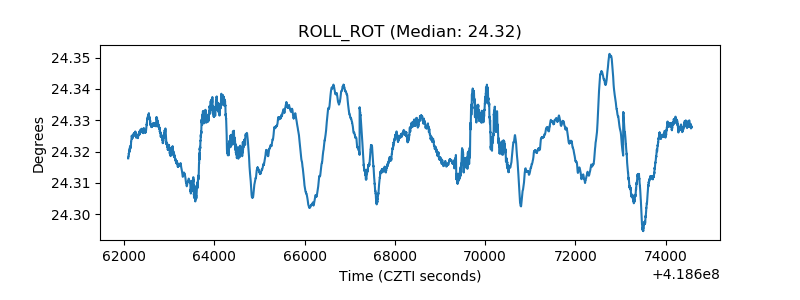 |
| _Roll_DEC | 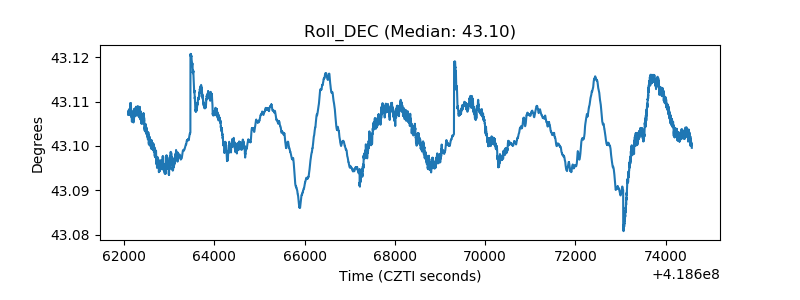 |
| _Roll_RA |  |
| Veto Counter | 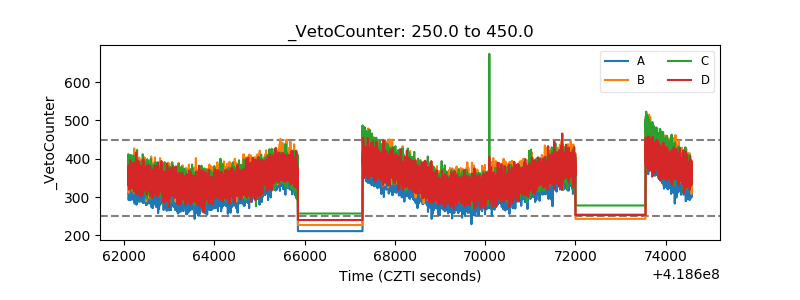 |