| Param | Original file | Final file |
|---|---|---|
| Filename | modeM0/AS1A12_029T02_9000005558_40702cztM0_level2.fits | modeM0/AS1A12_029T02_9000005558_40702cztM0_level2_quad_clean.evt |
| Size (bytes) | 431,755,200 | 88,387,200 |
| Size | 411.8 MB | 84.3 MB |
| Events in quadrant A | 2,889,395 | 610,138 |
| Events in quadrant B | 3,002,521 | 628,380 |
| Events in quadrant C | 6,389,221 | 539,622 |
| Events in quadrant D | 3,274,558 | 513,918 |
| Mode M0 | |||
|---|---|---|---|
| Quadrant | BADHDUFLAG | Total packets | Discarded packets |
| A | 0 | 12026 | 3 |
| B | 0 | 12616 | 2 |
| C | 0 | 22814 | 2 |
| D | 0 | 13470 | 2 |
| Mode M9 | |||
|---|---|---|---|
| Quadrant | BADHDUFLAG | Total packets | Discarded packets |
| A | 0 | 30 | 0 |
| B | 0 | 30 | 0 |
| C | 0 | 30 | 0 |
| D | 0 | 31 | 0 |
| Mode SS | |||
|---|---|---|---|
| Quadrant | BADHDUFLAG | Total packets | Discarded packets |
| A | 0 | 112 | 0 |
| B | 0 | 112 | 0 |
| C | 0 | 112 | 0 |
| D | 0 | 112 | 0 |
| Quadrant | Total seconds | Saturated seconds | Saturation percentage |
|---|---|---|---|
| A | 5484 | 16 | 0.291758% |
| B | 5484 | 68 | 1.239971% |
| C | 5484 | 845 | 15.408461% |
| D | 5484 | 489 | 8.916849% |
Noise dominated data is calculated using 1-second bins in cleaned event files. If a bin has >2000 counts, and if more than 50% of those come from <1% of pixels, then it is considered to be noise-dominated and hence unusable.
| Quadrant | # 1 sec bins | Bins with >0 counts | Bins with >2000 counts | High rate bins dominated by noise | Noise dominated (total time) | Noise dominated (detector-on time) | Marked lightcurve |
|---|---|---|---|---|---|---|---|
| A | 7156 | 5485 | 5 | 5 | 0.07% | 0.09% | 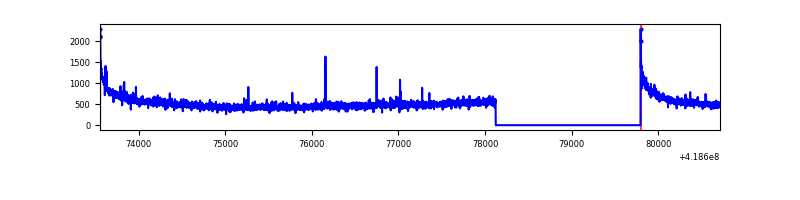 |
| B | 7156 | 5485 | 52 | 52 | 0.73% | 0.95% | 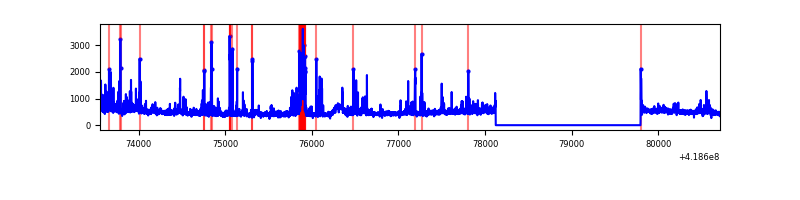 |
| C | 7156 | 5484 | 897 | 897 | 12.53% | 16.36% | 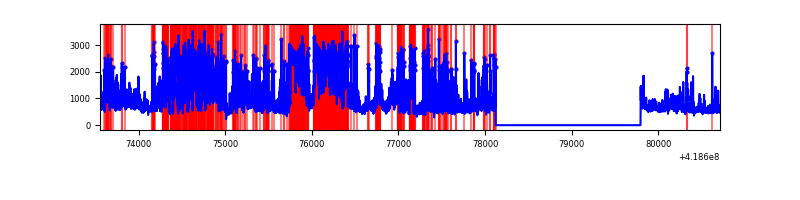 |
| D | 7156 | 5485 | 81 | 81 | 1.13% | 1.48% | 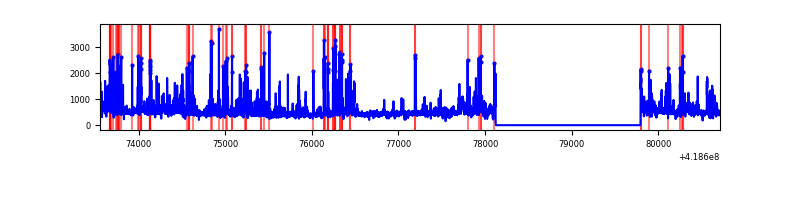 |
Top three noisy pixels from each quadrant. If the there are fewer than three noisy pixels in the level2.evt file, extra rows are filled as -1
| Pixel properties | Quadrant properties | ||||||
|---|---|---|---|---|---|---|---|
| Quadrant | DetID | PixID | Counts | Sigma | Mean | Median | Sigma |
| A | 10 | 83 | 491525 | 3893.34 | 609 | 595 | 126.1 |
| A | 6 | 10 | 22473 | 173.5 | 609 | 595 | 126.1 |
| A | 2 | 79 | 10441 | 78.08 | 609 | 595 | 126.1 |
| B | 0 | 229 | 219171 | 1836.63 | 606 | 589 | 119.0 |
| B | 5 | 255 | 212034 | 1776.66 | 606 | 589 | 119.0 |
| B | 0 | 190 | 99839 | 833.95 | 606 | 589 | 119.0 |
| C | 9 | 187 | 3122133 | 23404.23 | 570 | 574 | 133.4 |
| C | 14 | 254 | 777291 | 5823.52 | 570 | 574 | 133.4 |
| C | 15 | 214 | 227548 | 1701.76 | 570 | 574 | 133.4 |
| D | 12 | 227 | 482042 | 3355.37 | 569 | 554 | 143.5 |
| D | 2 | 250 | 197708 | 1373.92 | 569 | 554 | 143.5 |
| D | 12 | 191 | 167023 | 1160.08 | 569 | 554 | 143.5 |
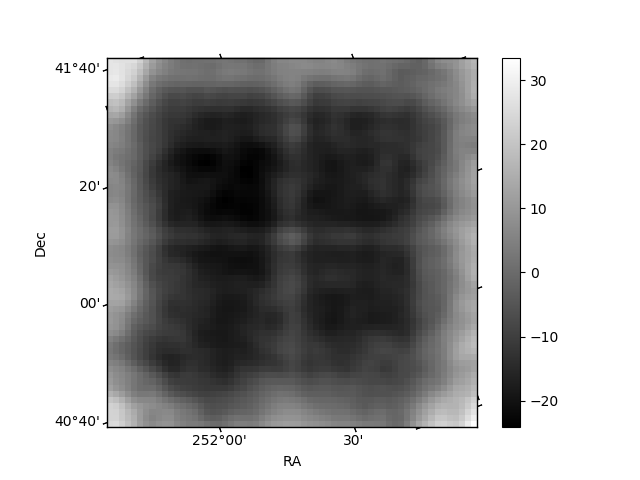
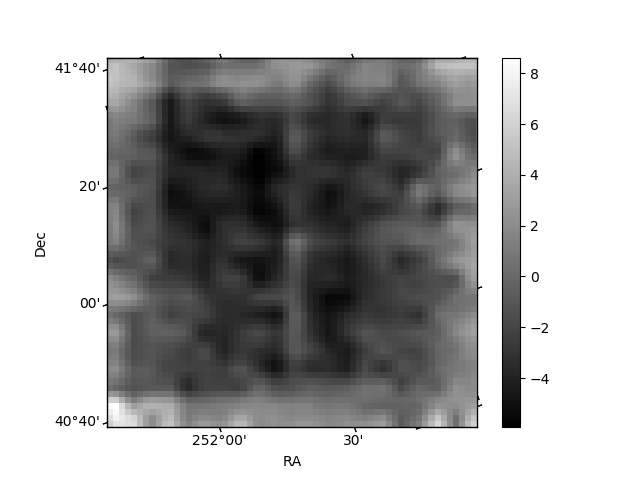
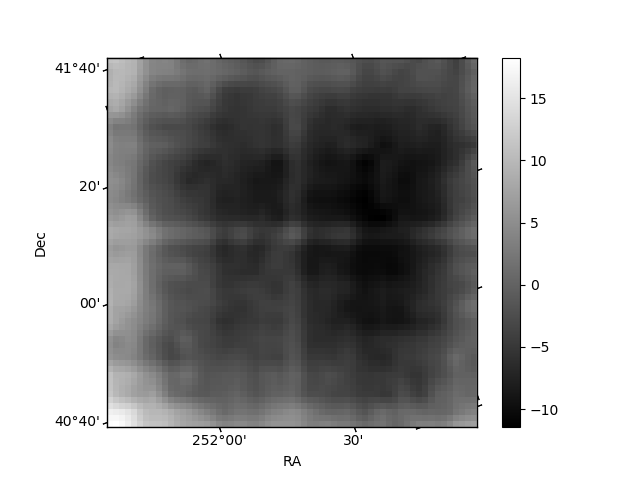
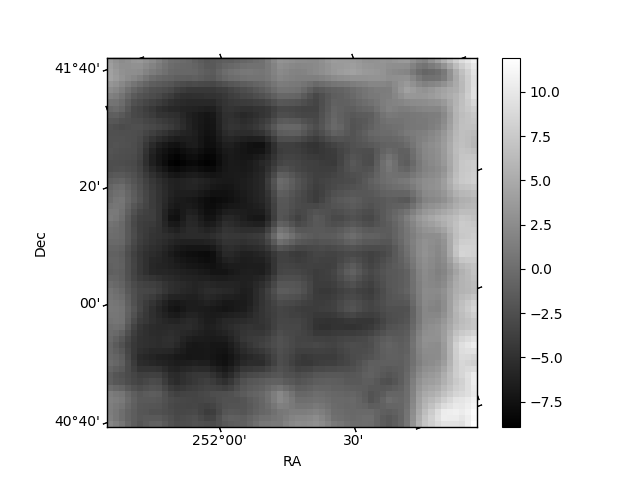
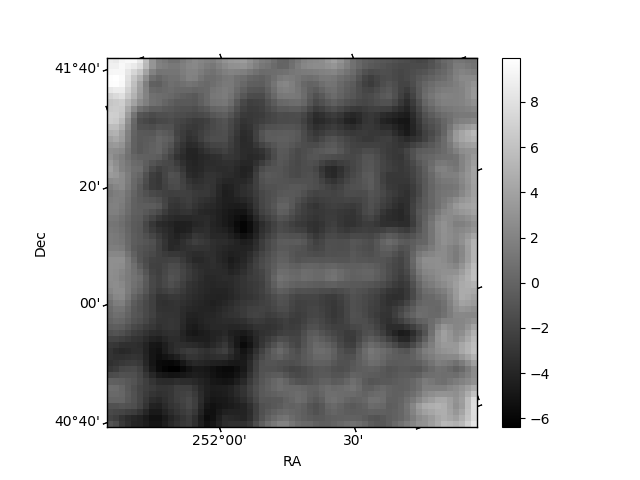
Histogram calculated using DETX and DETY for each event in the final _common_clean file
| Quadrant A | 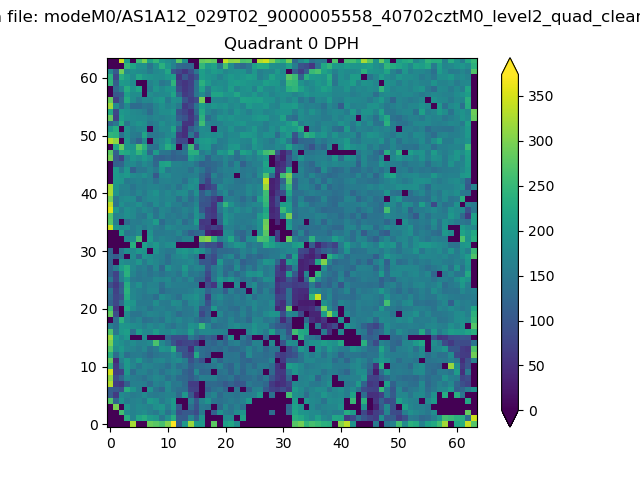 |
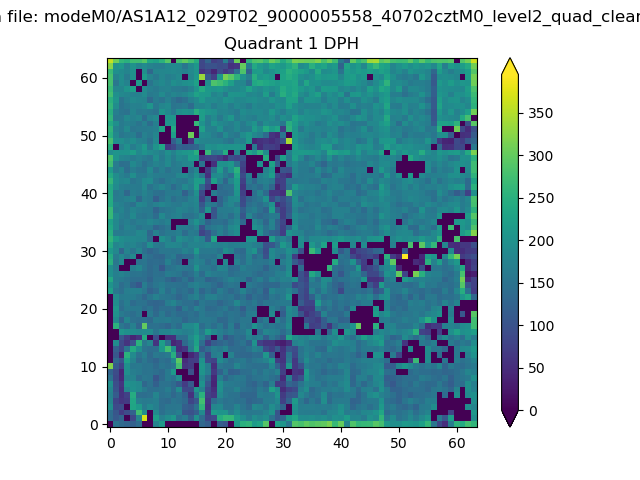 |
Quadrant B |
|---|---|---|---|
| Quadrant D | 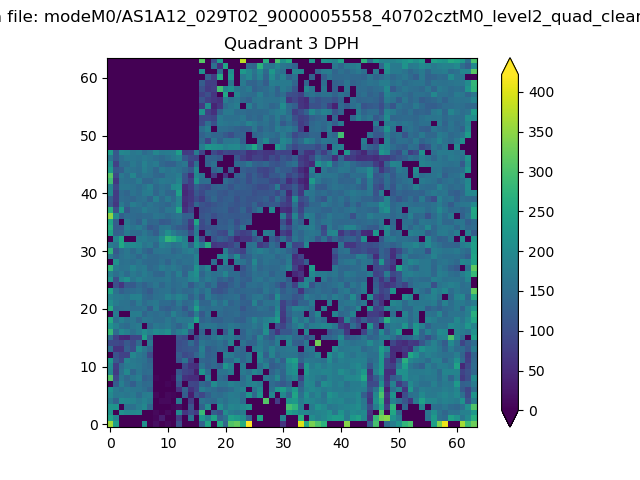 |
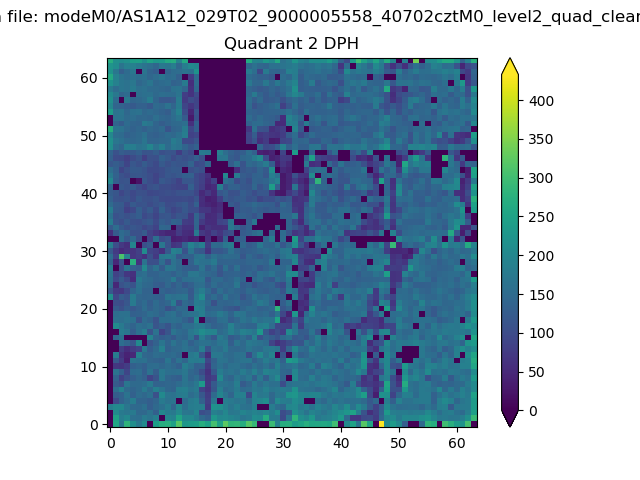 |
Quadrant C |
| Plot type | Count rate plots | Images |
|---|---|---|
| Comparison with Poisson distribution Blue bars denote a histogram of data divided into 1 sec bins. Red curve is a Poisson curve with rate = median count rate of data. |
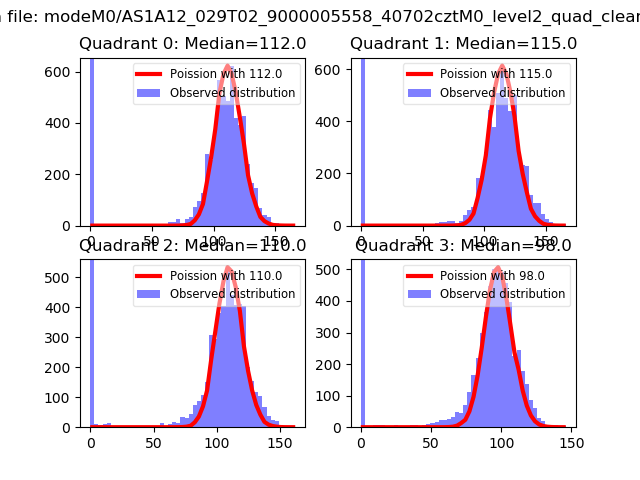 |
 |
| Quadrant-wise count rates Data is divided into 100 sec bins |
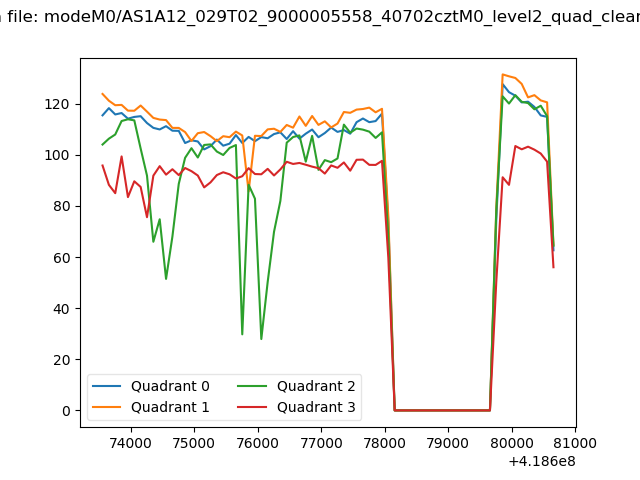 |
|
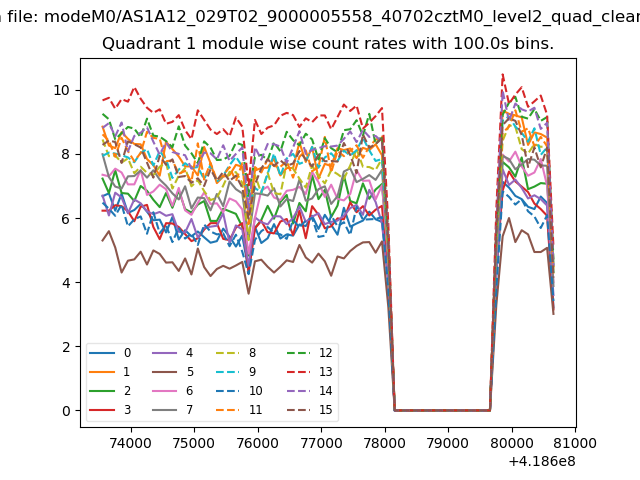
| Module-wise count rates for Quadrant A Data is divided into 100 sec bins |
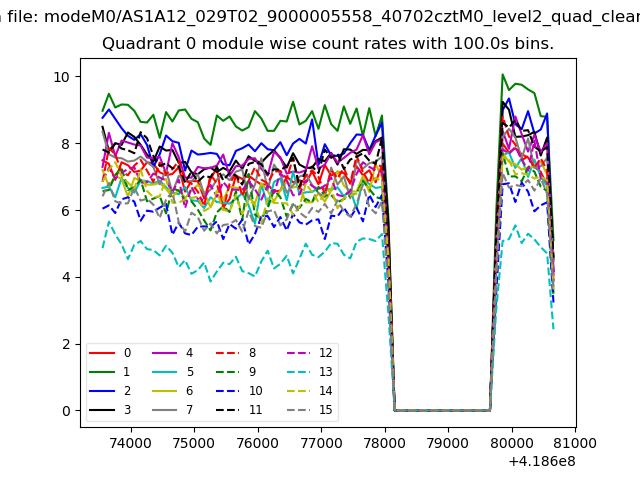 |
 |
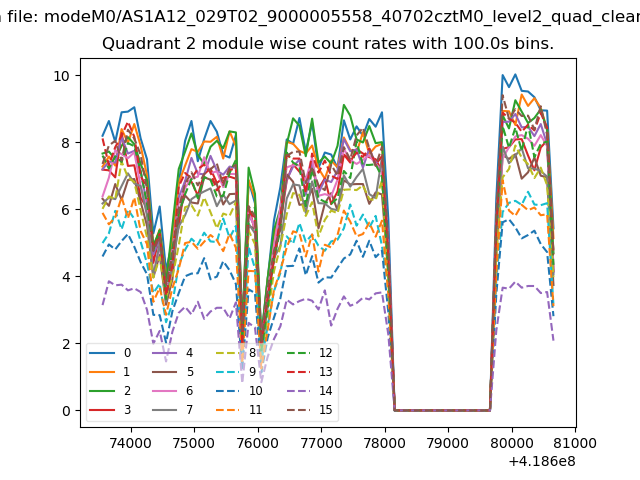
| Module-wise count rates for Quadrant B Data is divided into 100 sec bins |
 |
 |
| Module-wise count rates for Quadrant C Data is divided into 100 sec bins |
 |
 |
| Module-wise count rates for Quadrant D Data is divided into 100 sec bins |
 |
 |
| Parameter | Plot |
|---|---|
| CZT HV Monitor | 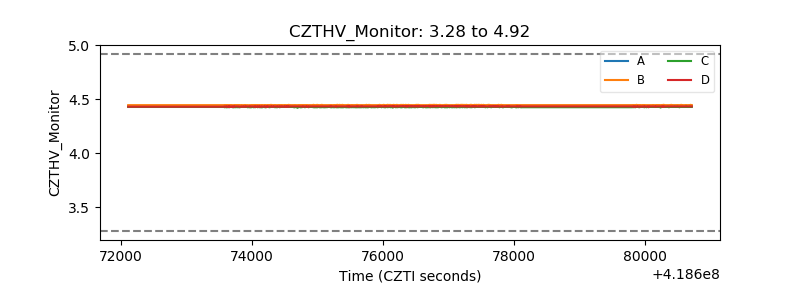 |
| D_VDD | 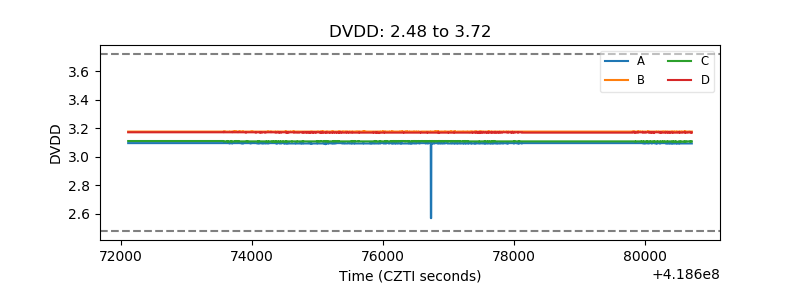 |
| Temperature 1 | 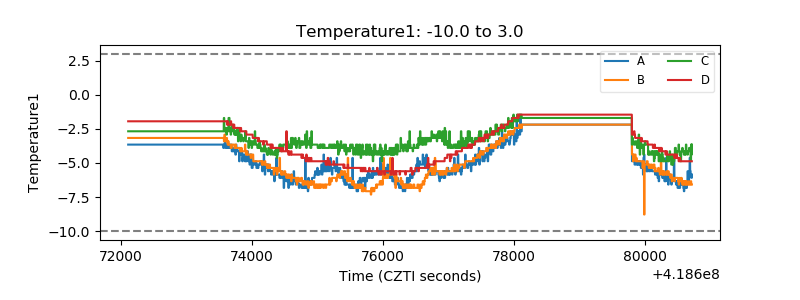 |
| Veto HV Monitor | 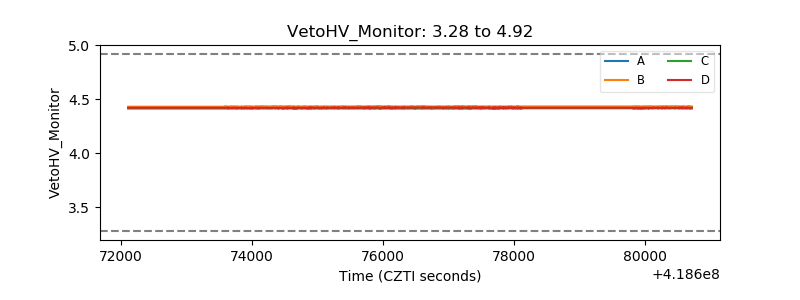 |
| Veto LLD | 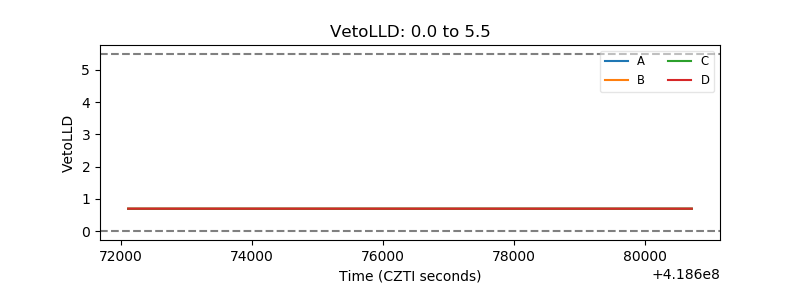 |
| Alpha Counter | 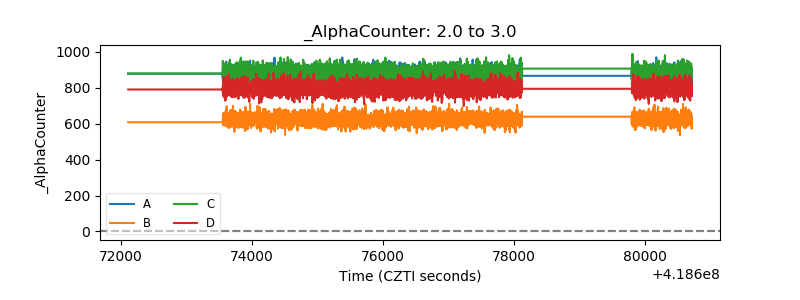 |
| _CPM_Rate | 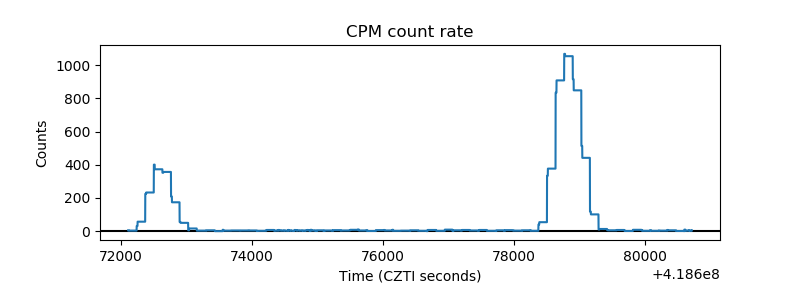 |
| CZT Counter | 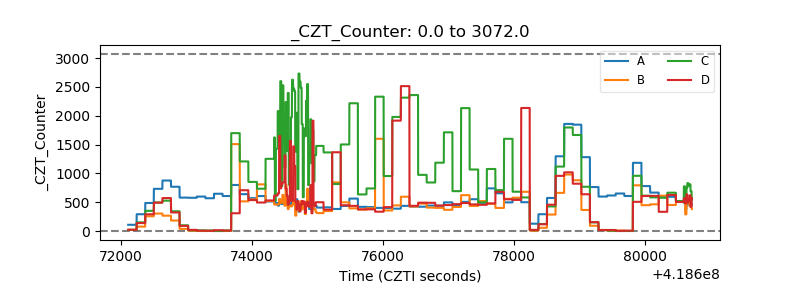 |
| +2.5 Volts monitor | 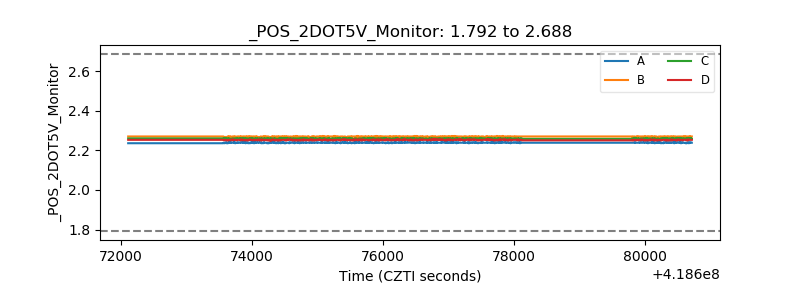 |
| +5 Volts monitor |  |
| _ROLL_ROT | 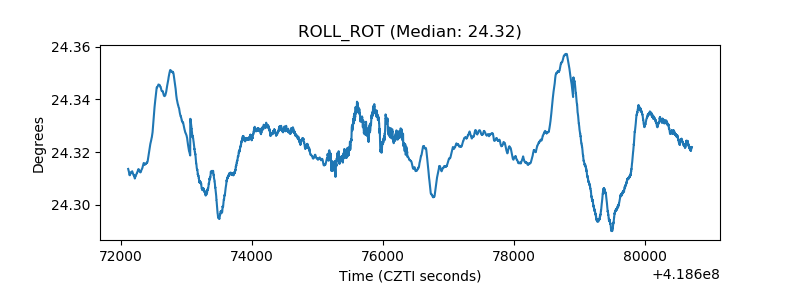 |
| _Roll_DEC | 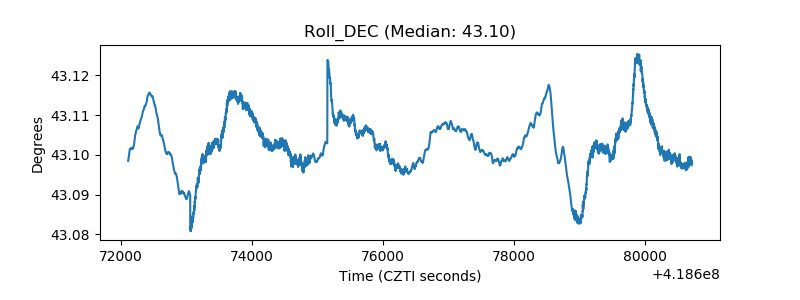 |
| _Roll_RA | 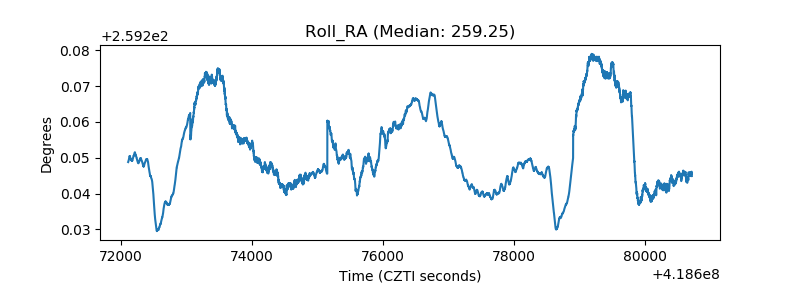 |
| Veto Counter | 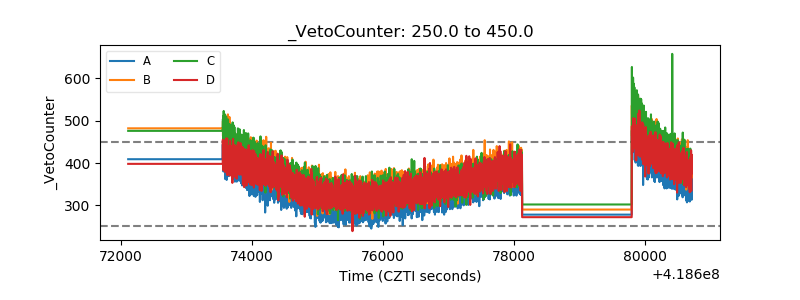 |