| Param | Original file | Final file |
|---|---|---|
| Filename | modeM0/AS1A12_029T02_9000005558_40704cztM0_level2.fits | modeM0/AS1A12_029T02_9000005558_40704cztM0_level2_quad_clean.evt |
| Size (bytes) | 381,070,080 | 95,140,800 |
| Size | 363.4 MB | 90.7 MB |
| Events in quadrant A | 2,956,658 | 645,986 |
| Events in quadrant B | 2,790,159 | 668,451 |
| Events in quadrant C | 4,632,202 | 626,071 |
| Events in quadrant D | 3,287,645 | 545,221 |
| Mode M0 | |||
|---|---|---|---|
| Quadrant | BADHDUFLAG | Total packets | Discarded packets |
| A | 0 | 12288 | 3 |
| B | 0 | 12053 | 2 |
| C | 0 | 17588 | 2 |
| D | 0 | 13648 | 2 |
| Mode M9 | |||
|---|---|---|---|
| Quadrant | BADHDUFLAG | Total packets | Discarded packets |
| A | 0 | 34 | 0 |
| B | 0 | 34 | 0 |
| C | 0 | 34 | 0 |
| D | 0 | 34 | 0 |
| Mode SS | |||
|---|---|---|---|
| Quadrant | BADHDUFLAG | Total packets | Discarded packets |
| A | 0 | 118 | 0 |
| B | 0 | 118 | 0 |
| C | 0 | 118 | 0 |
| D | 0 | 118 | 0 |
| Quadrant | Total seconds | Saturated seconds | Saturation percentage |
|---|---|---|---|
| A | 5645 | 12 | 0.212578% |
| B | 5645 | 21 | 0.372011% |
| C | 5645 | 289 | 5.119575% |
| D | 5645 | 464 | 8.219663% |
Noise dominated data is calculated using 1-second bins in cleaned event files. If a bin has >2000 counts, and if more than 50% of those come from <1% of pixels, then it is considered to be noise-dominated and hence unusable.
| Quadrant | # 1 sec bins | Bins with >0 counts | Bins with >2000 counts | High rate bins dominated by noise | Noise dominated (total time) | Noise dominated (detector-on time) | Marked lightcurve |
|---|---|---|---|---|---|---|---|
| A | 9110 | 5647 | 4 | 4 | 0.04% | 0.07% | 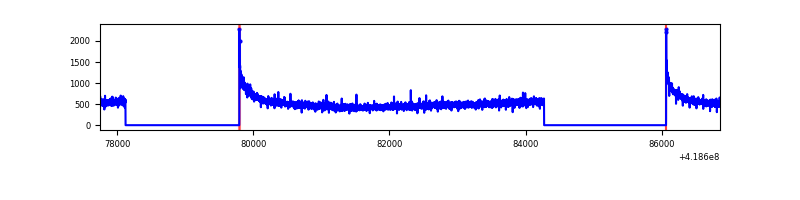 |
| B | 9110 | 5647 | 9 | 9 | 0.10% | 0.16% | 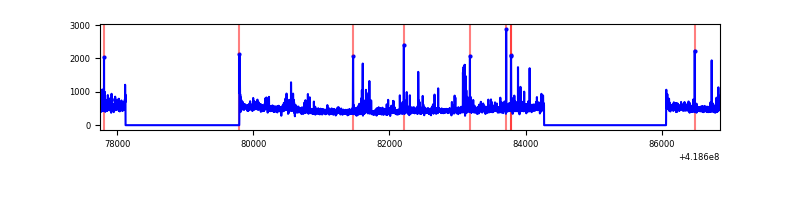 |
| C | 9109 | 5645 | 280 | 280 | 3.07% | 4.96% | 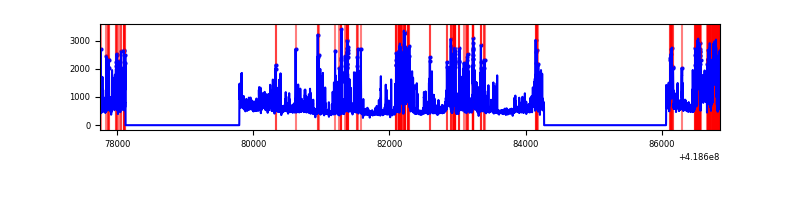 |
| D | 9110 | 5647 | 67 | 67 | 0.74% | 1.19% | 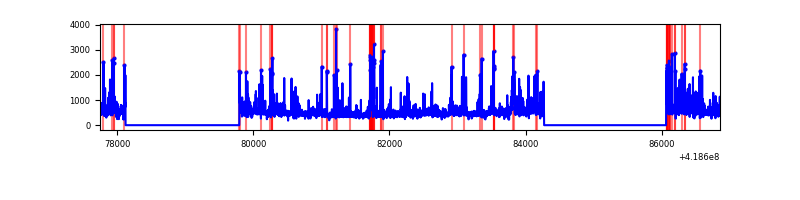 |
Top three noisy pixels from each quadrant. If the there are fewer than three noisy pixels in the level2.evt file, extra rows are filled as -1
| Pixel properties | Quadrant properties | ||||||
|---|---|---|---|---|---|---|---|
| Quadrant | DetID | PixID | Counts | Sigma | Mean | Median | Sigma |
| A | 10 | 83 | 494946 | 3807.33 | 634 | 622 | 129.8 |
| A | 3 | 137 | 7151 | 50.29 | 634 | 622 | 129.8 |
| A | 13 | 254 | 6298 | 43.72 | 634 | 622 | 129.8 |
| B | 0 | 229 | 160379 | 1293.11 | 634 | 617 | 123.5 |
| B | 0 | 190 | 57210 | 458.06 | 634 | 617 | 123.5 |
| B | 3 | 112 | 35993 | 286.33 | 634 | 617 | 123.5 |
| C | 9 | 187 | 1967353 | 13599.32 | 618 | 622 | 144.6 |
| C | 15 | 214 | 240734 | 1660.3 | 618 | 622 | 144.6 |
| C | 5 | 10 | 8579 | 55.02 | 618 | 622 | 144.6 |
| D | 2 | 250 | 239878 | 1627.23 | 593 | 577 | 147.1 |
| D | 2 | 249 | 202491 | 1373.0 | 593 | 577 | 147.1 |
| D | 12 | 227 | 169685 | 1149.92 | 593 | 577 | 147.1 |
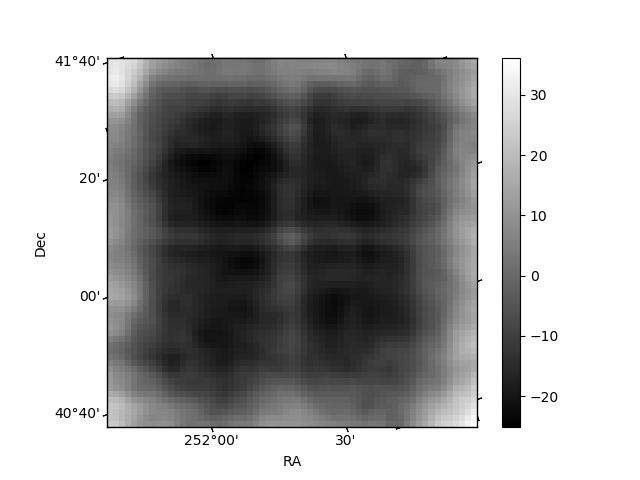
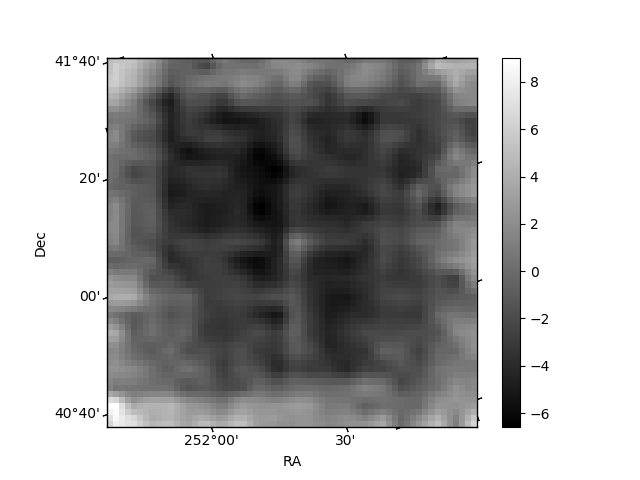
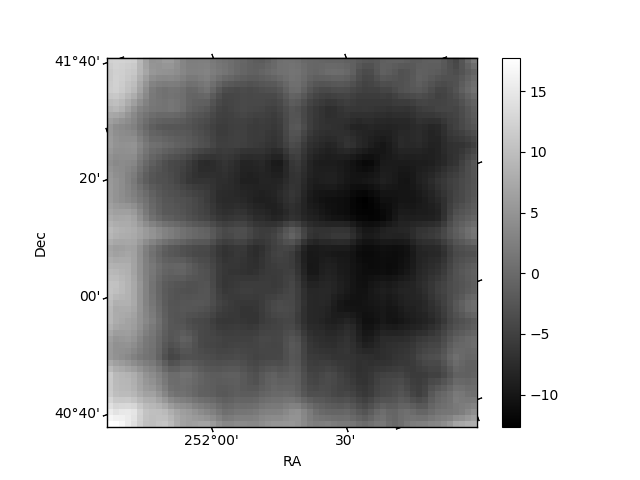
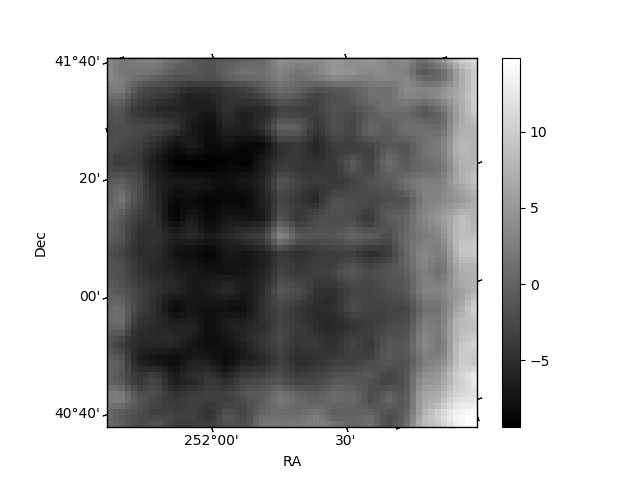
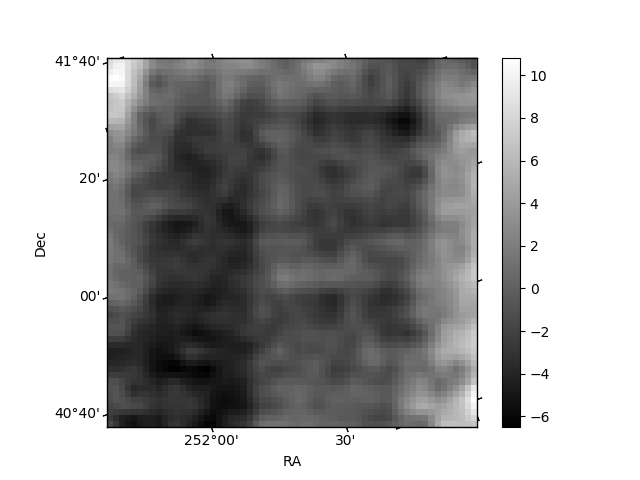
Histogram calculated using DETX and DETY for each event in the final _common_clean file
| Quadrant A | 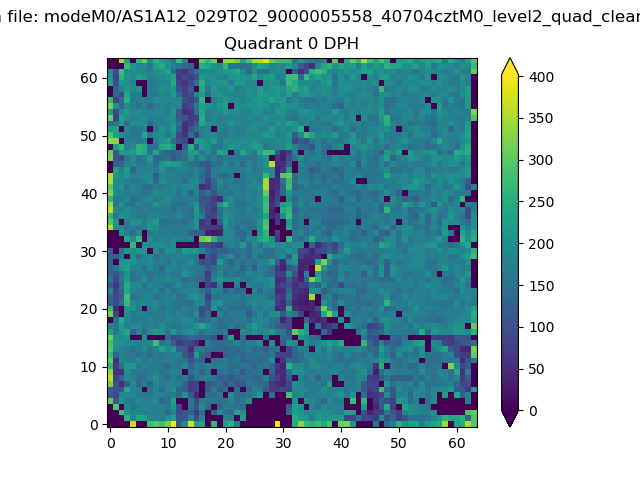 |
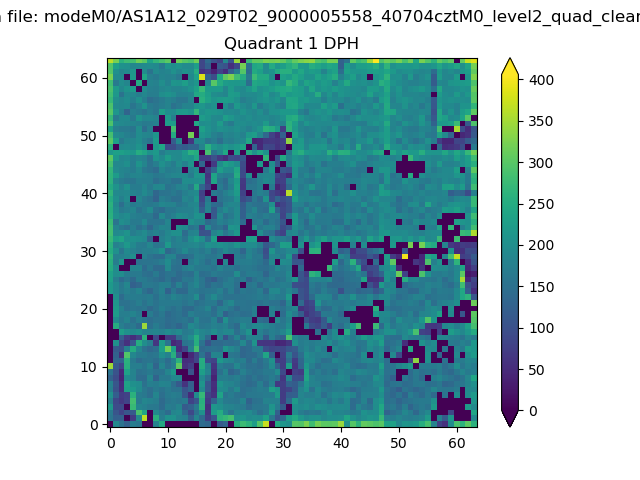 |
Quadrant B |
|---|---|---|---|
| Quadrant D | 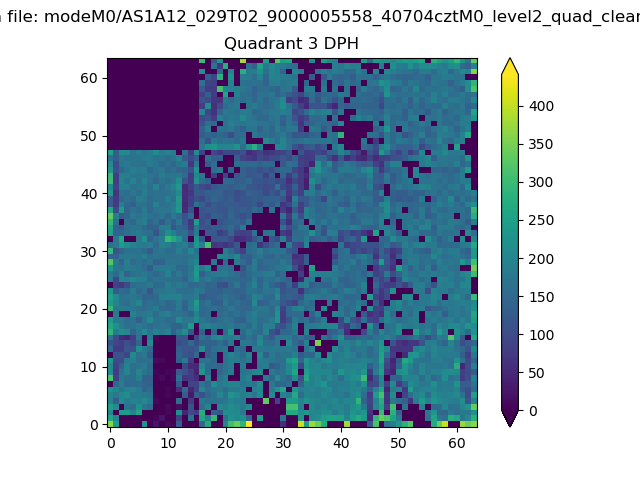 |
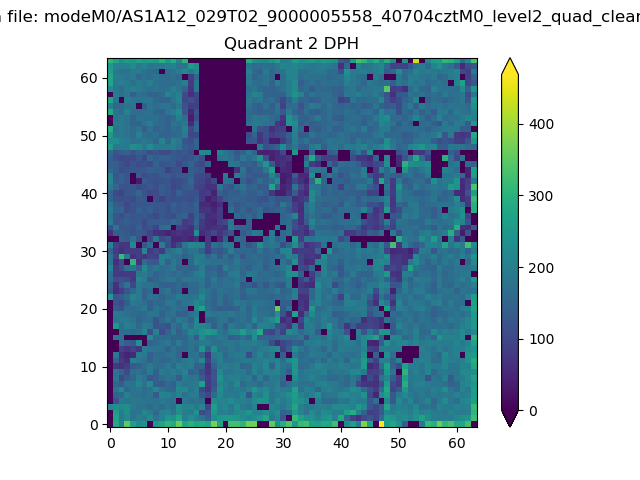 |
Quadrant C |
| Plot type | Count rate plots | Images |
|---|---|---|
| Comparison with Poisson distribution Blue bars denote a histogram of data divided into 1 sec bins. Red curve is a Poisson curve with rate = median count rate of data. |
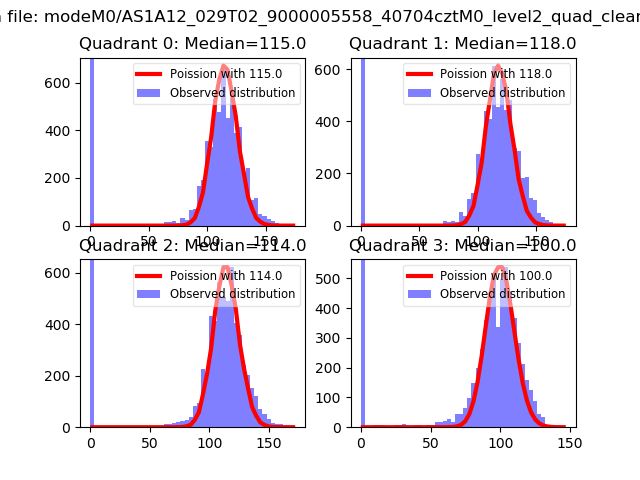 |
 |
| Quadrant-wise count rates Data is divided into 100 sec bins |
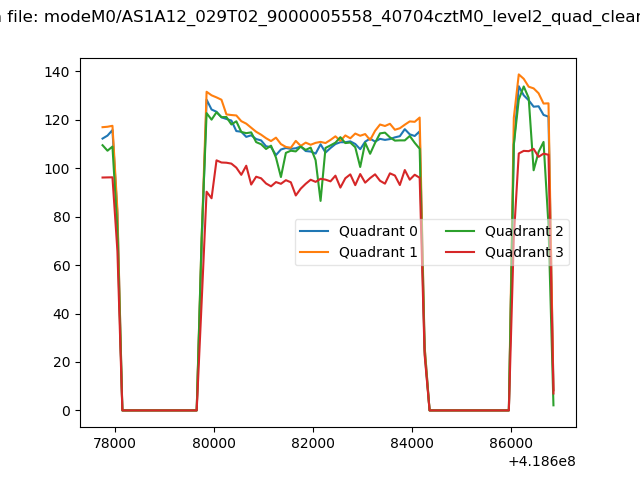 |
|
| Module-wise count rates for Quadrant A Data is divided into 100 sec bins |
 |
 |
| Module-wise count rates for Quadrant B Data is divided into 100 sec bins |
 |
 |
| Module-wise count rates for Quadrant C Data is divided into 100 sec bins |
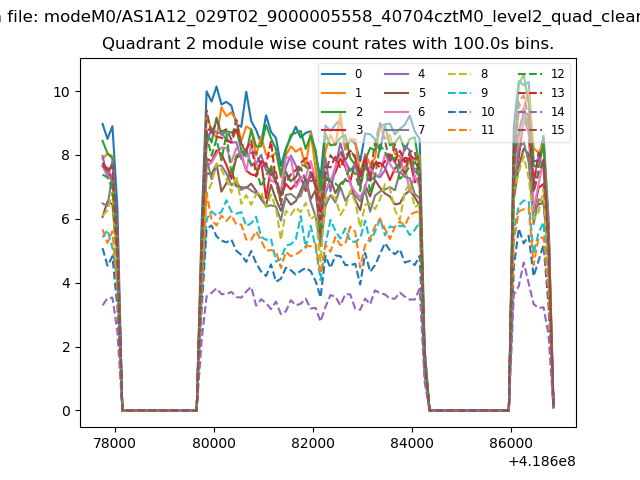 |
 |
| Module-wise count rates for Quadrant D Data is divided into 100 sec bins |
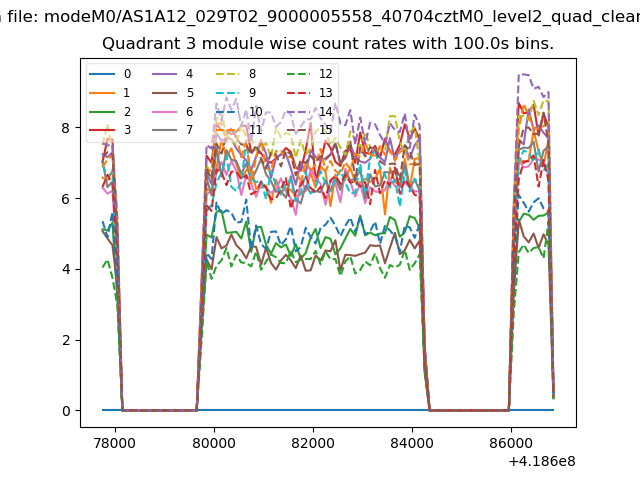 |
 |
| Parameter | Plot |
|---|---|
| CZT HV Monitor | 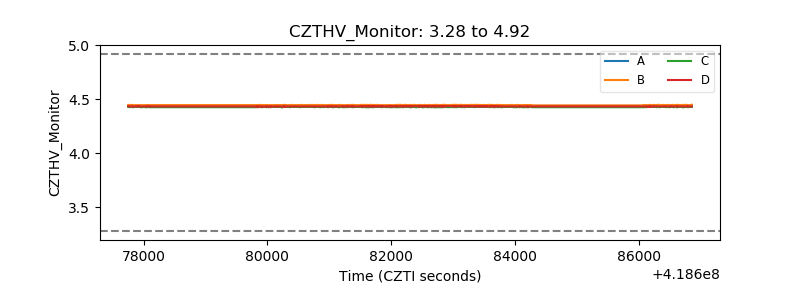 |
| D_VDD | 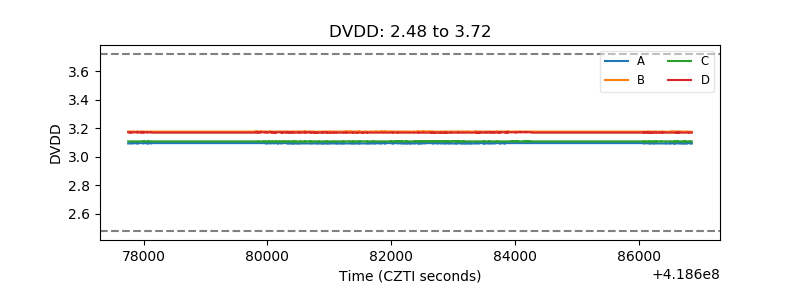 |
| Temperature 1 | 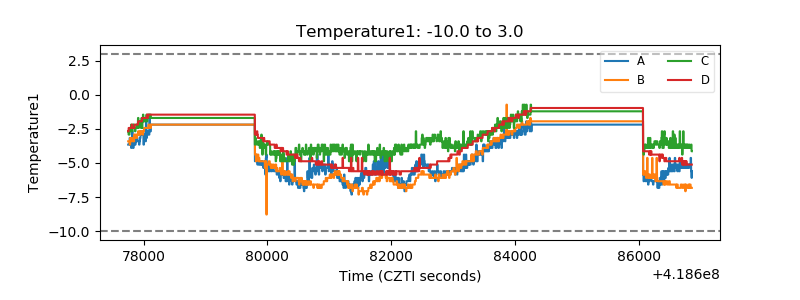 |
| Veto HV Monitor | 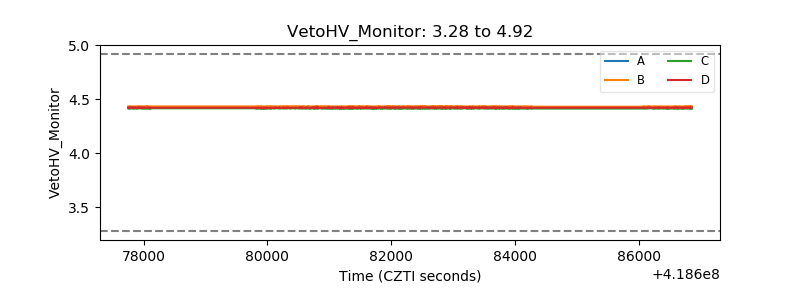 |
| Veto LLD | 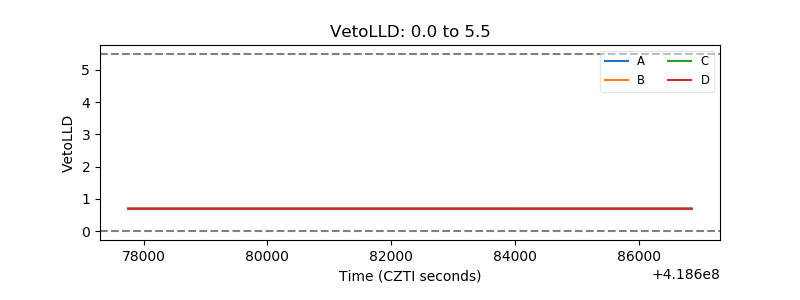 |
| Alpha Counter | 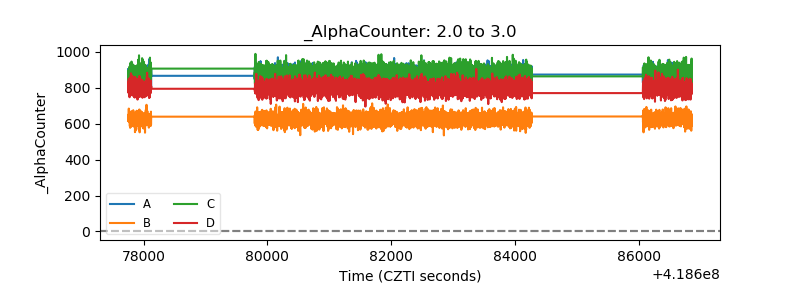 |
| _CPM_Rate | 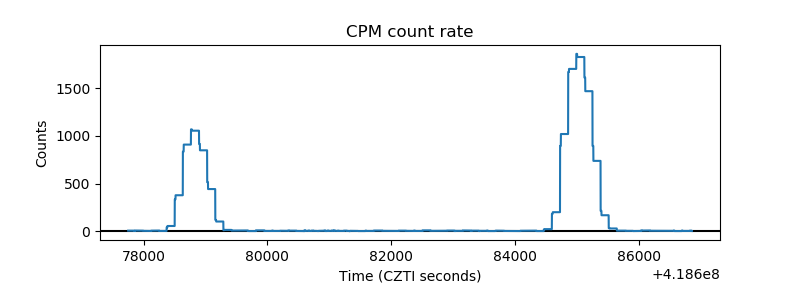 |
| CZT Counter | 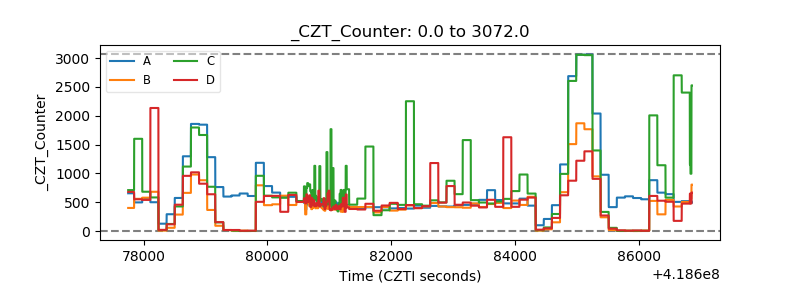 |
| +2.5 Volts monitor |  |
| +5 Volts monitor |  |
| _ROLL_ROT | 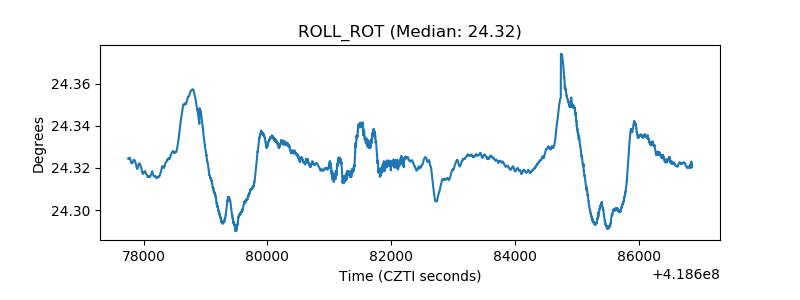 |
| _Roll_DEC | 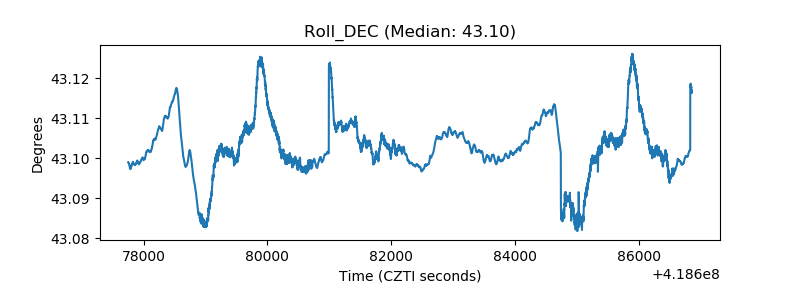 |
| _Roll_RA | 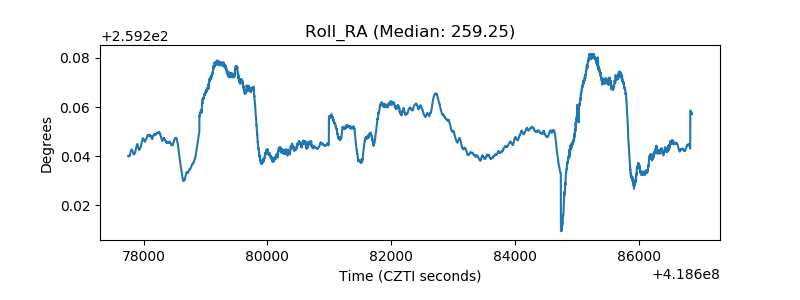 |
| Veto Counter | 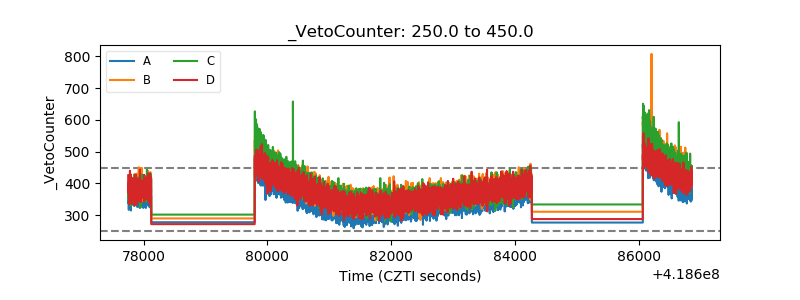 |