| Param | Original file | Final file |
|---|---|---|
| Filename | modeM0/AS1A12_029T02_9000005558_40705cztM0_level2.fits | modeM0/AS1A12_029T02_9000005558_40705cztM0_level2_quad_clean.evt |
| Size (bytes) | 392,264,640 | 92,272,320 |
| Size | 374.1 MB | 88.0 MB |
| Events in quadrant A | 2,865,518 | 635,758 |
| Events in quadrant B | 2,804,047 | 663,453 |
| Events in quadrant C | 5,510,045 | 578,582 |
| Events in quadrant D | 2,921,876 | 539,464 |
| Mode M0 | |||
|---|---|---|---|
| Quadrant | BADHDUFLAG | Total packets | Discarded packets |
| A | 0 | 11802 | 3 |
| B | 0 | 11843 | 2 |
| C | 0 | 20010 | 2 |
| D | 0 | 12456 | 2 |
| Mode M9 | |||
|---|---|---|---|
| Quadrant | BADHDUFLAG | Total packets | Discarded packets |
| A | 0 | 37 | 0 |
| B | 0 | 37 | 0 |
| C | 0 | 37 | 0 |
| D | 0 | 37 | 0 |
| Mode SS | |||
|---|---|---|---|
| Quadrant | BADHDUFLAG | Total packets | Discarded packets |
| A | 0 | 112 | 0 |
| B | 0 | 112 | 0 |
| C | 0 | 112 | 0 |
| D | 0 | 112 | 0 |
| Quadrant | Total seconds | Saturated seconds | Saturation percentage |
|---|---|---|---|
| A | 5380 | 7 | 0.130112% |
| B | 5380 | 22 | 0.408922% |
| C | 5380 | 684 | 12.713755% |
| D | 5380 | 376 | 6.988848% |
Noise dominated data is calculated using 1-second bins in cleaned event files. If a bin has >2000 counts, and if more than 50% of those come from <1% of pixels, then it is considered to be noise-dominated and hence unusable.
| Quadrant | # 1 sec bins | Bins with >0 counts | Bins with >2000 counts | High rate bins dominated by noise | Noise dominated (total time) | Noise dominated (detector-on time) | Marked lightcurve |
|---|---|---|---|---|---|---|---|
| A | 9085 | 5382 | 4 | 4 | 0.04% | 0.07% | 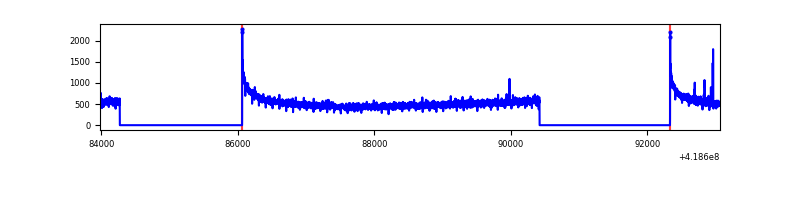 |
| B | 9085 | 5382 | 14 | 14 | 0.15% | 0.26% | 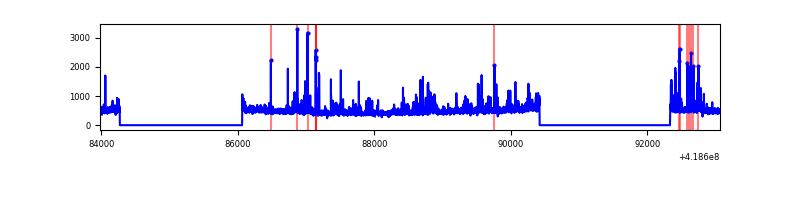 |
| C | 9085 | 5381 | 707 | 707 | 7.78% | 13.14% | 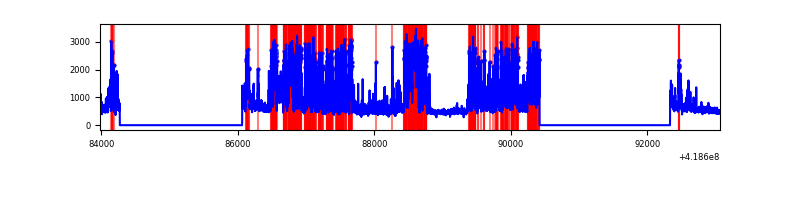 |
| D | 9085 | 5382 | 52 | 52 | 0.57% | 0.97% | 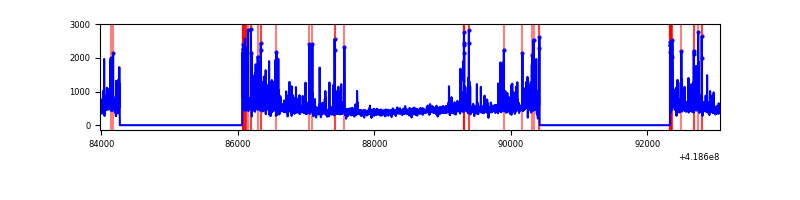 |
Top three noisy pixels from each quadrant. If the there are fewer than three noisy pixels in the level2.evt file, extra rows are filled as -1
| Pixel properties | Quadrant properties | ||||||
|---|---|---|---|---|---|---|---|
| Quadrant | DetID | PixID | Counts | Sigma | Mean | Median | Sigma |
| A | 10 | 83 | 476996 | 3801.24 | 609 | 596 | 125.3 |
| A | 2 | 79 | 18699 | 144.45 | 609 | 596 | 125.3 |
| A | 13 | 248 | 7668 | 56.43 | 609 | 596 | 125.3 |
| B | 0 | 229 | 172345 | 1471.53 | 612 | 595 | 116.7 |
| B | 0 | 190 | 135219 | 1153.44 | 612 | 595 | 116.7 |
| B | 5 | 255 | 42995 | 363.27 | 612 | 595 | 116.7 |
| C | 9 | 187 | 3011339 | 22428.98 | 579 | 584 | 134.2 |
| C | 15 | 214 | 224841 | 1670.63 | 579 | 584 | 134.2 |
| C | 12 | 249 | 7590 | 52.19 | 579 | 584 | 134.2 |
| D | 2 | 250 | 211616 | 1481.94 | 571 | 554 | 142.4 |
| D | 12 | 191 | 152373 | 1065.98 | 571 | 554 | 142.4 |
| D | 2 | 249 | 92254 | 643.86 | 571 | 554 | 142.4 |
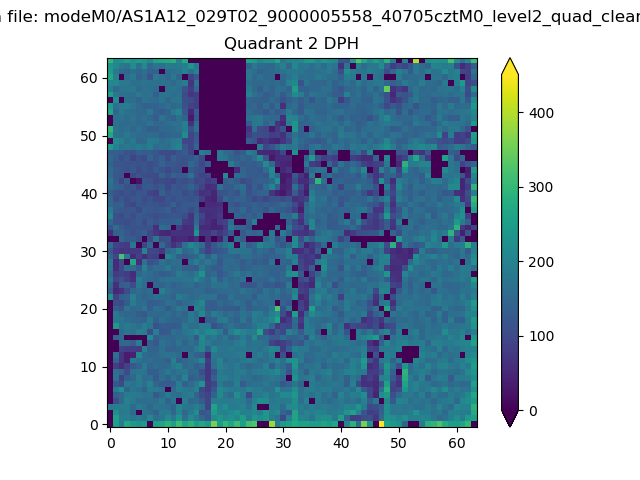
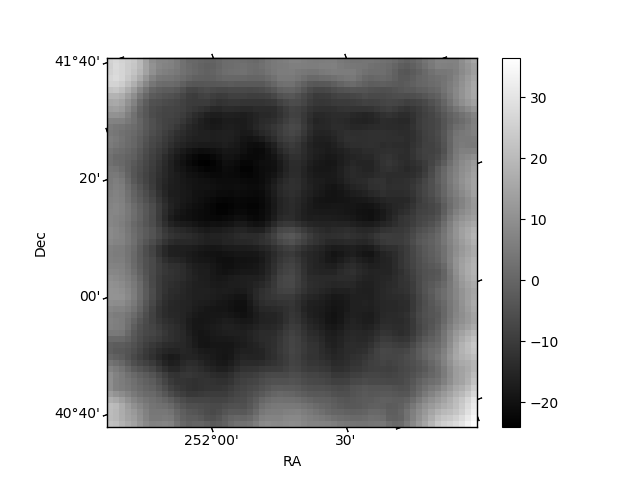
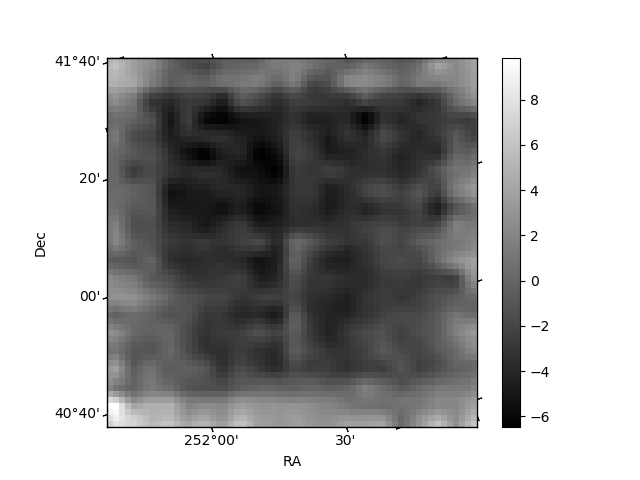
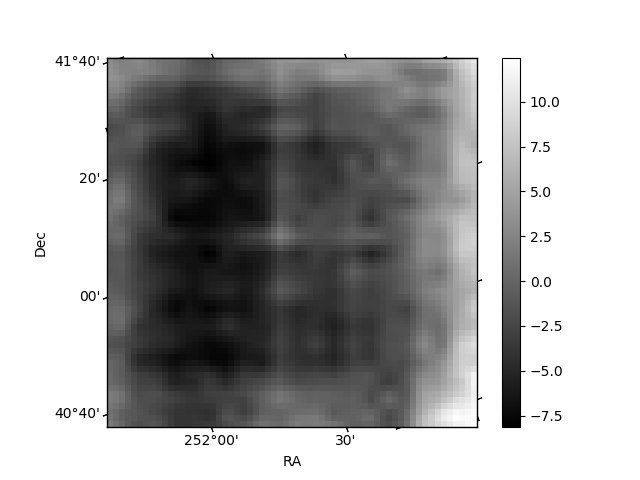
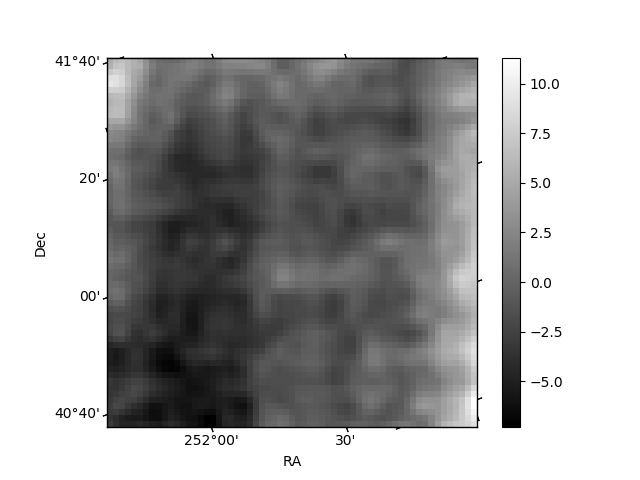
Histogram calculated using DETX and DETY for each event in the final _common_clean file
| Quadrant A | 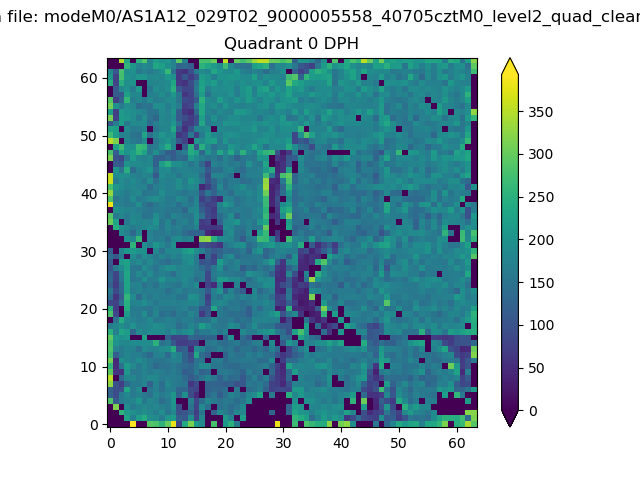 |
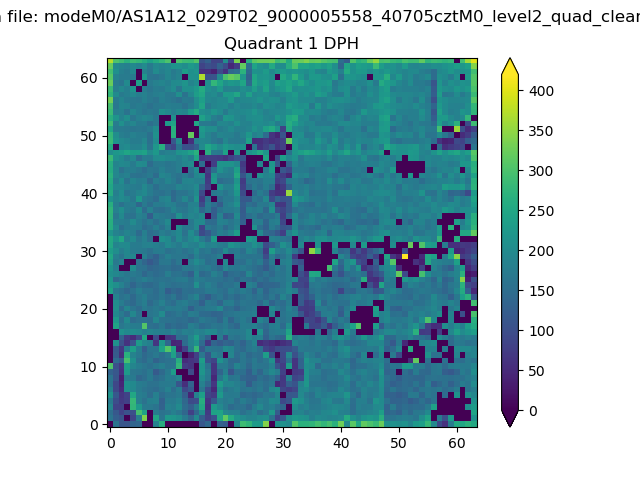 |
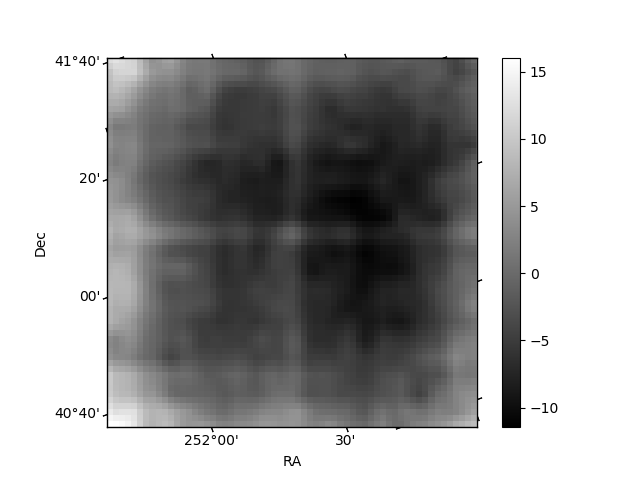
Quadrant B |
|---|---|---|---|
| Quadrant D | 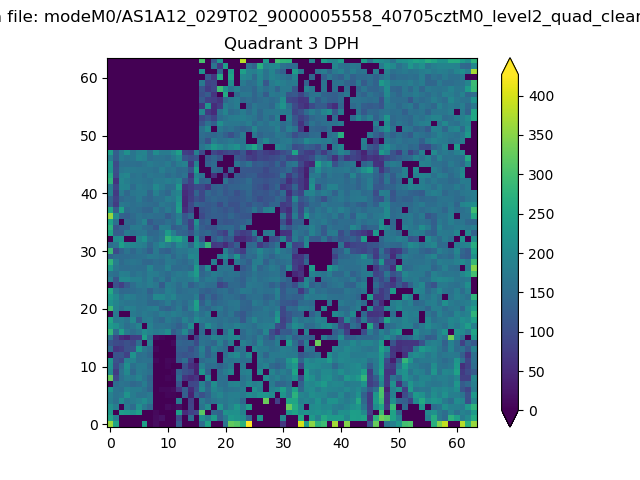 |
 |
Quadrant C |
| Plot type | Count rate plots | Images |
|---|---|---|
| Comparison with Poisson distribution Blue bars denote a histogram of data divided into 1 sec bins. Red curve is a Poisson curve with rate = median count rate of data. |
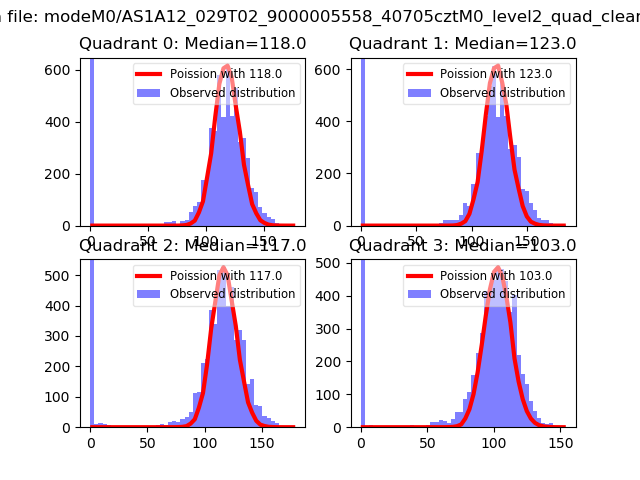 |
 |
| Quadrant-wise count rates Data is divided into 100 sec bins |
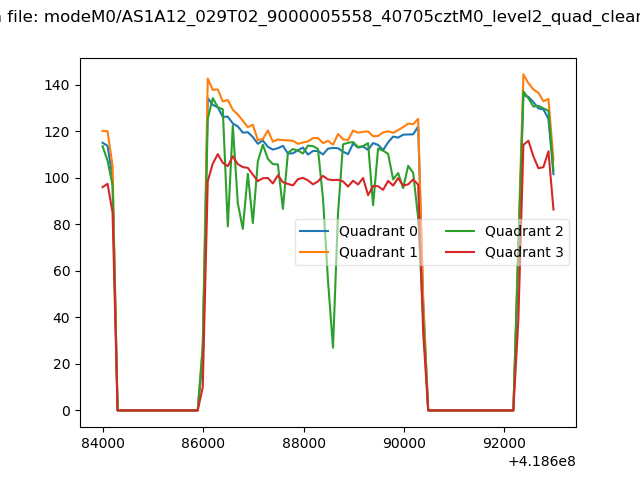 |
|
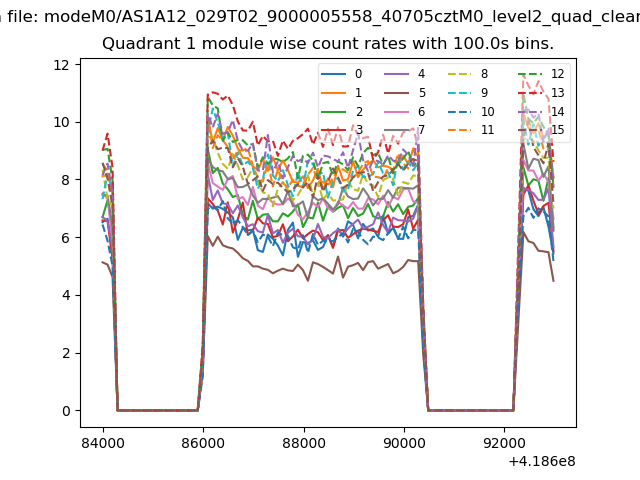
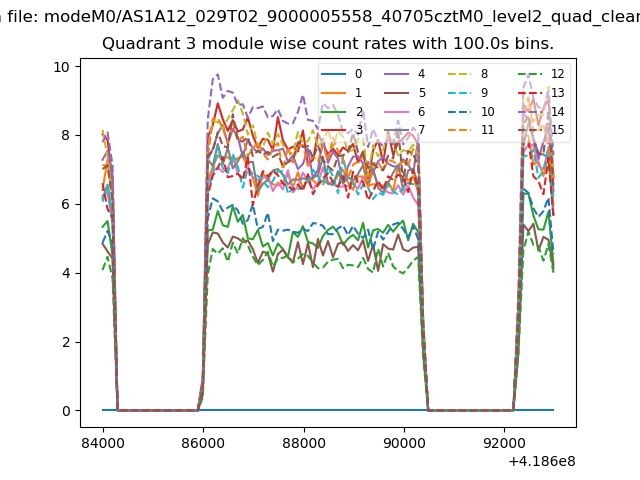
| Module-wise count rates for Quadrant A Data is divided into 100 sec bins |
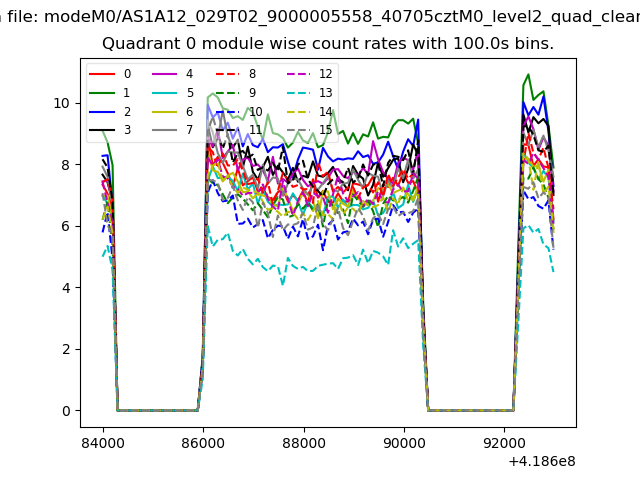 |
 |
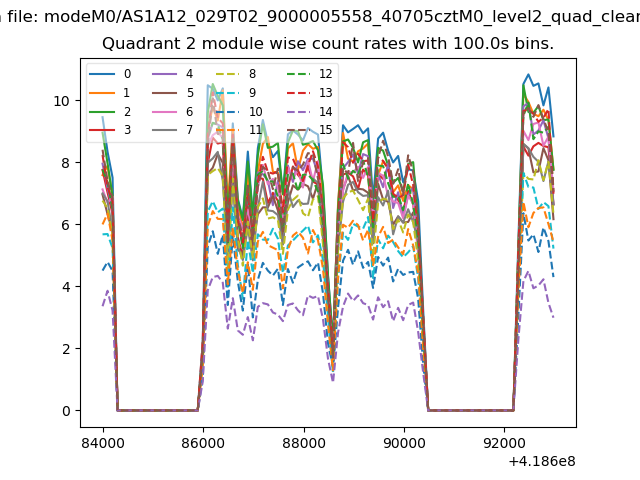
| Module-wise count rates for Quadrant B Data is divided into 100 sec bins |
 |
 |
| Module-wise count rates for Quadrant C Data is divided into 100 sec bins |
 |
 |
| Module-wise count rates for Quadrant D Data is divided into 100 sec bins |
 |
 |
| Parameter | Plot |
|---|---|
| CZT HV Monitor | 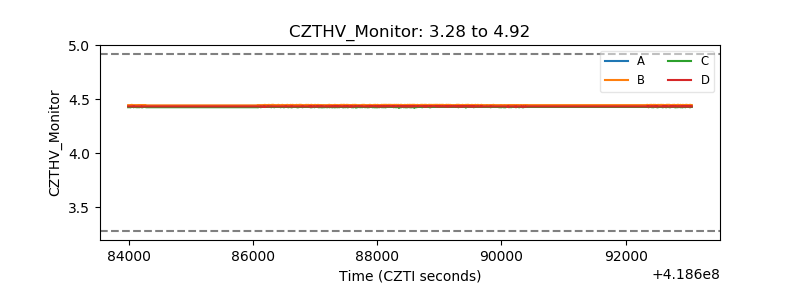 |
| D_VDD | 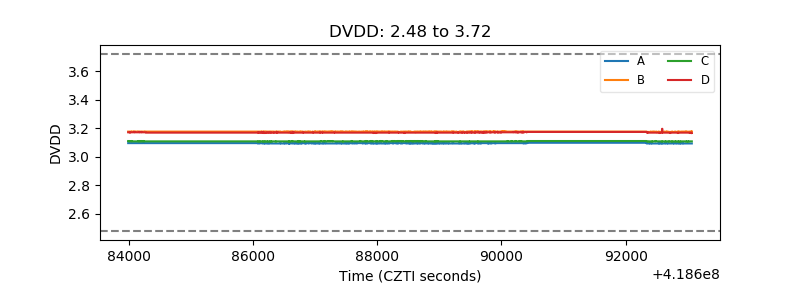 |
| Temperature 1 | 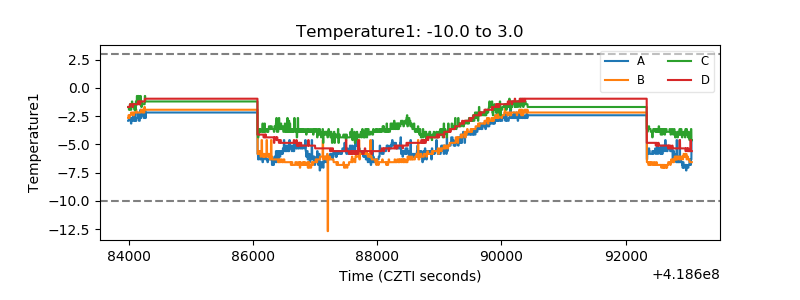 |
| Veto HV Monitor | 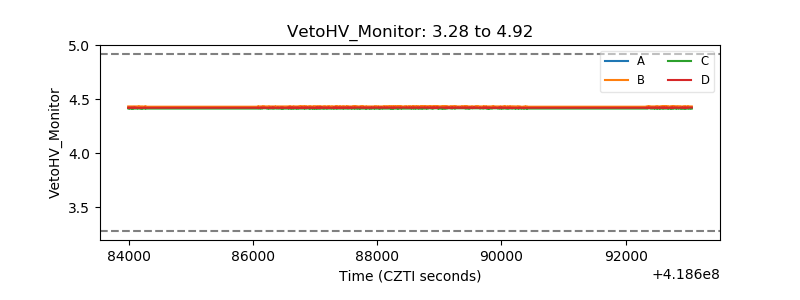 |
| Veto LLD | 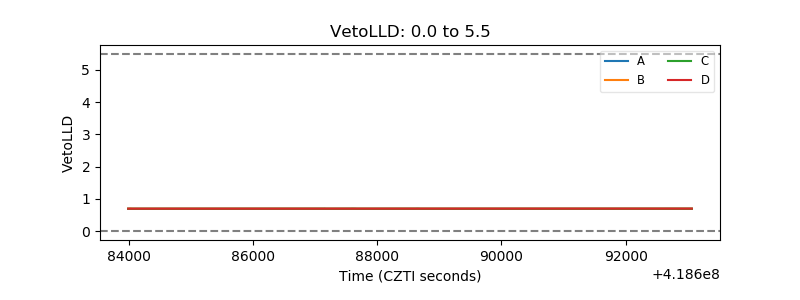 |
| Alpha Counter | 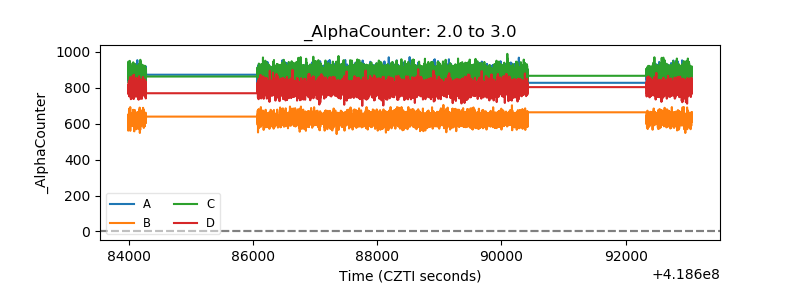 |
| _CPM_Rate | 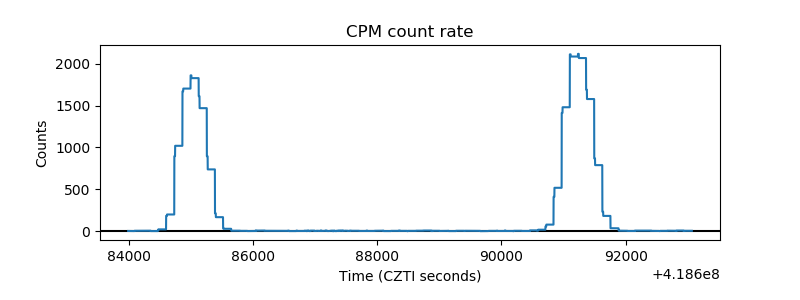 |
| CZT Counter | 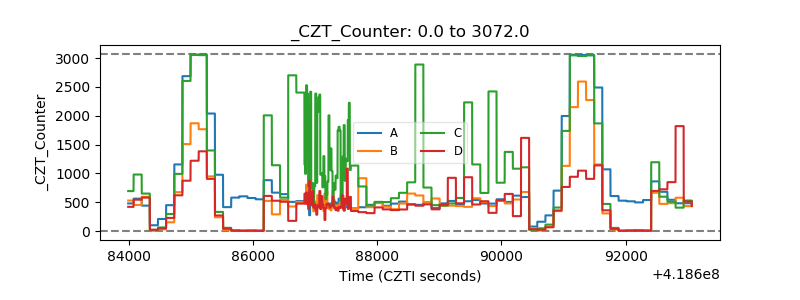 |
| +2.5 Volts monitor | 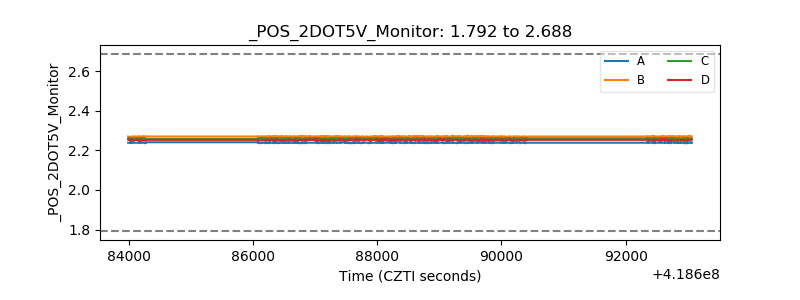 |
| +5 Volts monitor | 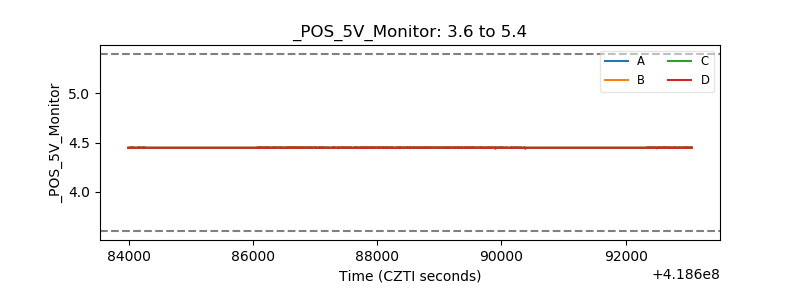 |
| _ROLL_ROT | 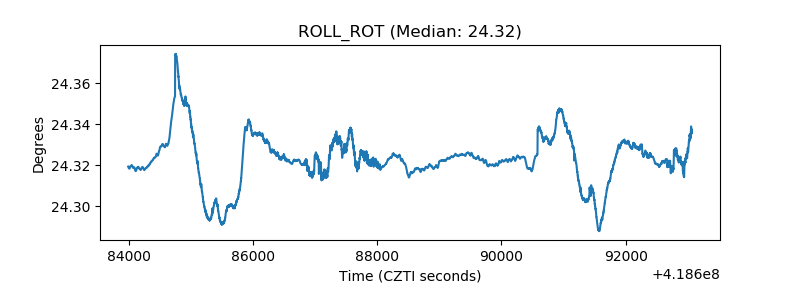 |
| _Roll_DEC | 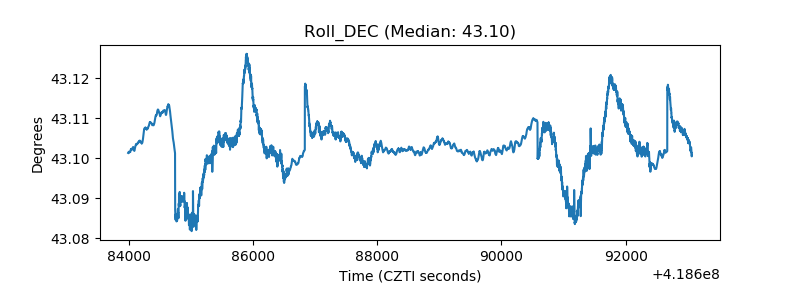 |
| _Roll_RA | 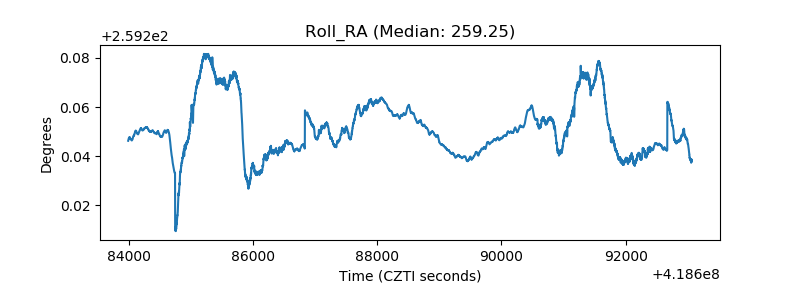 |
| Veto Counter | 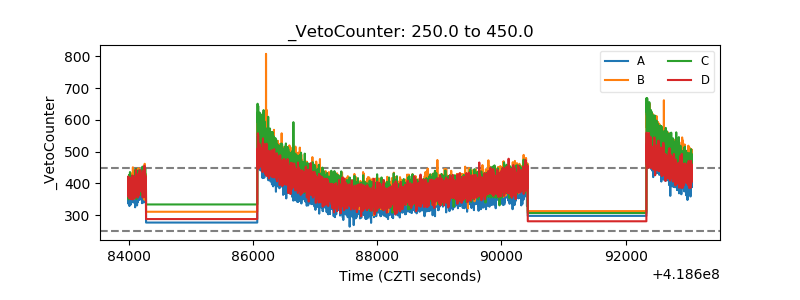 |