| Param | Original file | Final file |
|---|---|---|
| Filename | modeM0/AS1A12_029T02_9000005558_40706cztM0_level2.fits | modeM0/AS1A12_029T02_9000005558_40706cztM0_level2_quad_clean.evt |
| Size (bytes) | 313,116,480 | 89,740,800 |
| Size | 298.6 MB | 85.6 MB |
| Events in quadrant A | 2,863,595 | 607,840 |
| Events in quadrant B | 2,677,191 | 636,200 |
| Events in quadrant C | 2,926,694 | 606,640 |
| Events in quadrant D | 2,729,768 | 512,932 |
| Mode M0 | |||
|---|---|---|---|
| Quadrant | BADHDUFLAG | Total packets | Discarded packets |
| A | 0 | 11668 | 3 |
| B | 0 | 11250 | 2 |
| C | 0 | 11820 | 2 |
| D | 0 | 11632 | 2 |
| Mode M9 | |||
|---|---|---|---|
| Quadrant | BADHDUFLAG | Total packets | Discarded packets |
| A | 0 | 29 | 0 |
| B | 0 | 29 | 0 |
| C | 0 | 29 | 0 |
| D | 0 | 30 | 0 |
| Mode SS | |||
|---|---|---|---|
| Quadrant | BADHDUFLAG | Total packets | Discarded packets |
| A | 0 | 104 | 0 |
| B | 0 | 104 | 0 |
| C | 0 | 104 | 0 |
| D | 0 | 104 | 0 |
| Quadrant | Total seconds | Saturated seconds | Saturation percentage |
|---|---|---|---|
| A | 5044 | 25 | 0.495638% |
| B | 5044 | 39 | 0.773196% |
| C | 5044 | 35 | 0.693894% |
| D | 5044 | 343 | 6.800159% |
Noise dominated data is calculated using 1-second bins in cleaned event files. If a bin has >2000 counts, and if more than 50% of those come from <1% of pixels, then it is considered to be noise-dominated and hence unusable.
| Quadrant | # 1 sec bins | Bins with >0 counts | Bins with >2000 counts | High rate bins dominated by noise | Noise dominated (total time) | Noise dominated (detector-on time) | Marked lightcurve |
|---|---|---|---|---|---|---|---|
| A | 7077 | 5045 | 20 | 20 | 0.28% | 0.40% | 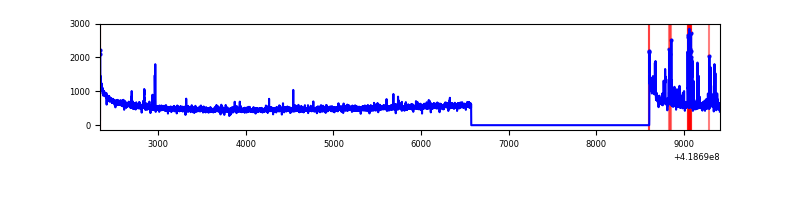 |
| B | 7077 | 5045 | 23 | 23 | 0.32% | 0.46% | 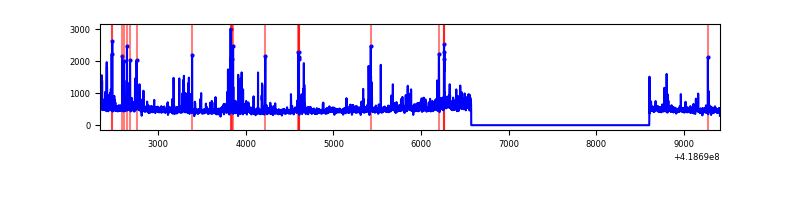 |
| C | 7077 | 5045 | 44 | 44 | 0.62% | 0.87% | 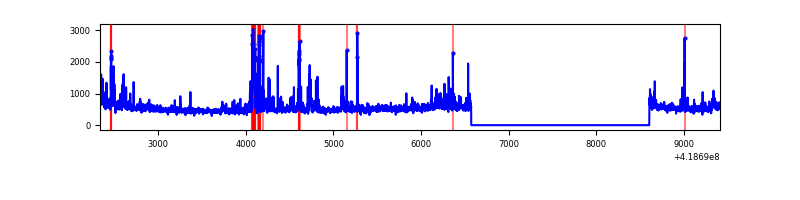 |
| D | 7077 | 5045 | 61 | 61 | 0.86% | 1.21% | 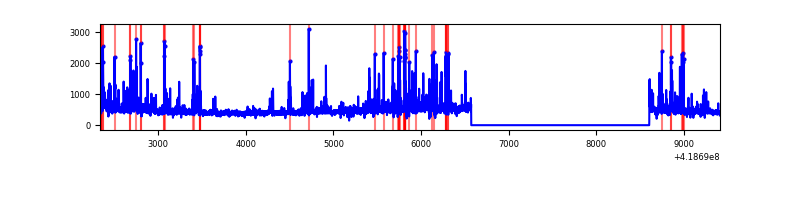 |
Top three noisy pixels from each quadrant. If the there are fewer than three noisy pixels in the level2.evt file, extra rows are filled as -1
| Pixel properties | Quadrant properties | ||||||
|---|---|---|---|---|---|---|---|
| Quadrant | DetID | PixID | Counts | Sigma | Mean | Median | Sigma |
| A | 10 | 83 | 462519 | 3948.56 | 573 | 562 | 117.0 |
| A | 2 | 79 | 177024 | 1508.3 | 573 | 562 | 117.0 |
| A | 3 | 137 | 6113 | 47.45 | 573 | 562 | 117.0 |
| B | 0 | 190 | 148143 | 1346.47 | 576 | 562 | 109.6 |
| B | 0 | 229 | 145353 | 1321.02 | 576 | 562 | 109.6 |
| B | 5 | 255 | 63120 | 570.76 | 576 | 562 | 109.6 |
| C | 9 | 187 | 487961 | 3733.98 | 564 | 567 | 130.5 |
| C | 15 | 214 | 218302 | 1668.09 | 564 | 567 | 130.5 |
| C | 14 | 254 | 12556 | 91.85 | 564 | 567 | 130.5 |
| D | 1 | 47 | 158661 | 1196.6 | 532 | 518 | 132.2 |
| D | 2 | 250 | 147929 | 1115.4 | 532 | 518 | 132.2 |
| D | 12 | 191 | 130182 | 981.11 | 532 | 518 | 132.2 |
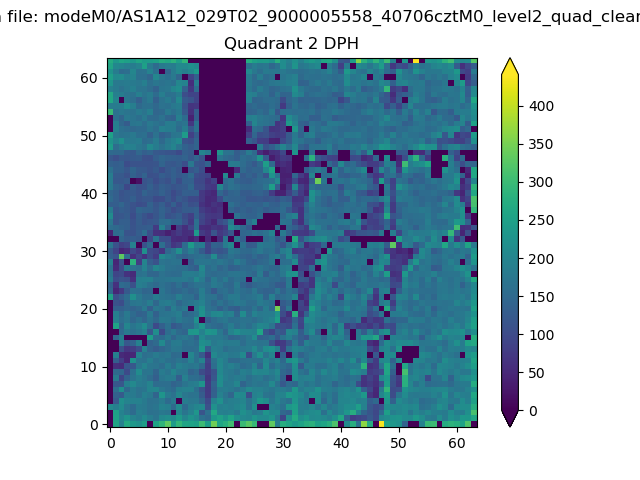
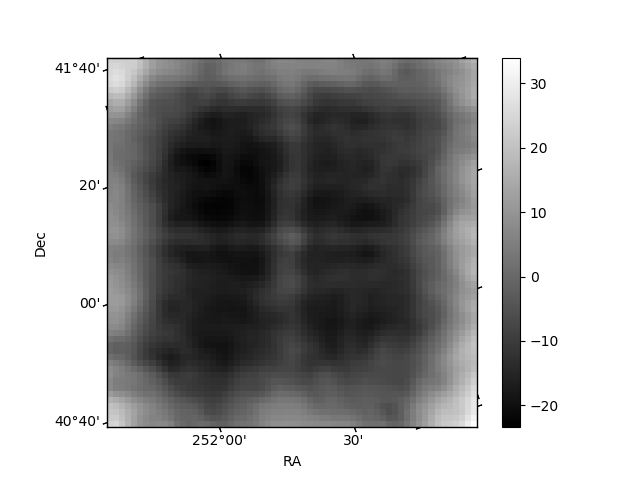
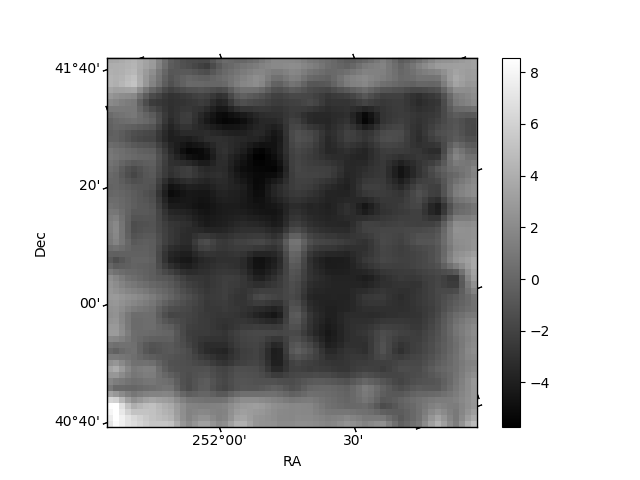
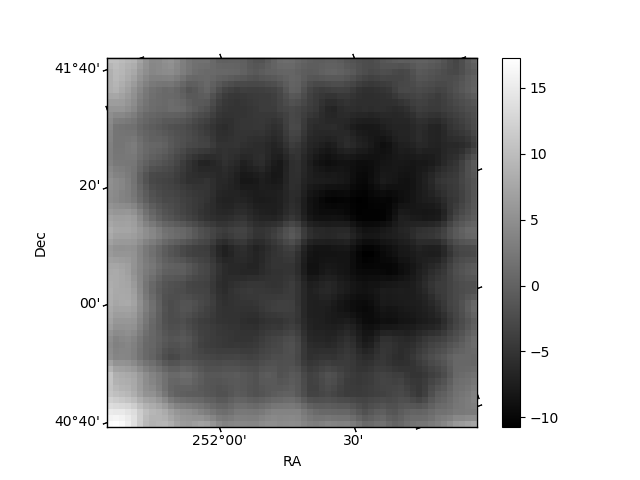
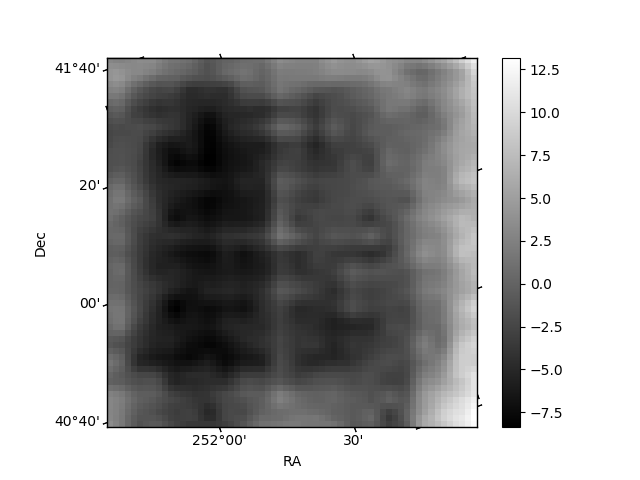
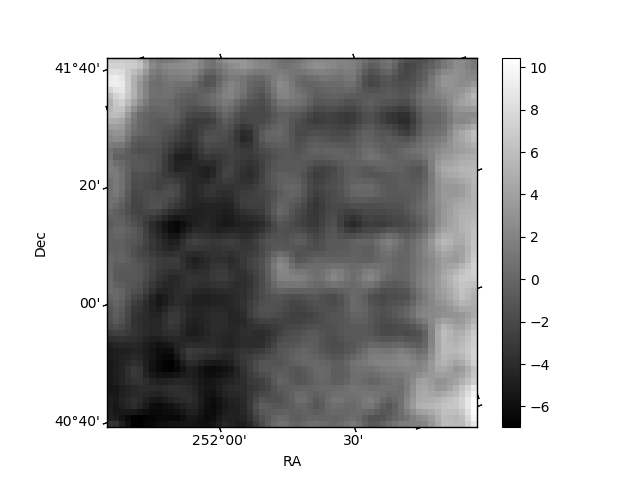
Histogram calculated using DETX and DETY for each event in the final _common_clean file
| Quadrant A | 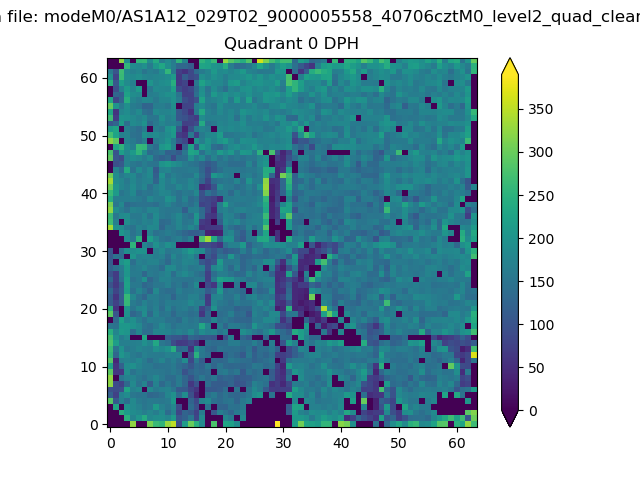 |
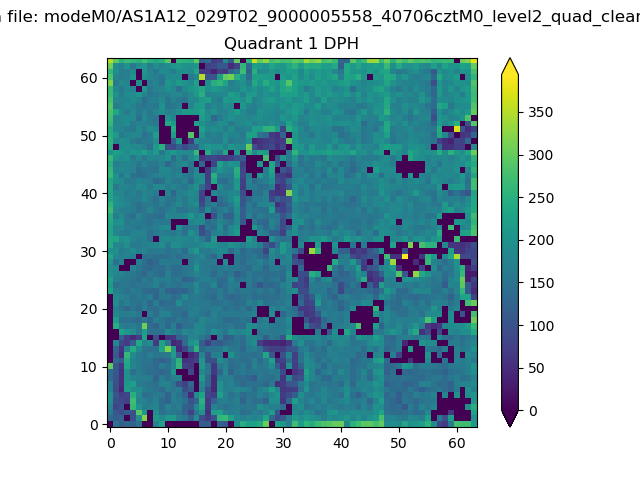 |
Quadrant B |
|---|---|---|---|
| Quadrant D | 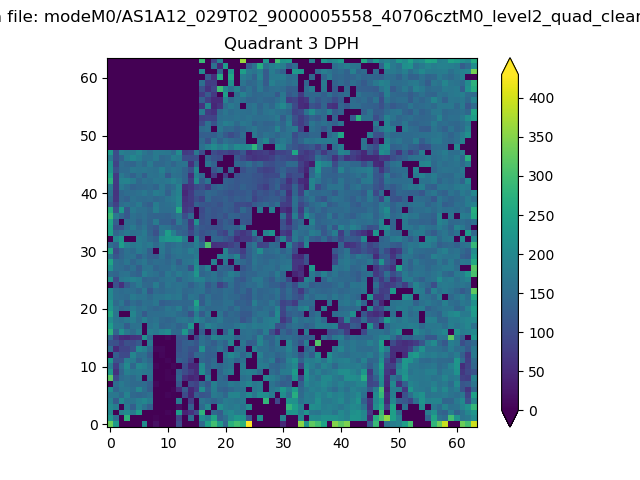 |
 |
Quadrant C |
| Plot type | Count rate plots | Images |
|---|---|---|
| Comparison with Poisson distribution Blue bars denote a histogram of data divided into 1 sec bins. Red curve is a Poisson curve with rate = median count rate of data. |
 |
 |
| Quadrant-wise count rates Data is divided into 100 sec bins |
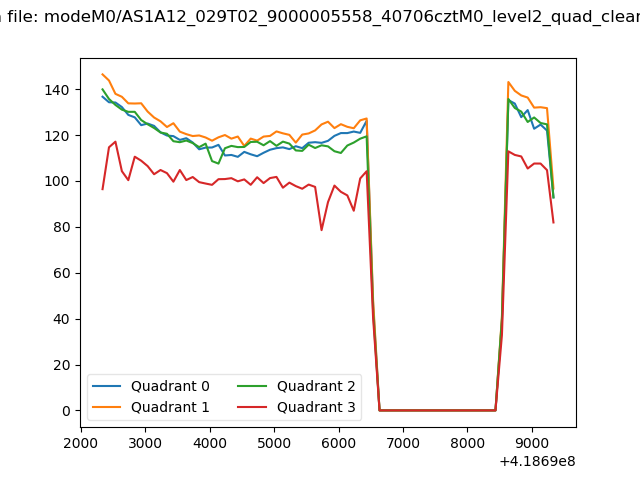 |
|
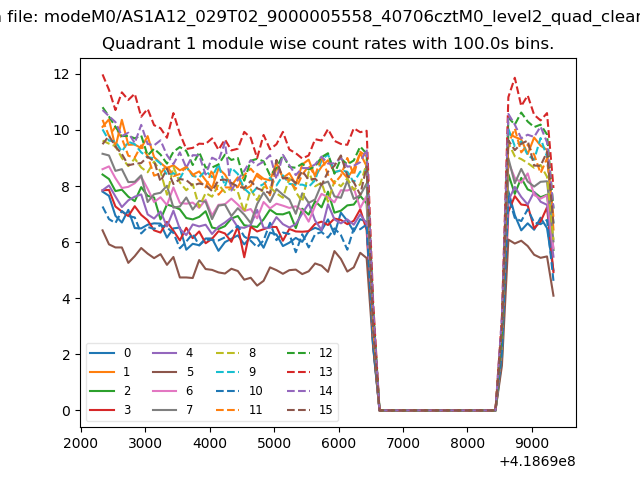
| Module-wise count rates for Quadrant A Data is divided into 100 sec bins |
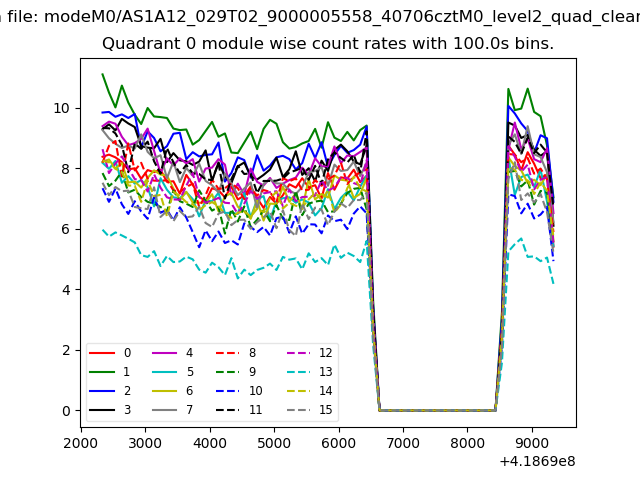 |
 |
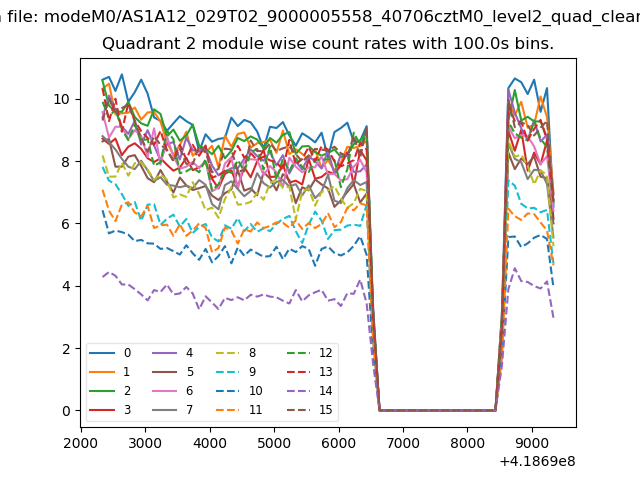
| Module-wise count rates for Quadrant B Data is divided into 100 sec bins |
 |
 |
| Module-wise count rates for Quadrant C Data is divided into 100 sec bins |
 |
 |
| Module-wise count rates for Quadrant D Data is divided into 100 sec bins |
 |
 |
| Parameter | Plot |
|---|---|
| CZT HV Monitor | 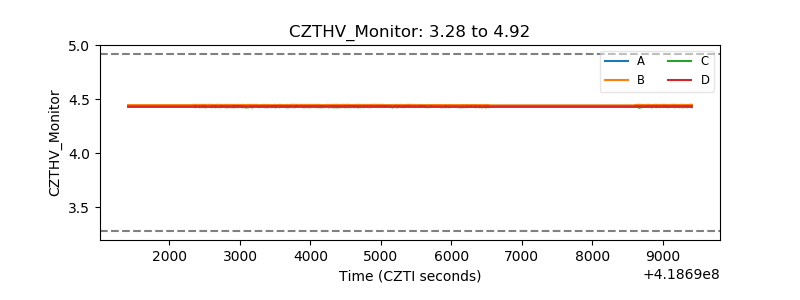 |
| D_VDD | 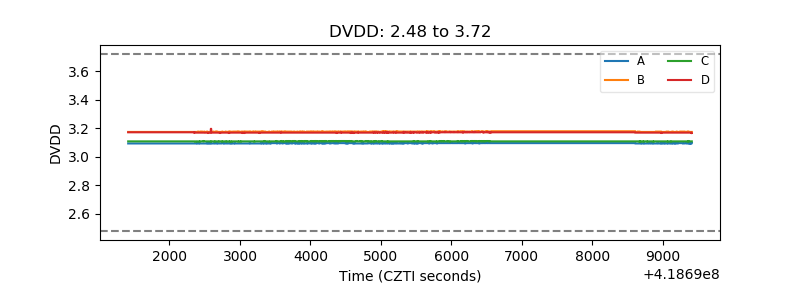 |
| Temperature 1 | 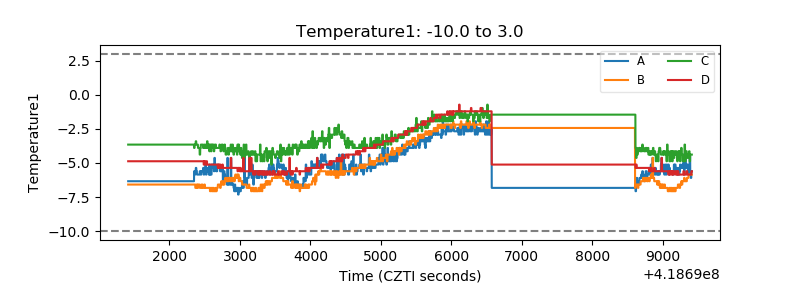 |
| Veto HV Monitor |  |
| Veto LLD | 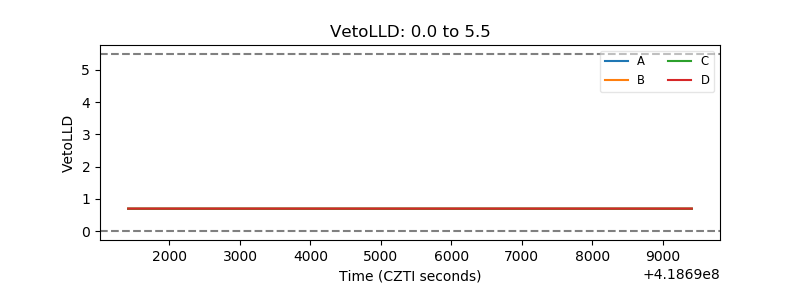 |
| Alpha Counter | 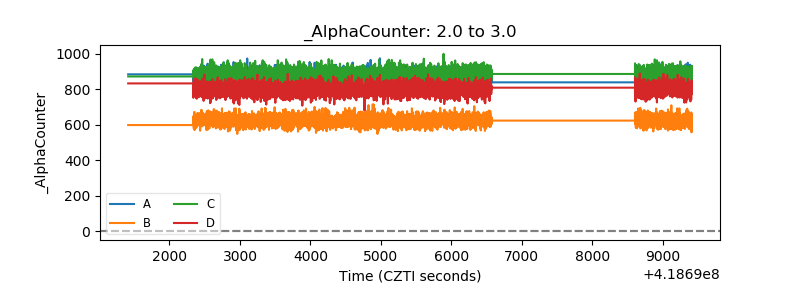 |
| _CPM_Rate | 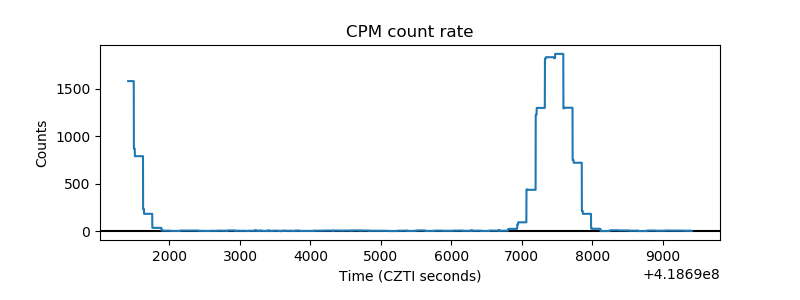 |
| CZT Counter | 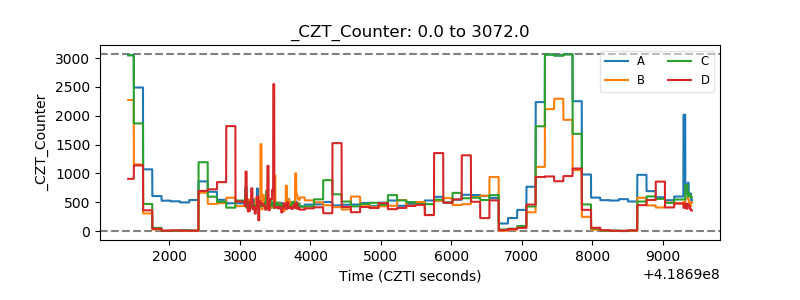 |
| +2.5 Volts monitor |  |
| +5 Volts monitor |  |
| _ROLL_ROT |  |
| _Roll_DEC | 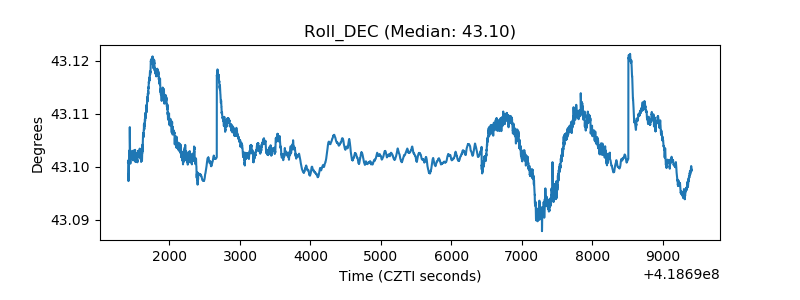 |
| _Roll_RA | 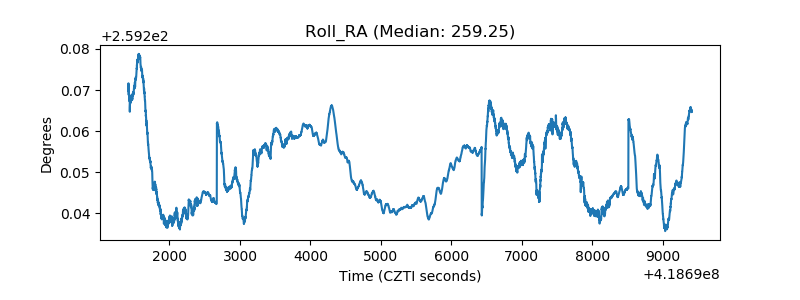 |
| Veto Counter | 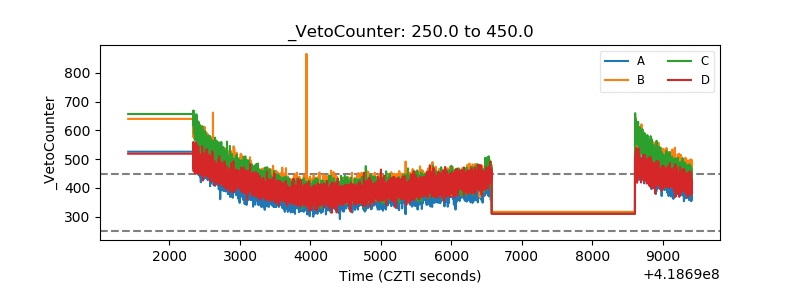 |