| Param | Original file | Final file |
|---|---|---|
| Filename | modeM0/AS1A12_029T02_9000005558_40708cztM0_level2.fits | modeM0/AS1A12_029T02_9000005558_40708cztM0_level2_quad_clean.evt |
| Size (bytes) | 255,263,040 | 65,508,480 |
| Size | 243.4 MB | 62.5 MB |
| Events in quadrant A | 2,150,751 | 446,010 |
| Events in quadrant B | 2,087,669 | 461,371 |
| Events in quadrant C | 2,783,731 | 414,300 |
| Events in quadrant D | 2,115,059 | 381,052 |
| Mode M0 | |||
|---|---|---|---|
| Quadrant | BADHDUFLAG | Total packets | Discarded packets |
| A | 0 | 10850 | 2022 |
| B | 0 | 11349 | 2508 |
| C | 0 | 13888 | 3084 |
| D | 0 | 11220 | 2128 |
| Mode M9 | |||
|---|---|---|---|
| Quadrant | BADHDUFLAG | Total packets | Discarded packets |
| A | 0 | 40 | 0 |
| B | 0 | 40 | 0 |
| C | 0 | 40 | 0 |
| D | 0 | 41 | 0 |
| Mode SS | |||
|---|---|---|---|
| Quadrant | BADHDUFLAG | Total packets | Discarded packets |
| A | 0 | 101 | 21 |
| B | 0 | 102 | 16 |
| C | 0 | 100 | 22 |
| D | 0 | 98 | 19 |
| Quadrant | Total seconds | Saturated seconds | Saturation percentage |
|---|---|---|---|
| A | 4010 | 6 | 0.149626% |
| B | 3990 | 50 | 1.253133% |
| C | 3883 | 179 | 4.609838% |
| D | 4028 | 268 | 6.653426% |
Noise dominated data is calculated using 1-second bins in cleaned event files. If a bin has >2000 counts, and if more than 50% of those come from <1% of pixels, then it is considered to be noise-dominated and hence unusable.
| Quadrant | # 1 sec bins | Bins with >0 counts | Bins with >2000 counts | High rate bins dominated by noise | Noise dominated (total time) | Noise dominated (detector-on time) | Marked lightcurve |
|---|---|---|---|---|---|---|---|
| A | 7278 | 4339 | 3 | 3 | 0.04% | 0.07% | 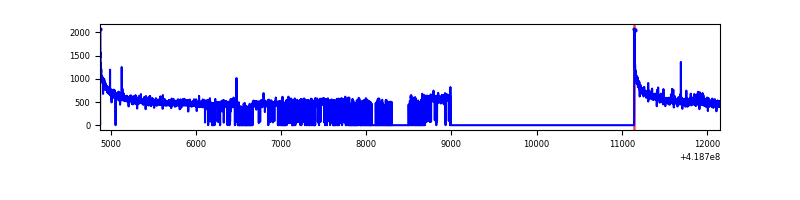 |
| B | 7278 | 4294 | 34 | 34 | 0.47% | 0.79% | 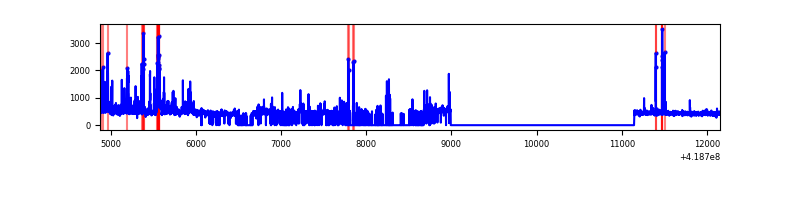 |
| C | 7277 | 4203 | 198 | 198 | 2.72% | 4.71% | 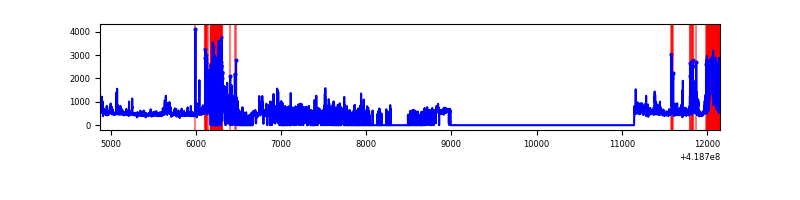 |
| D | 7278 | 4339 | 36 | 36 | 0.49% | 0.83% | 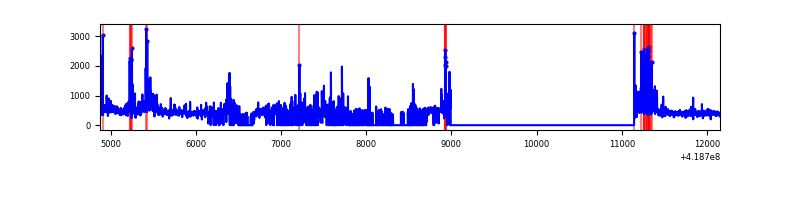 |
Top three noisy pixels from each quadrant. If the there are fewer than three noisy pixels in the level2.evt file, extra rows are filled as -1
| Pixel properties | Quadrant properties | ||||||
|---|---|---|---|---|---|---|---|
| Quadrant | DetID | PixID | Counts | Sigma | Mean | Median | Sigma |
| A | 10 | 83 | 411692 | 4528.4 | 442 | 435 | 90.8 |
| A | 2 | 79 | 16044 | 171.87 | 442 | 435 | 90.8 |
| A | 13 | 248 | 7061 | 72.96 | 442 | 435 | 90.8 |
| B | 0 | 190 | 108531 | 1263.57 | 440 | 428 | 85.6 |
| B | 5 | 255 | 102802 | 1196.61 | 440 | 428 | 85.6 |
| B | 0 | 229 | 100319 | 1167.59 | 440 | 428 | 85.6 |
| C | 9 | 187 | 884183 | 9212.29 | 408 | 411 | 95.9 |
| C | 15 | 214 | 169347 | 1760.96 | 408 | 411 | 95.9 |
| C | 12 | 249 | 134109 | 1393.65 | 408 | 411 | 95.9 |
| D | 2 | 249 | 180396 | 1754.65 | 412 | 401 | 102.6 |
| D | 12 | 191 | 102372 | 994.04 | 412 | 401 | 102.6 |
| D | 13 | 249 | 69541 | 674.0 | 412 | 401 | 102.6 |
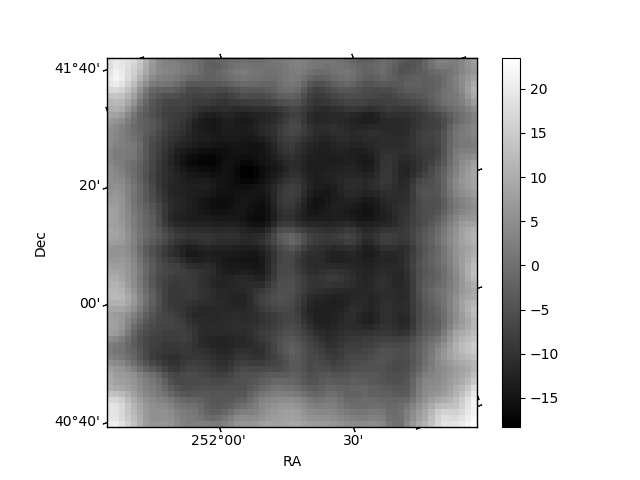
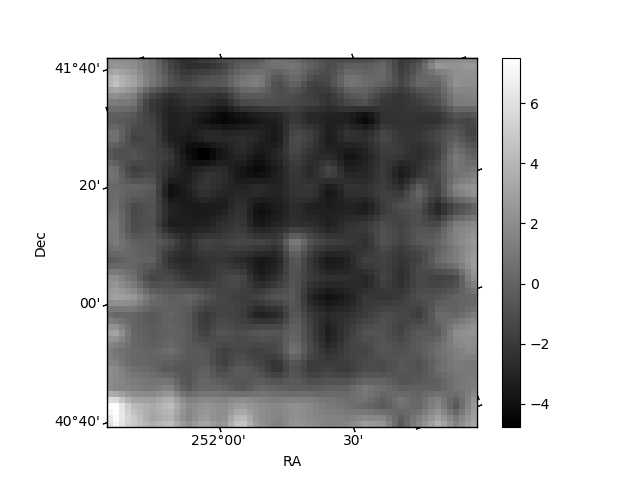
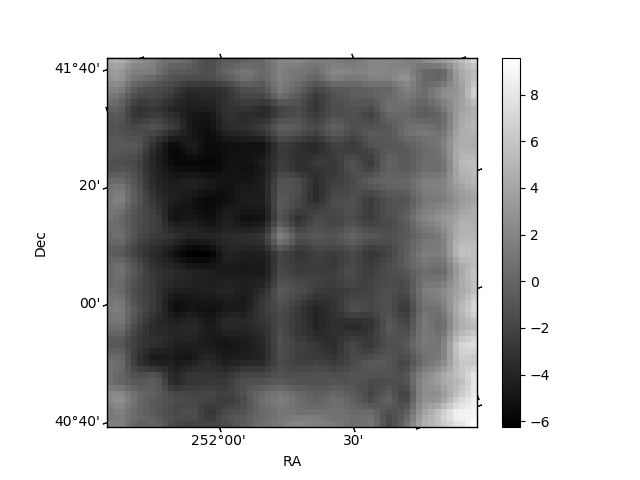
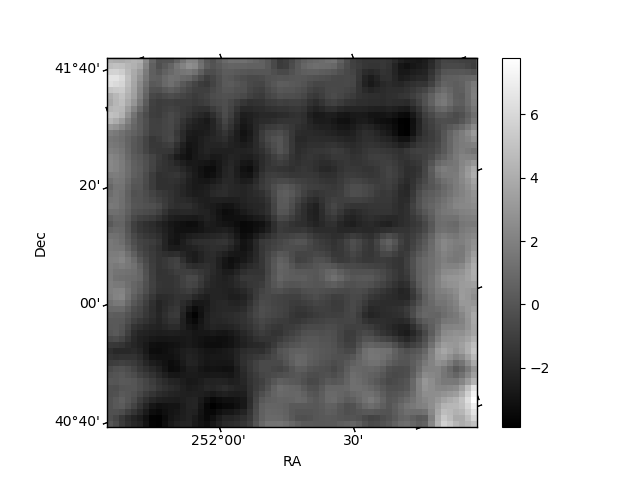
Histogram calculated using DETX and DETY for each event in the final _common_clean file
| Quadrant A | 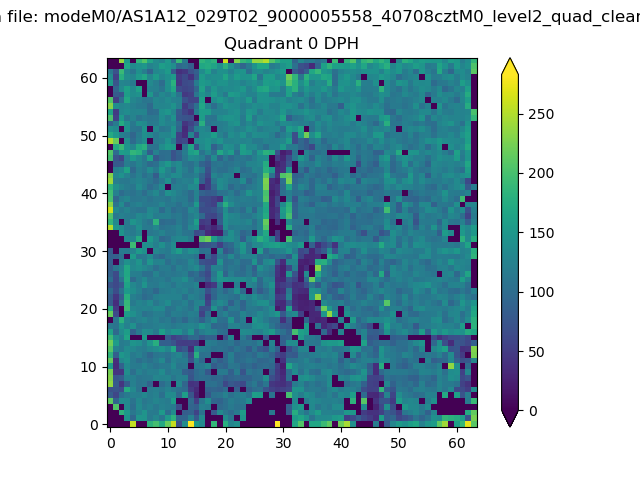 |
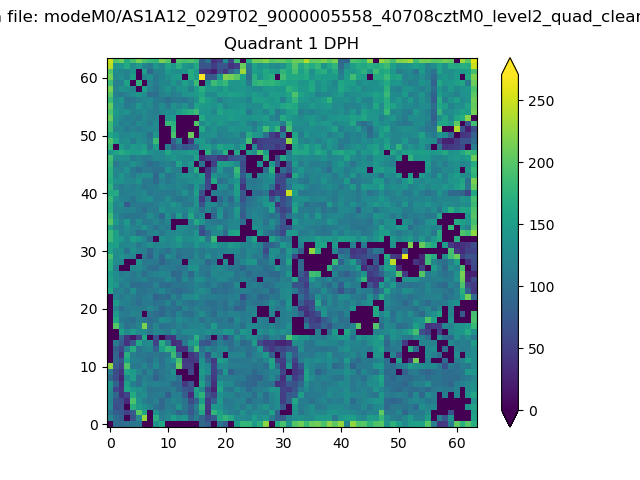 |
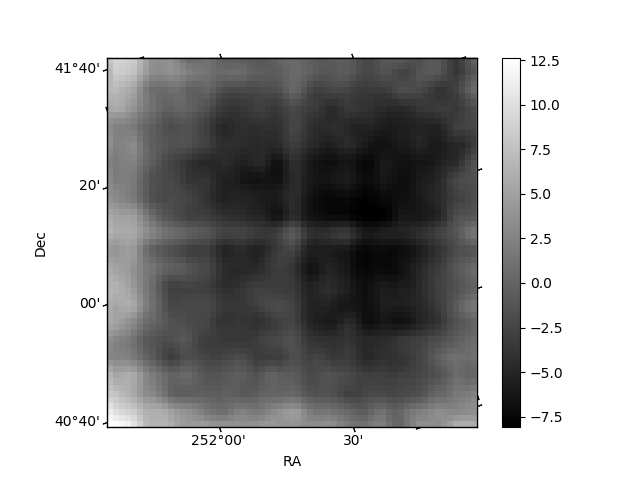
Quadrant B |
|---|---|---|---|
| Quadrant D | 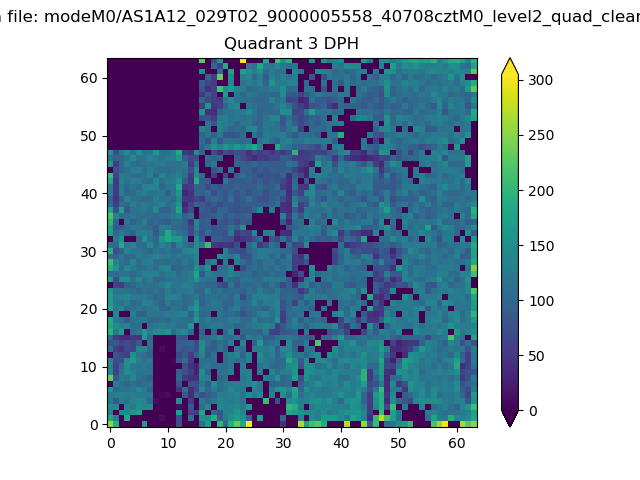 |
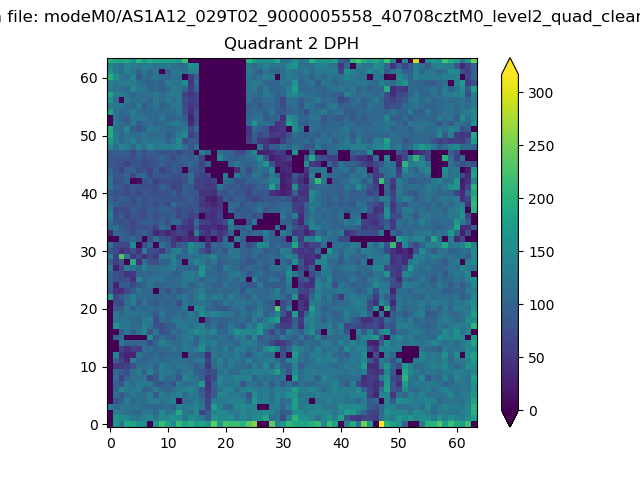 |
Quadrant C |
| Plot type | Count rate plots | Images |
|---|---|---|
| Comparison with Poisson distribution Blue bars denote a histogram of data divided into 1 sec bins. Red curve is a Poisson curve with rate = median count rate of data. |
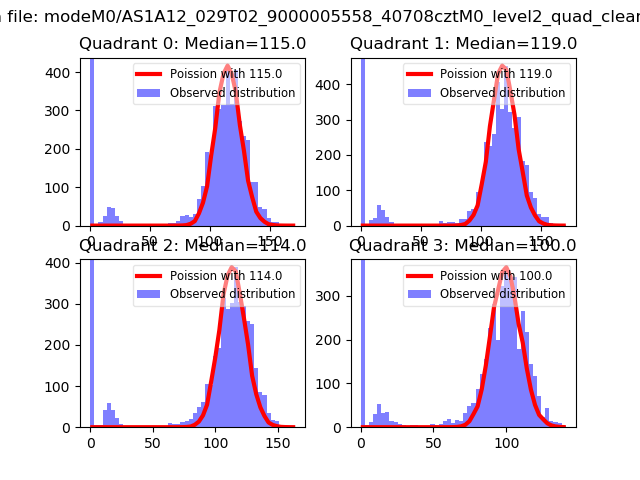 |
 |
| Quadrant-wise count rates Data is divided into 100 sec bins |
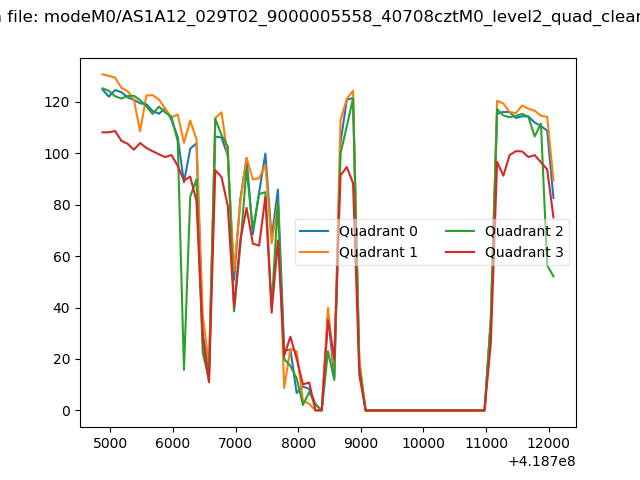 |
|
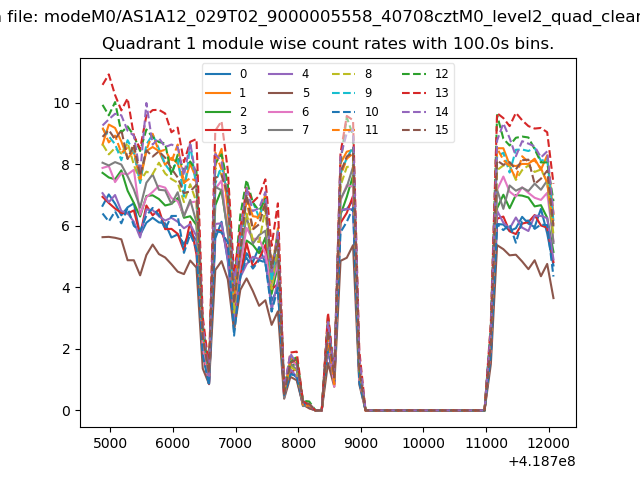
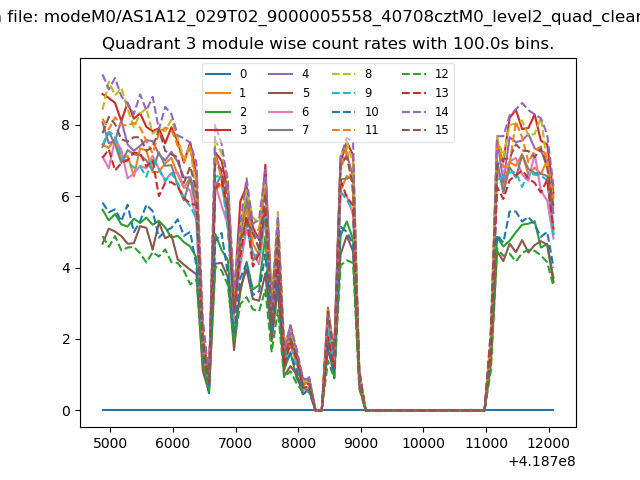
| Module-wise count rates for Quadrant A Data is divided into 100 sec bins |
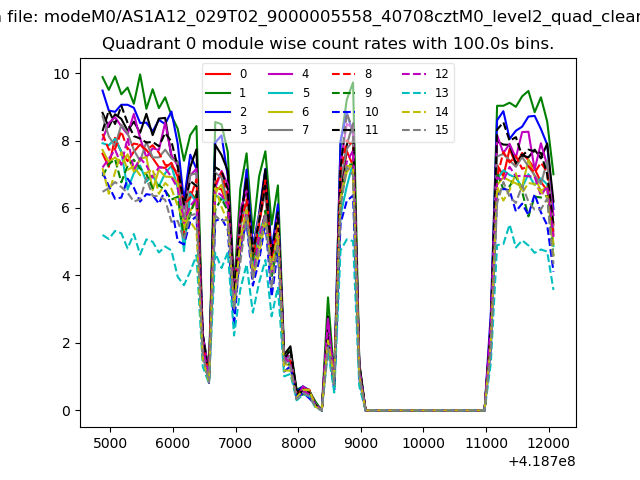 |
 |
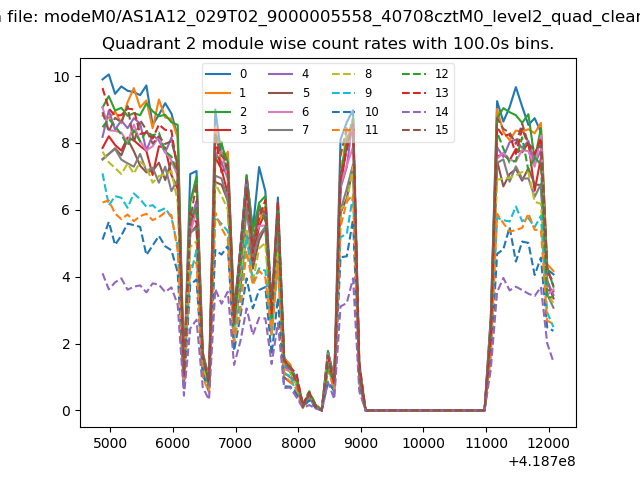
| Module-wise count rates for Quadrant B Data is divided into 100 sec bins |
 |
 |
| Module-wise count rates for Quadrant C Data is divided into 100 sec bins |
 |
 |
| Module-wise count rates for Quadrant D Data is divided into 100 sec bins |
 |
 |
| Parameter | Plot |
|---|---|
| CZT HV Monitor | 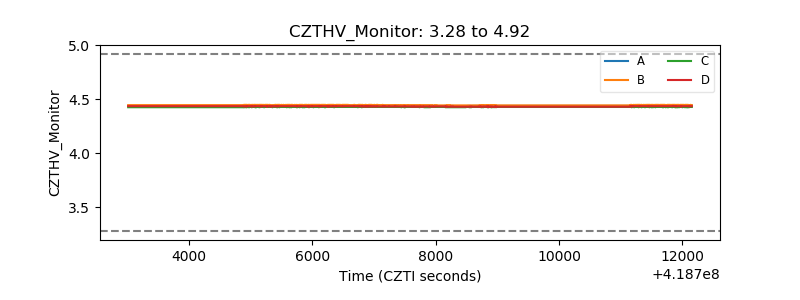 |
| D_VDD | 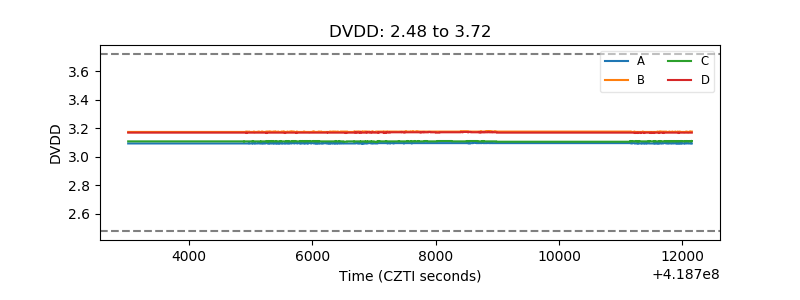 |
| Temperature 1 | 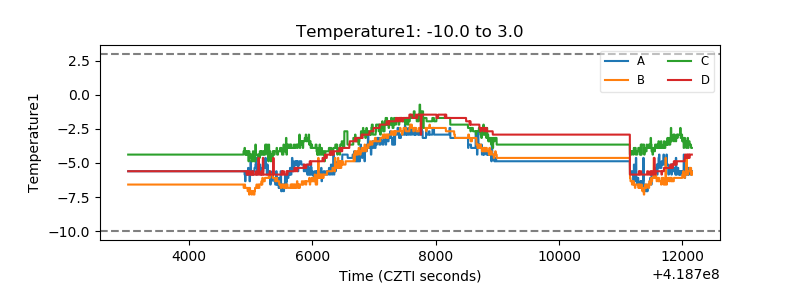 |
| Veto HV Monitor | 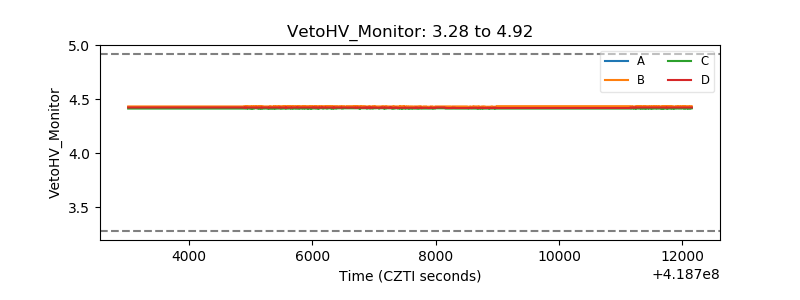 |
| Veto LLD | 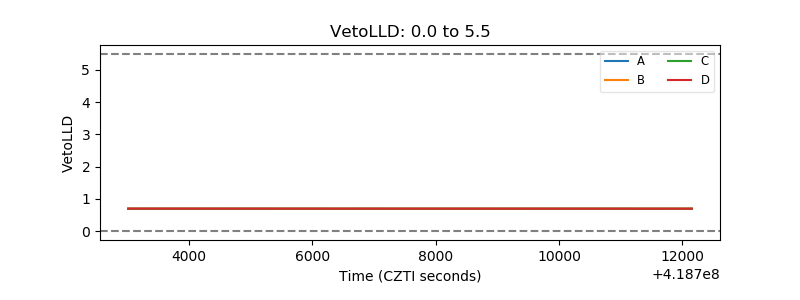 |
| Alpha Counter | 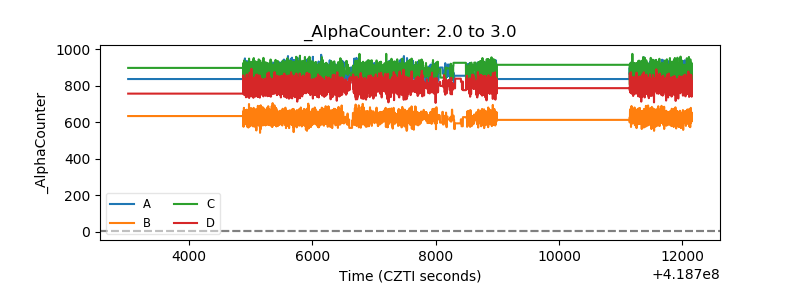 |
| _CPM_Rate | 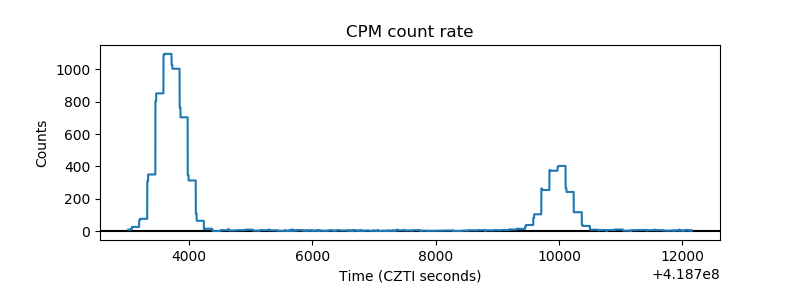 |
| CZT Counter | 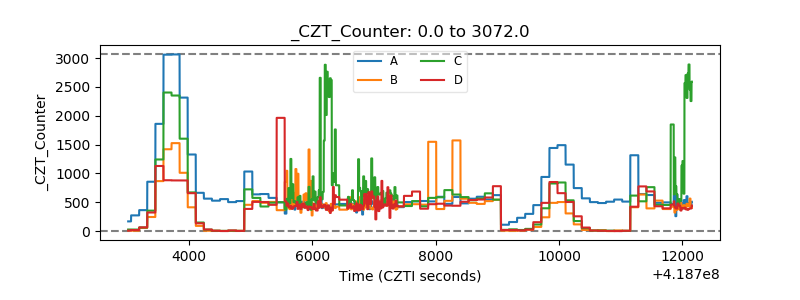 |
| +2.5 Volts monitor |  |
| +5 Volts monitor |  |
| _ROLL_ROT | 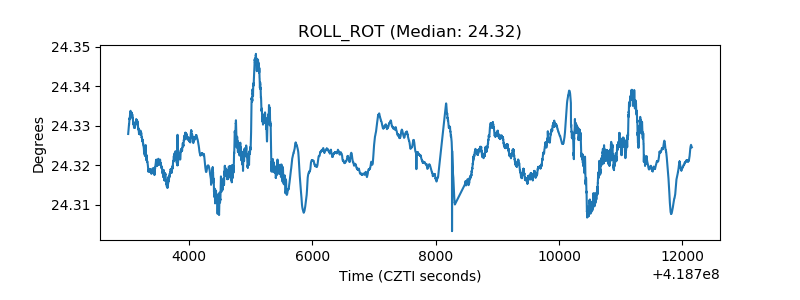 |
| _Roll_DEC | 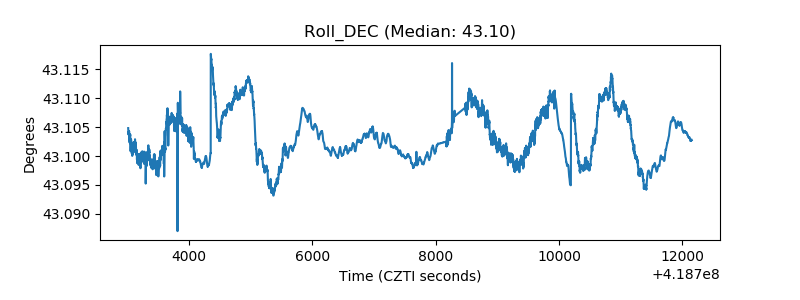 |
| _Roll_RA | 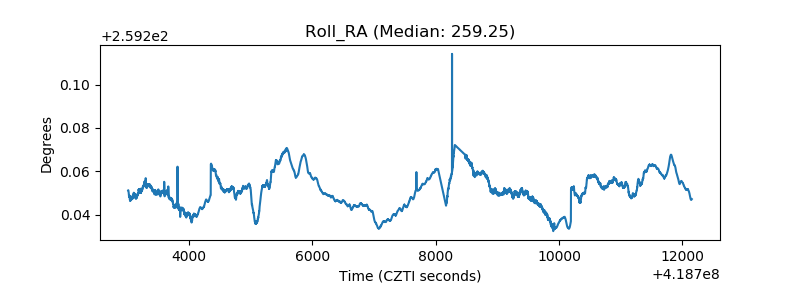 |
| Veto Counter | 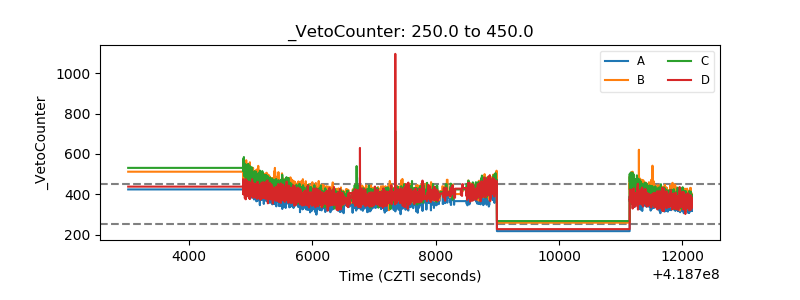 |