| Param | Original file | Final file |
|---|---|---|
| Filename | modeM0/AS1A12_029T02_9000005558_40709cztM0_level2.fits | modeM0/AS1A12_029T02_9000005558_40709cztM0_level2_quad_clean.evt |
| Size (bytes) | 299,358,720 | 70,545,600 |
| Size | 285.5 MB | 67.3 MB |
| Events in quadrant A | 2,385,772 | 484,981 |
| Events in quadrant B | 2,104,808 | 502,633 |
| Events in quadrant C | 4,005,204 | 418,453 |
| Events in quadrant D | 2,239,930 | 417,973 |
| Mode M0 | |||
|---|---|---|---|
| Quadrant | BADHDUFLAG | Total packets | Discarded packets |
| A | 0 | 11381 | 1617 |
| B | 0 | 10686 | 1403 |
| C | 0 | 17550 | 2810 |
| D | 0 | 11167 | 1310 |
| Mode M9 | |||
|---|---|---|---|
| Quadrant | BADHDUFLAG | Total packets | Discarded packets |
| A | 0 | 22 | 15 |
| B | 0 | 24 | 17 |
| C | 0 | 23 | 16 |
| D | 0 | 24 | 15 |
| Mode SS | |||
|---|---|---|---|
| Quadrant | BADHDUFLAG | Total packets | Discarded packets |
| A | 0 | 103 | 11 |
| B | 0 | 104 | 12 |
| C | 0 | 103 | 9 |
| D | 0 | 104 | 14 |
| Quadrant | Total seconds | Saturated seconds | Saturation percentage |
|---|---|---|---|
| A | 4420 | 8 | 0.180995% |
| B | 4443 | 19 | 0.427639% |
| C | 4335 | 521 | 12.018454% |
| D | 4482 | 273 | 6.091031% |
Noise dominated data is calculated using 1-second bins in cleaned event files. If a bin has >2000 counts, and if more than 50% of those come from <1% of pixels, then it is considered to be noise-dominated and hence unusable.
| Quadrant | # 1 sec bins | Bins with >0 counts | Bins with >2000 counts | High rate bins dominated by noise | Noise dominated (total time) | Noise dominated (detector-on time) | Marked lightcurve |
|---|---|---|---|---|---|---|---|
| A | 7143 | 4555 | 7 | 7 | 0.10% | 0.15% | 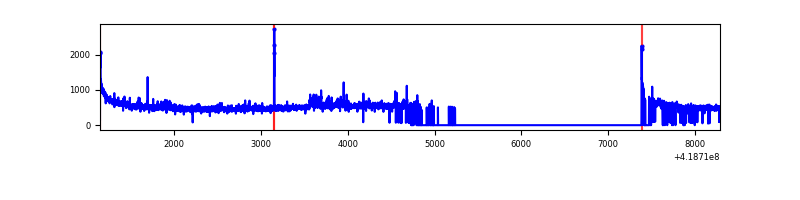 |
| B | 7144 | 4564 | 8 | 8 | 0.11% | 0.18% | 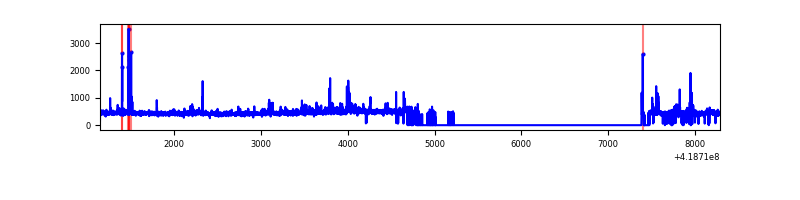 |
| C | 7143 | 4470 | 541 | 541 | 7.57% | 12.10% | 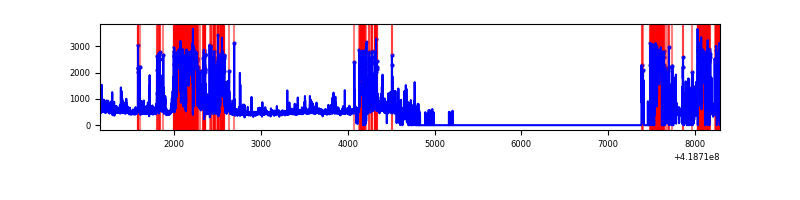 |
| D | 7144 | 4596 | 47 | 47 | 0.66% | 1.02% | 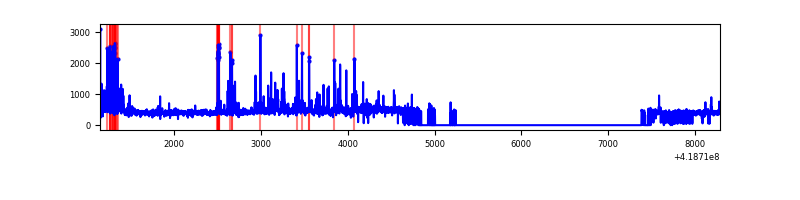 |
Top three noisy pixels from each quadrant. If the there are fewer than three noisy pixels in the level2.evt file, extra rows are filled as -1
| Pixel properties | Quadrant properties | ||||||
|---|---|---|---|---|---|---|---|
| Quadrant | DetID | PixID | Counts | Sigma | Mean | Median | Sigma |
| A | 10 | 83 | 409525 | 4073.25 | 486 | 476 | 100.4 |
| A | 2 | 79 | 73307 | 725.24 | 486 | 476 | 100.4 |
| A | 15 | 174 | 14017 | 134.84 | 486 | 476 | 100.4 |
| B | 0 | 190 | 74462 | 785.53 | 484 | 472 | 94.2 |
| B | 5 | 255 | 73482 | 775.12 | 484 | 472 | 94.2 |
| B | 3 | 112 | 21785 | 226.27 | 484 | 472 | 94.2 |
| C | 9 | 187 | 2119782 | 20957.01 | 431 | 433 | 101.1 |
| C | 15 | 214 | 178673 | 1762.51 | 431 | 433 | 101.1 |
| C | 14 | 254 | 11354 | 107.99 | 431 | 433 | 101.1 |
| D | 2 | 249 | 192826 | 1713.53 | 456 | 444 | 112.3 |
| D | 12 | 191 | 110158 | 977.21 | 456 | 444 | 112.3 |
| D | 2 | 250 | 95711 | 848.53 | 456 | 444 | 112.3 |
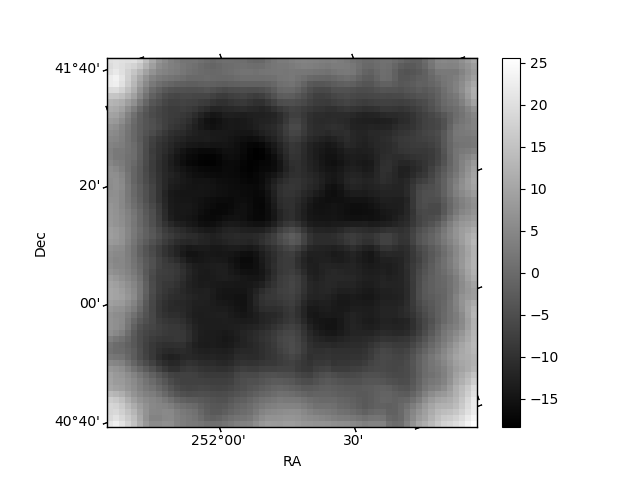
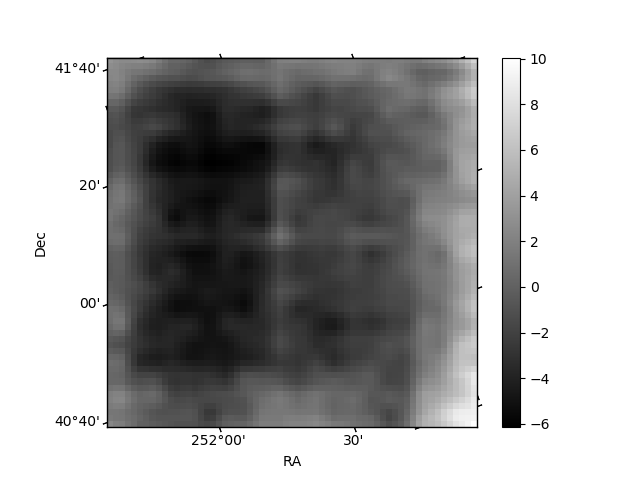
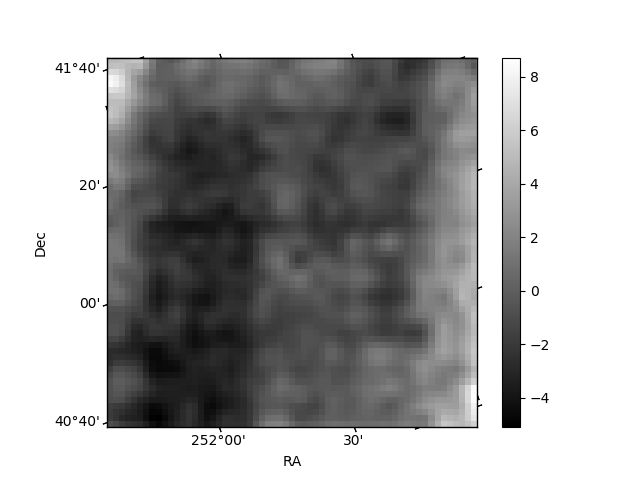
Histogram calculated using DETX and DETY for each event in the final _common_clean file
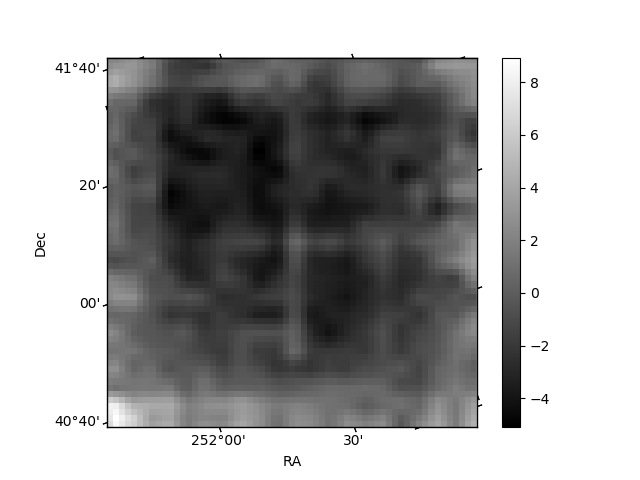
| Quadrant A | 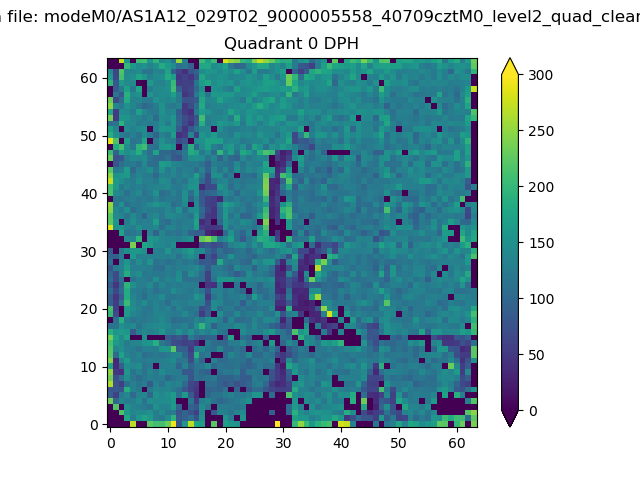 |
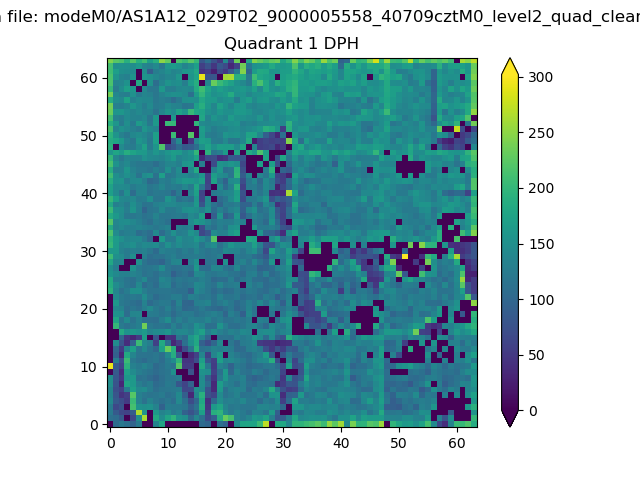 |
Quadrant B |
|---|---|---|---|
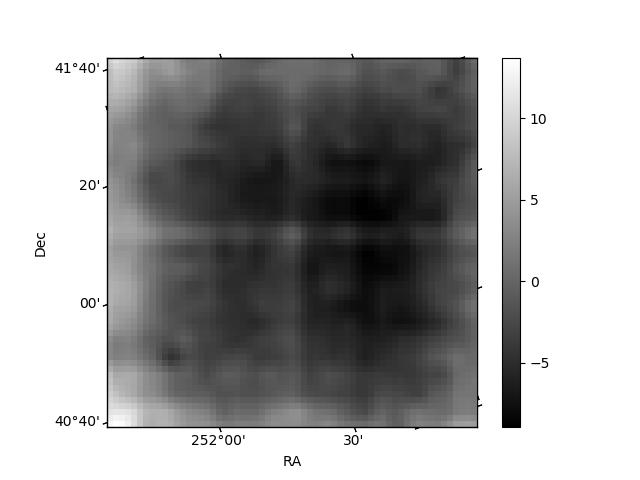
| Quadrant D | 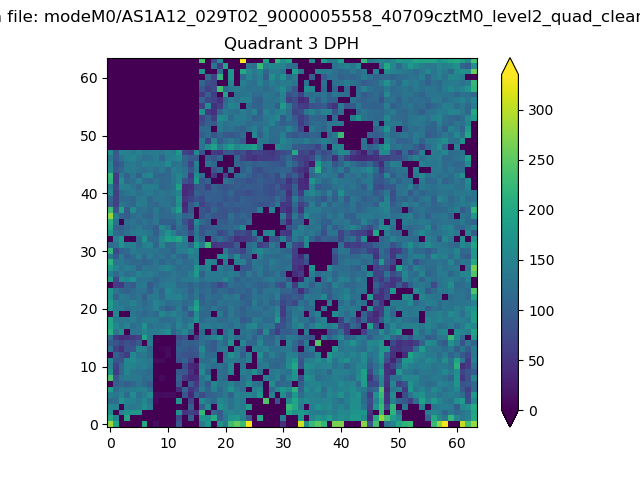 |
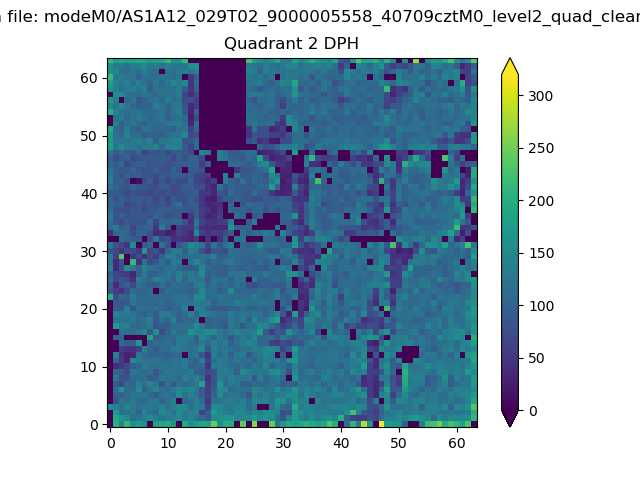 |
Quadrant C |
| Plot type | Count rate plots | Images |
|---|---|---|
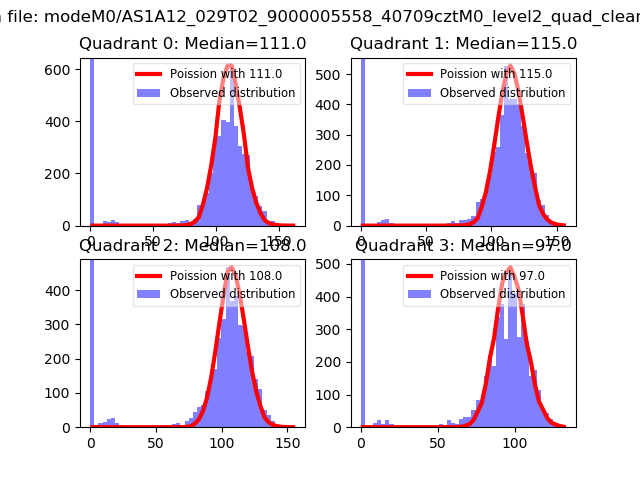
| Comparison with Poisson distribution Blue bars denote a histogram of data divided into 1 sec bins. Red curve is a Poisson curve with rate = median count rate of data. |
 |
 |
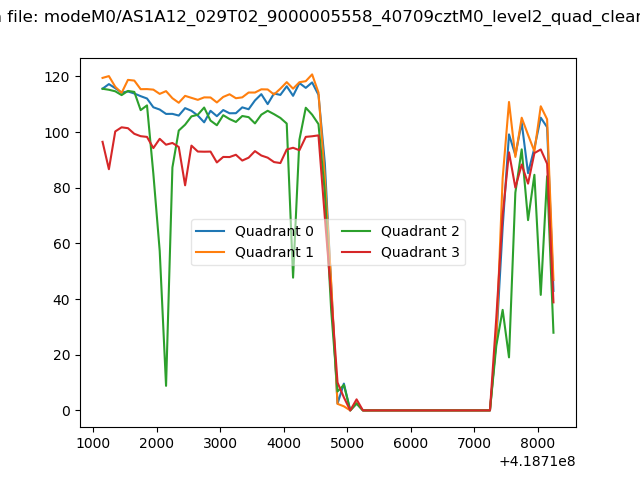
| Quadrant-wise count rates Data is divided into 100 sec bins |
 |
|
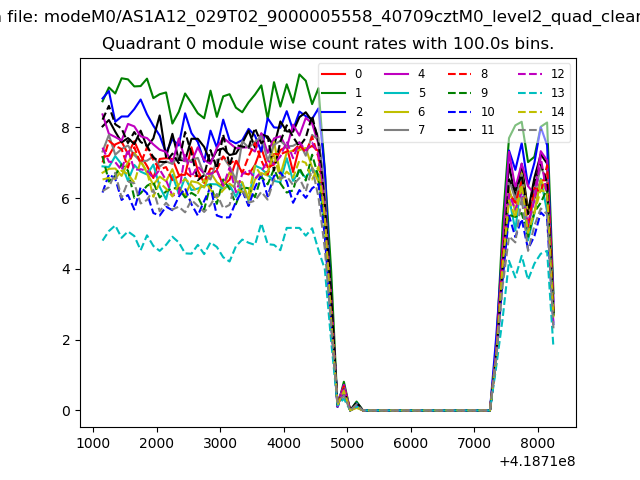
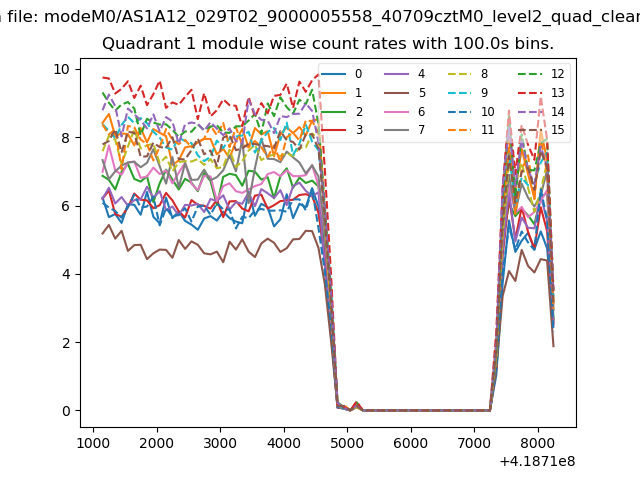
| Module-wise count rates for Quadrant A Data is divided into 100 sec bins |
 |
 |
| Module-wise count rates for Quadrant B Data is divided into 100 sec bins |
 |
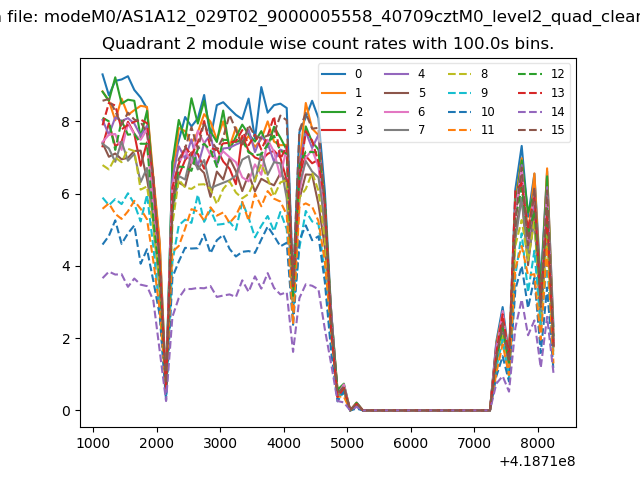
 |
| Module-wise count rates for Quadrant C Data is divided into 100 sec bins |
 |
 |
| Module-wise count rates for Quadrant D Data is divided into 100 sec bins |
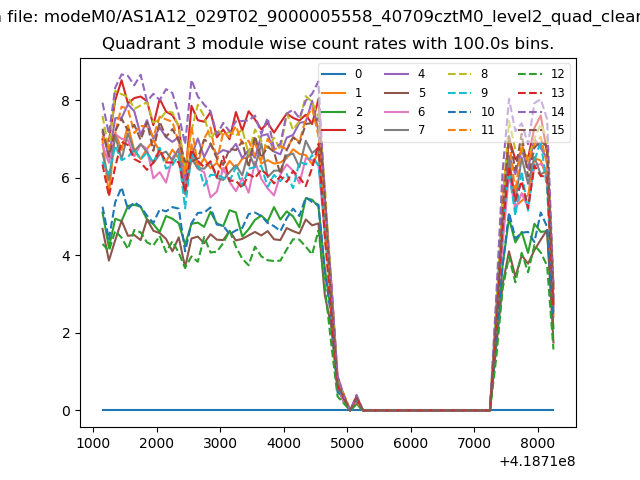 |
 |
| Parameter | Plot |
|---|---|
| CZT HV Monitor | 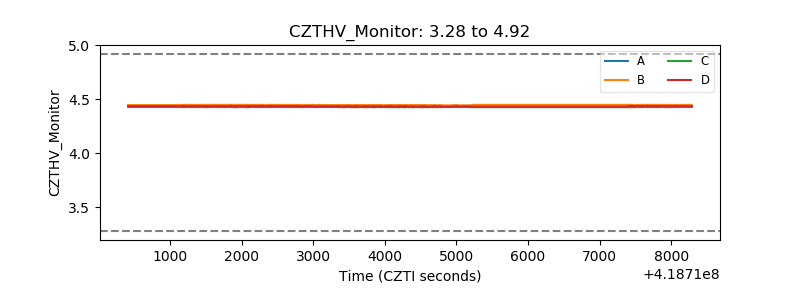 |
| D_VDD | 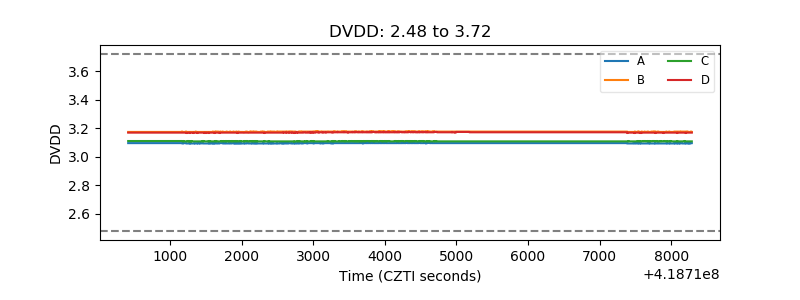 |
| Temperature 1 | 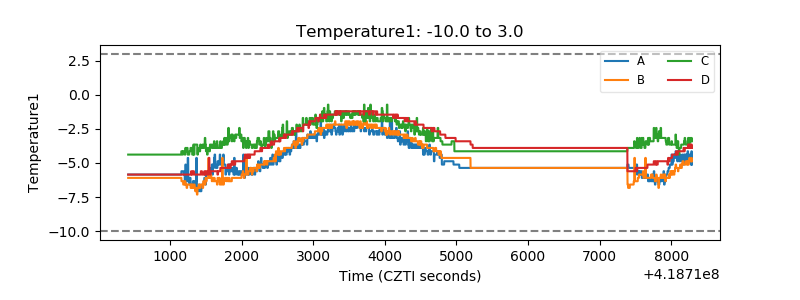 |
| Veto HV Monitor | 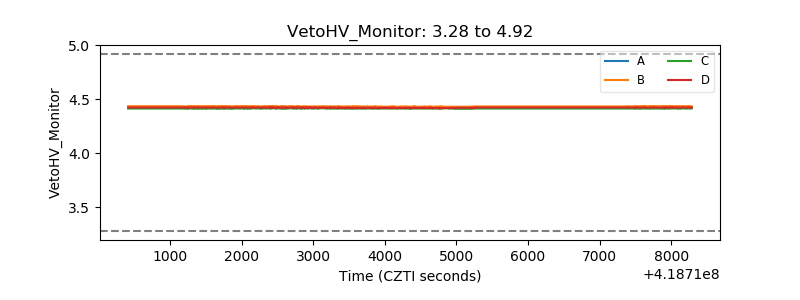 |
| Veto LLD | 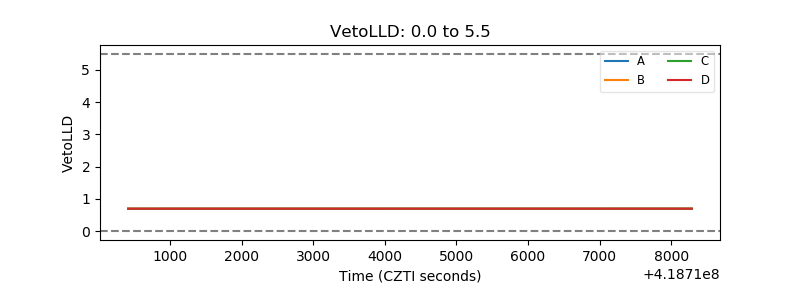 |
| Alpha Counter | 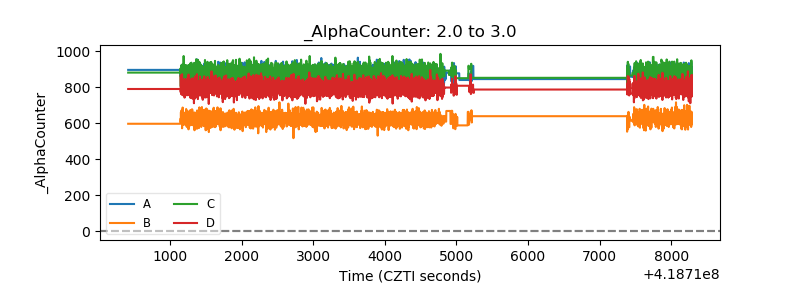 |
| _CPM_Rate | 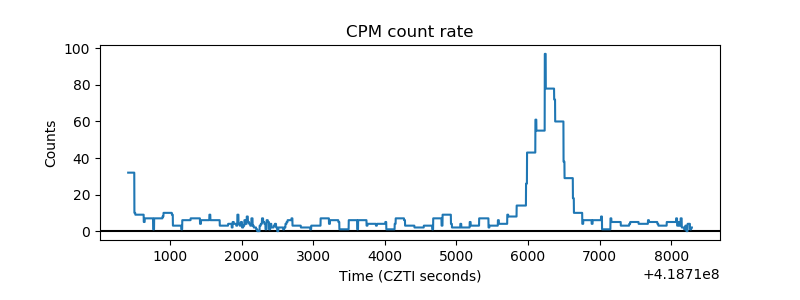 |
| CZT Counter | 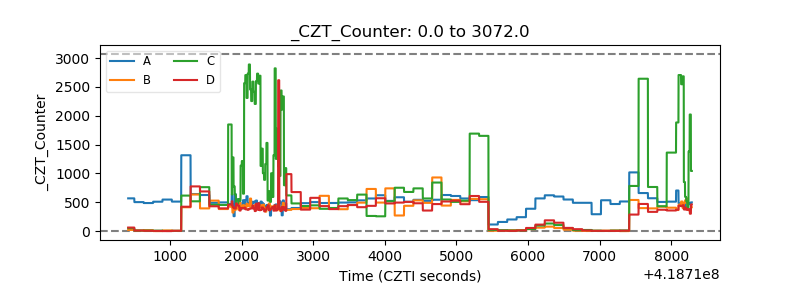 |
| +2.5 Volts monitor |  |
| +5 Volts monitor |  |
| _ROLL_ROT | 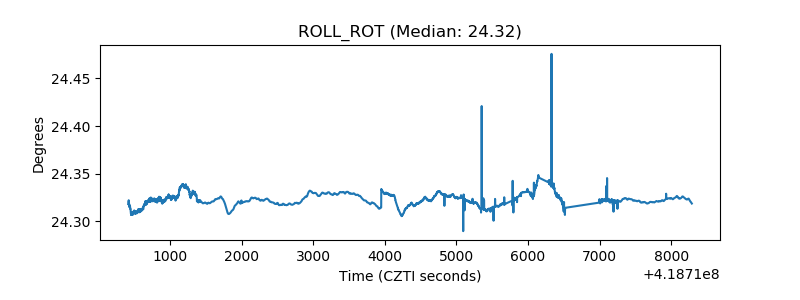 |
| _Roll_DEC | 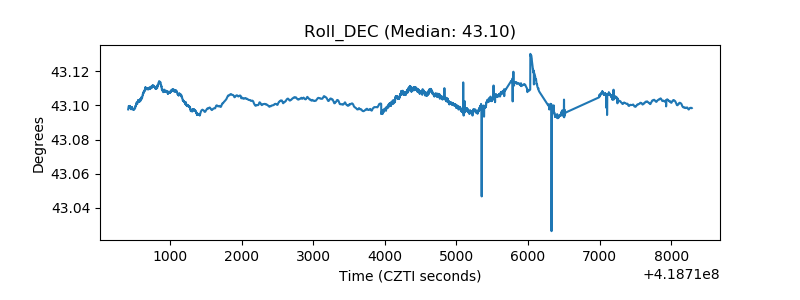 |
| _Roll_RA | 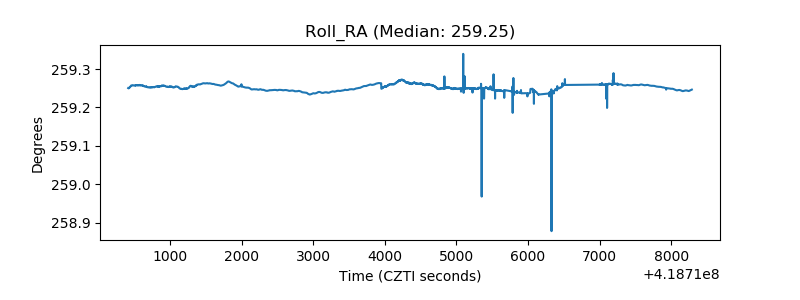 |
| Veto Counter | 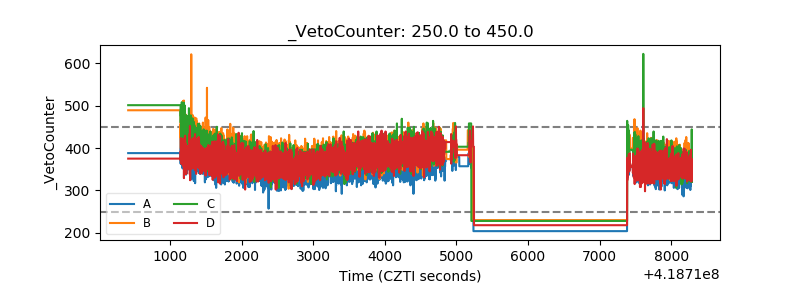 |