| Param | Original file | Final file |
|---|---|---|
| Filename | modeM0/AS1A12_029T02_9000005558_40711cztM0_level2.fits | modeM0/AS1A12_029T02_9000005558_40711cztM0_level2_quad_clean.evt |
| Size (bytes) | 412,369,920 | 86,544,000 |
| Size | 393.3 MB | 82.5 MB |
| Events in quadrant A | 2,868,605 | 599,627 |
| Events in quadrant B | 2,621,365 | 618,611 |
| Events in quadrant C | 6,345,273 | 515,946 |
| Events in quadrant D | 3,000,946 | 501,339 |
| Mode M0 | |||
|---|---|---|---|
| Quadrant | BADHDUFLAG | Total packets | Discarded packets |
| A | 0 | 11614 | 2 |
| B | 0 | 11496 | 1 |
| C | 0 | 22608 | 1 |
| D | 0 | 12591 | 1 |
| Mode M9 | |||
|---|---|---|---|
| Quadrant | BADHDUFLAG | Total packets | Discarded packets |
| A | 0 | 15 | 0 |
| B | 0 | 15 | 0 |
| C | 0 | 15 | 0 |
| D | 0 | 15 | 0 |
| Mode SS | |||
|---|---|---|---|
| Quadrant | BADHDUFLAG | Total packets | Discarded packets |
| A | 0 | 110 | 0 |
| B | 0 | 110 | 0 |
| C | 0 | 110 | 0 |
| D | 0 | 110 | 0 |
| Quadrant | Total seconds | Saturated seconds | Saturation percentage |
|---|---|---|---|
| A | 5504 | 9 | 0.163517% |
| B | 5504 | 19 | 0.345203% |
| C | 5504 | 913 | 16.587936% |
| D | 5504 | 433 | 7.867006% |
Noise dominated data is calculated using 1-second bins in cleaned event files. If a bin has >2000 counts, and if more than 50% of those come from <1% of pixels, then it is considered to be noise-dominated and hence unusable.
| Quadrant | # 1 sec bins | Bins with >0 counts | Bins with >2000 counts | High rate bins dominated by noise | Noise dominated (total time) | Noise dominated (detector-on time) | Marked lightcurve |
|---|---|---|---|---|---|---|---|
| A | 6936 | 5505 | 3 | 3 | 0.04% | 0.05% | 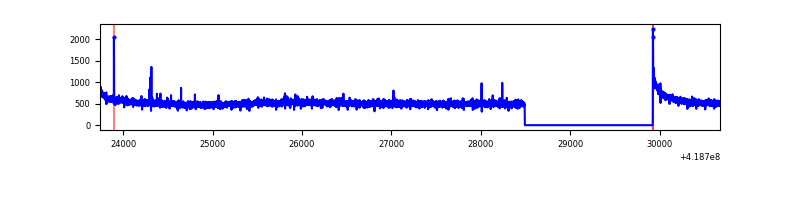 |
| B | 6936 | 5505 | 12 | 12 | 0.17% | 0.22% | 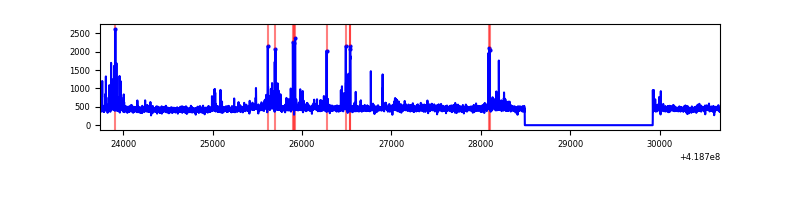 |
| C | 6936 | 5505 | 851 | 851 | 12.27% | 15.46% | 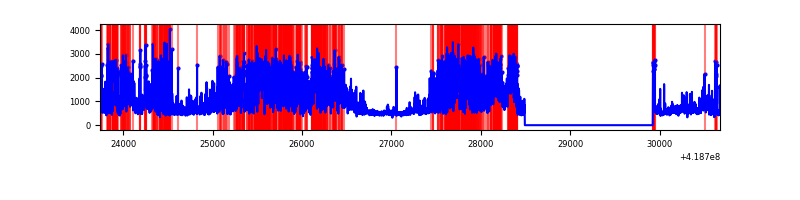 |
| D | 6936 | 5505 | 27 | 27 | 0.39% | 0.49% | 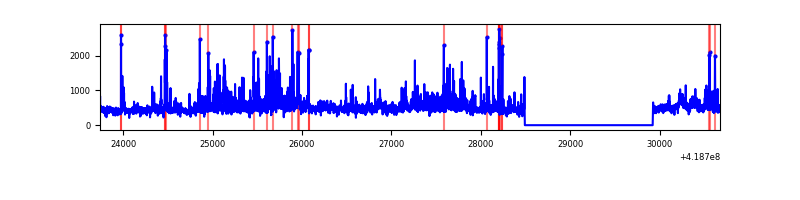 |
Top three noisy pixels from each quadrant. If the there are fewer than three noisy pixels in the level2.evt file, extra rows are filled as -1
| Pixel properties | Quadrant properties | ||||||
|---|---|---|---|---|---|---|---|
| Quadrant | DetID | PixID | Counts | Sigma | Mean | Median | Sigma |
| A | 10 | 83 | 476412 | 3770.41 | 613 | 601 | 126.2 |
| A | 2 | 79 | 10309 | 76.93 | 613 | 601 | 126.2 |
| A | 13 | 248 | 8266 | 60.74 | 613 | 601 | 126.2 |
| B | 0 | 190 | 127816 | 1071.3 | 609 | 590 | 118.8 |
| B | 5 | 255 | 50898 | 423.61 | 609 | 590 | 118.8 |
| B | 3 | 112 | 21941 | 179.78 | 609 | 590 | 118.8 |
| C | 9 | 187 | 3914797 | 29474.13 | 563 | 566 | 132.8 |
| C | 15 | 214 | 226815 | 1703.65 | 563 | 566 | 132.8 |
| C | 14 | 254 | 5585 | 37.79 | 563 | 566 | 132.8 |
| D | 2 | 250 | 243309 | 1711.86 | 570 | 555 | 141.8 |
| D | 12 | 191 | 164409 | 1155.47 | 570 | 555 | 141.8 |
| D | 13 | 249 | 119583 | 839.37 | 570 | 555 | 141.8 |
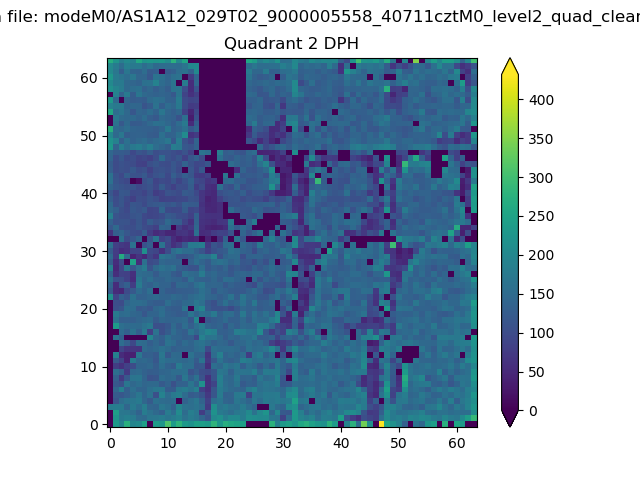
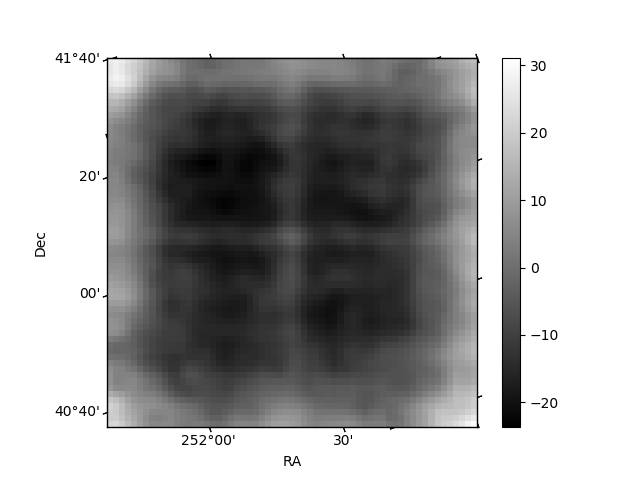
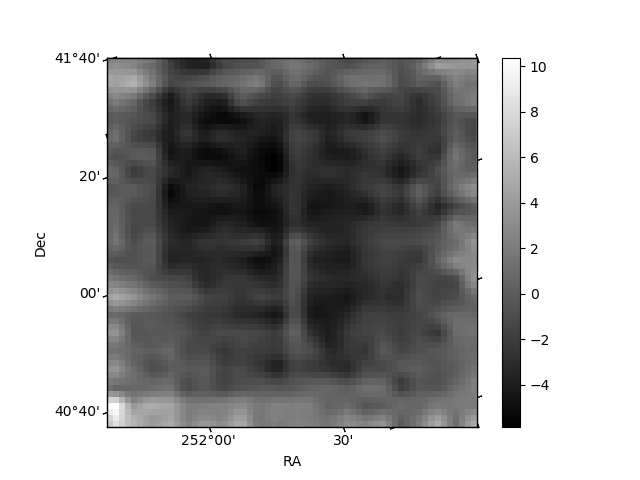
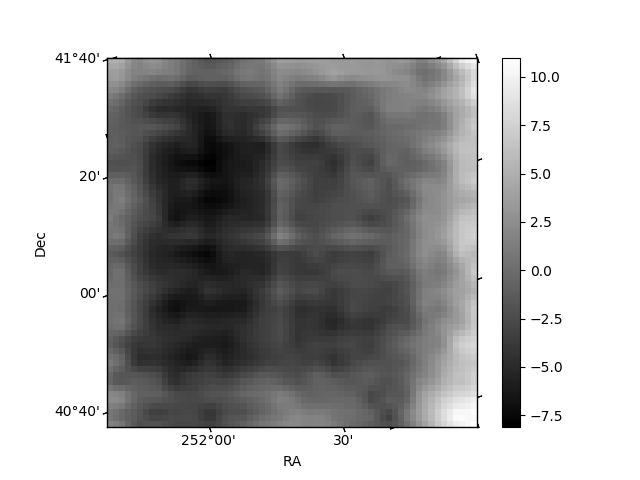
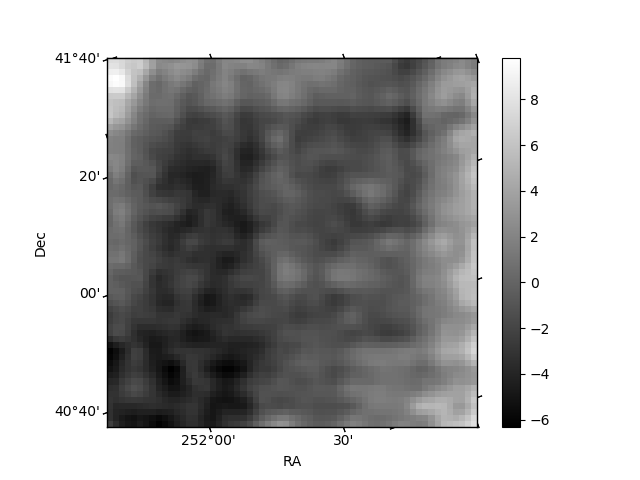
Histogram calculated using DETX and DETY for each event in the final _common_clean file
| Quadrant A | 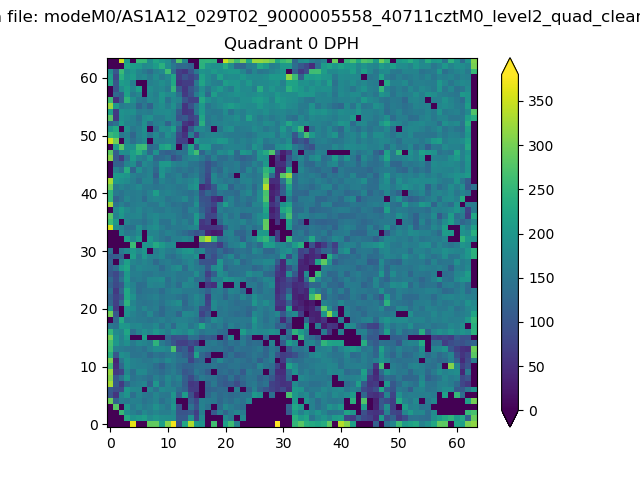 |
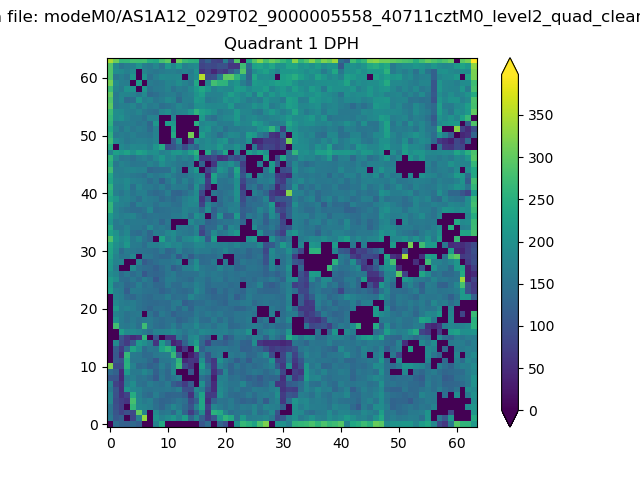 |
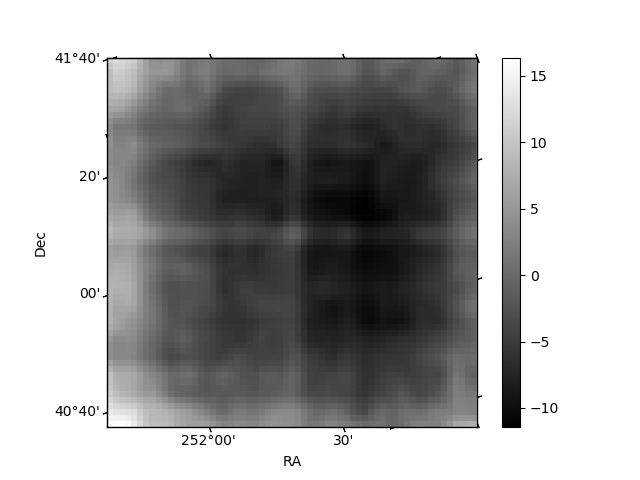
Quadrant B |
|---|---|---|---|
| Quadrant D | 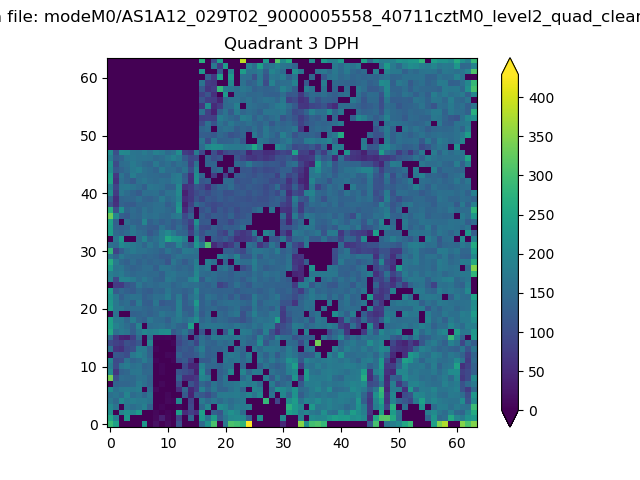 |
 |
Quadrant C |
| Plot type | Count rate plots | Images |
|---|---|---|
| Comparison with Poisson distribution Blue bars denote a histogram of data divided into 1 sec bins. Red curve is a Poisson curve with rate = median count rate of data. |
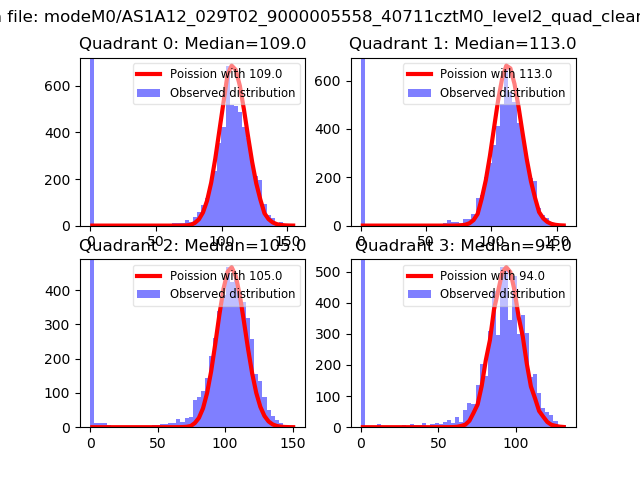 |
 |
| Quadrant-wise count rates Data is divided into 100 sec bins |
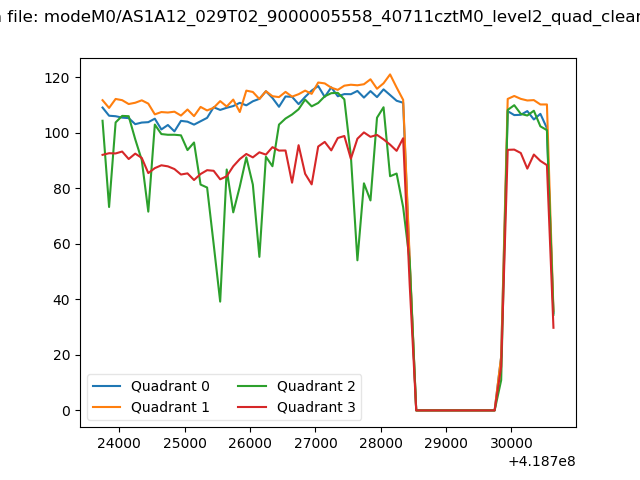 |
|
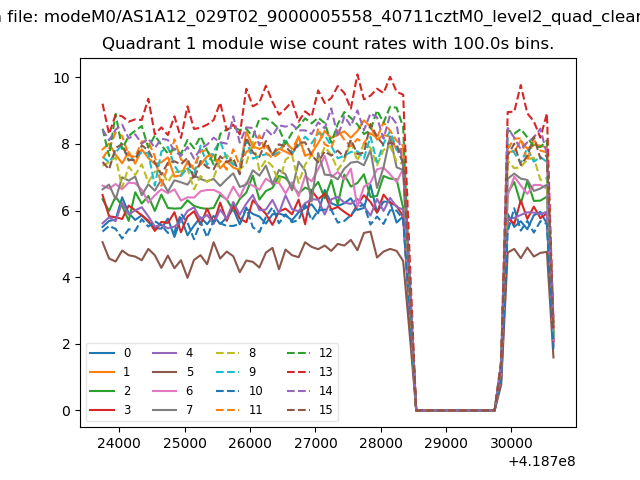
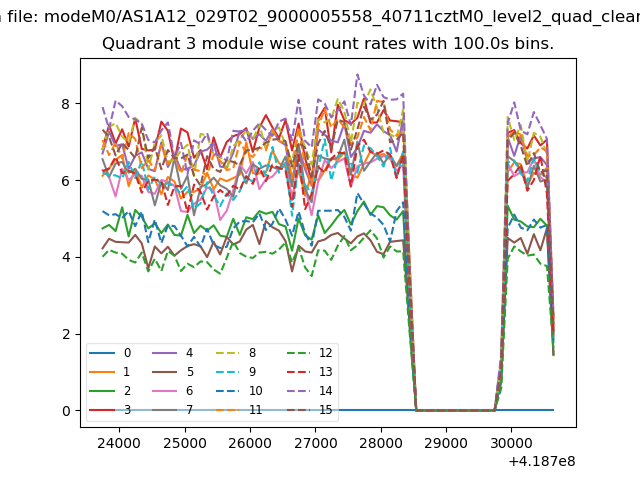
| Module-wise count rates for Quadrant A Data is divided into 100 sec bins |
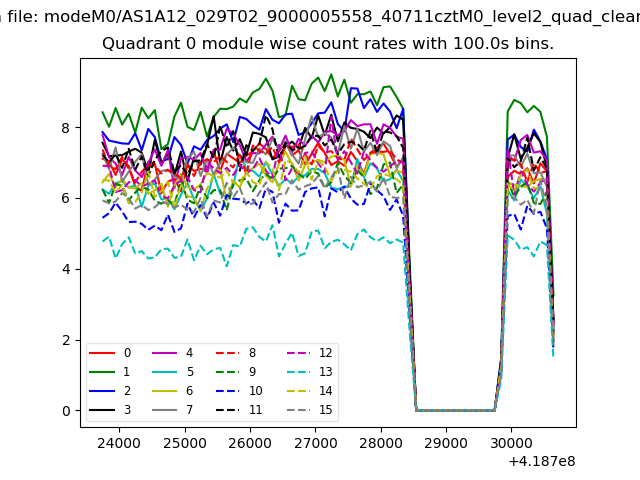 |
 |
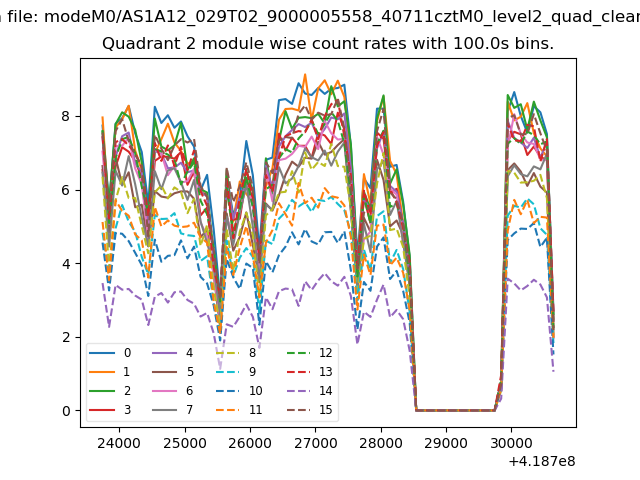
| Module-wise count rates for Quadrant B Data is divided into 100 sec bins |
 |
 |
| Module-wise count rates for Quadrant C Data is divided into 100 sec bins |
 |
 |
| Module-wise count rates for Quadrant D Data is divided into 100 sec bins |
 |
 |
| Parameter | Plot |
|---|---|
| CZT HV Monitor | 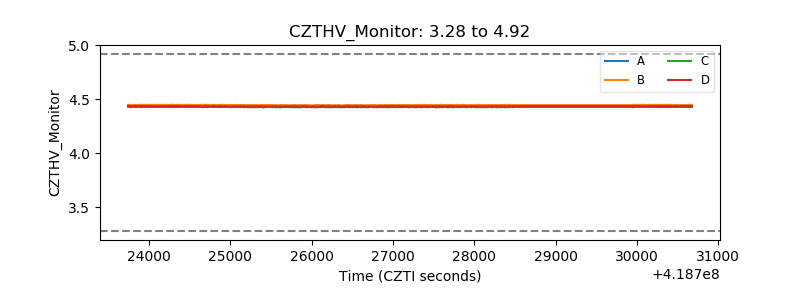 |
| D_VDD | 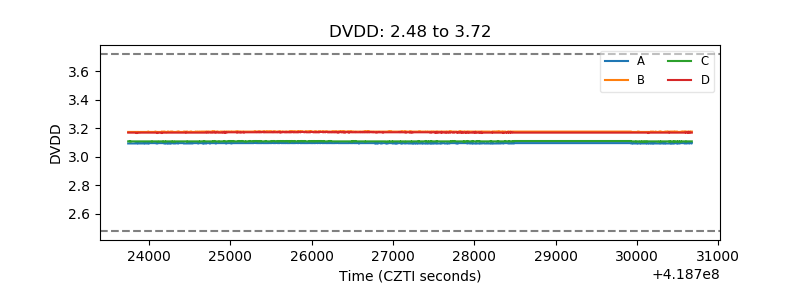 |
| Temperature 1 | 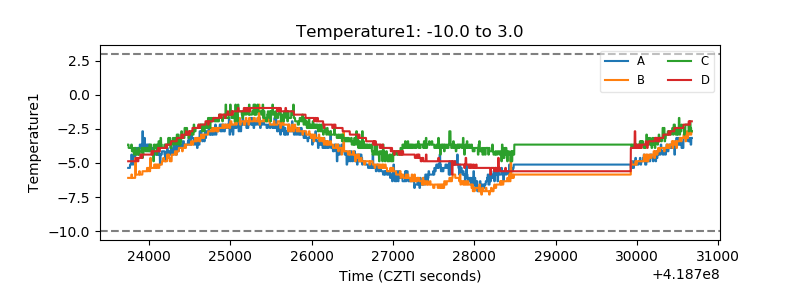 |
| Veto HV Monitor | 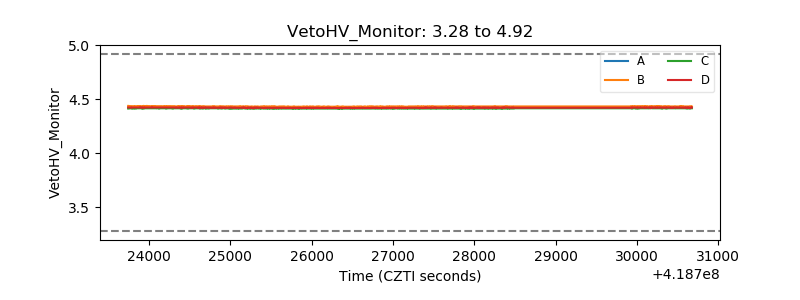 |
| Veto LLD | 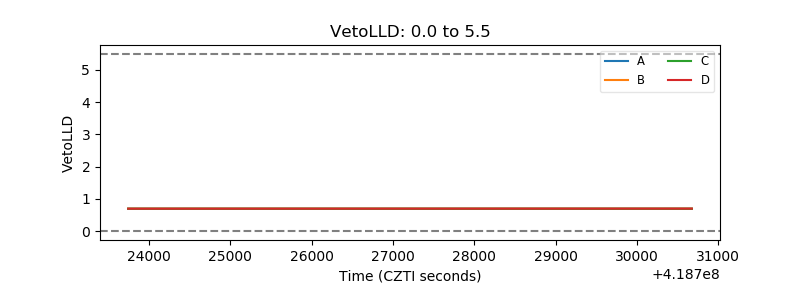 |
| Alpha Counter | 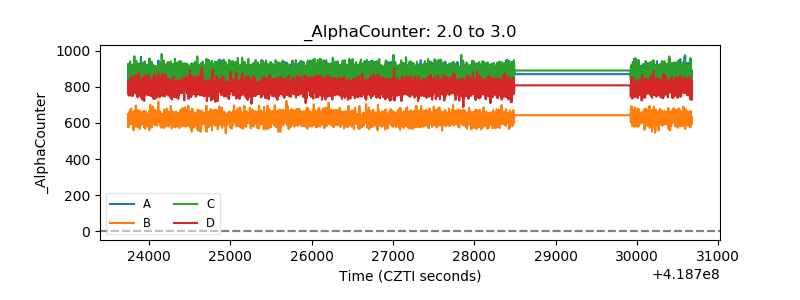 |
| _CPM_Rate | 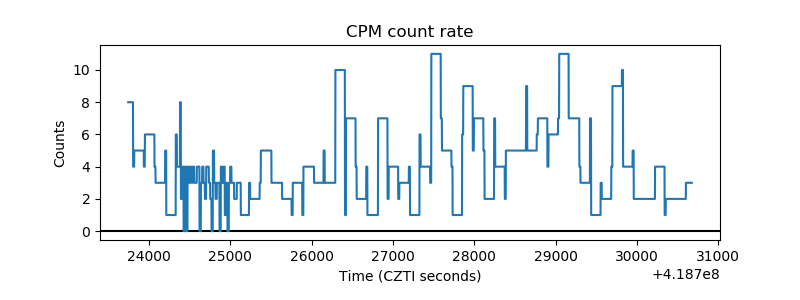 |
| CZT Counter | 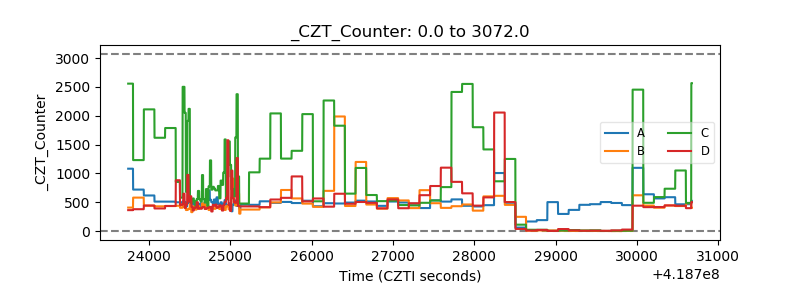 |
| +2.5 Volts monitor | 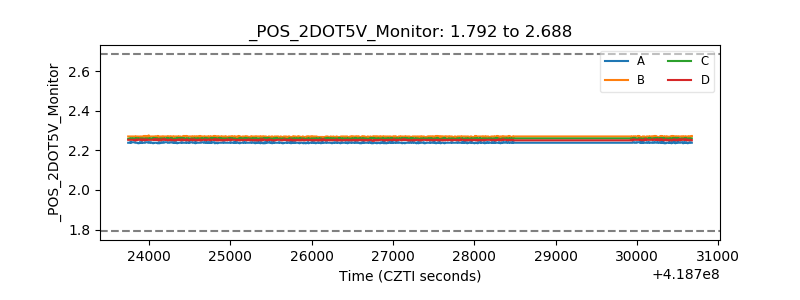 |
| +5 Volts monitor | 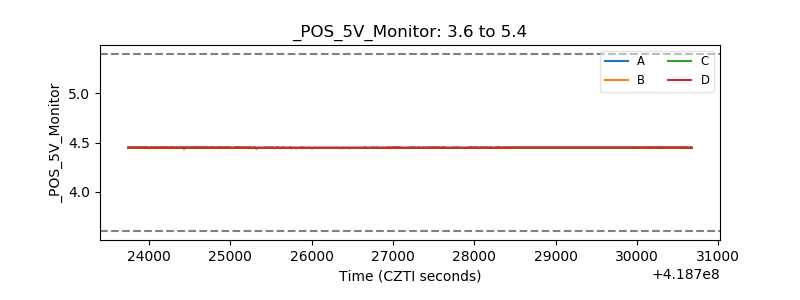 |
| _ROLL_ROT | 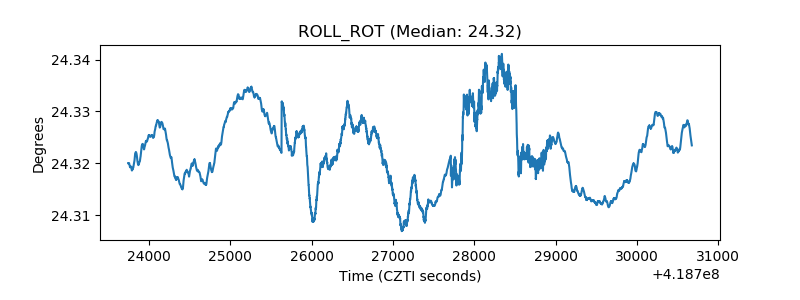 |
| _Roll_DEC | 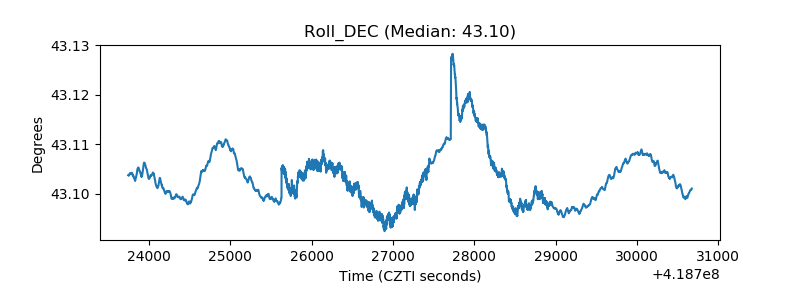 |
| _Roll_RA | 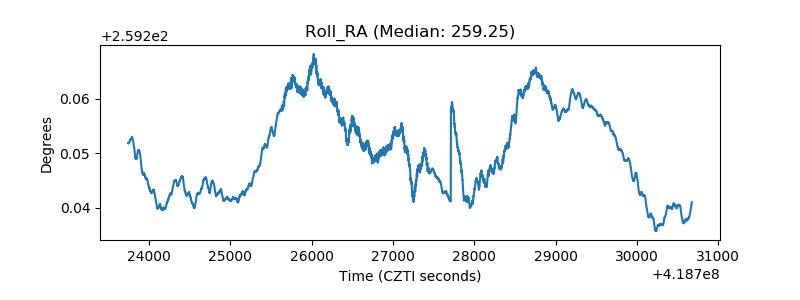 |
| Veto Counter | 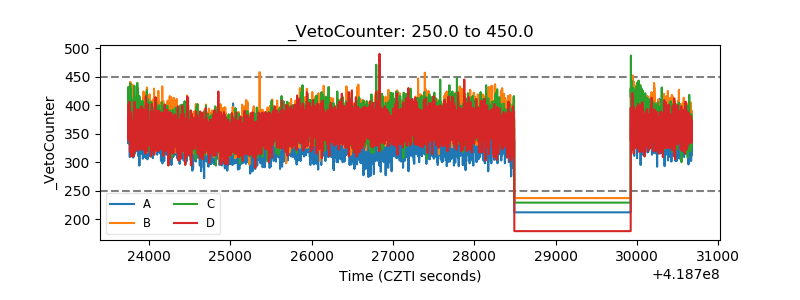 |