| Param | Original file | Final file |
|---|---|---|
| Filename | modeM0/AS1A12_029T02_9000005558_40712cztM0_level2.fits | modeM0/AS1A12_029T02_9000005558_40712cztM0_level2_quad_clean.evt |
| Size (bytes) | 443,534,400 | 92,453,760 |
| Size | 423.0 MB | 88.2 MB |
| Events in quadrant A | 3,112,110 | 636,599 |
| Events in quadrant B | 2,779,750 | 658,707 |
| Events in quadrant C | 6,776,088 | 564,551 |
| Events in quadrant D | 3,291,517 | 527,057 |
| Mode M0 | |||
|---|---|---|---|
| Quadrant | BADHDUFLAG | Total packets | Discarded packets |
| A | 0 | 12614 | 3 |
| B | 0 | 12241 | 2 |
| C | 0 | 24169 | 2 |
| D | 0 | 13575 | 2 |
| Mode M9 | |||
|---|---|---|---|
| Quadrant | BADHDUFLAG | Total packets | Discarded packets |
| A | 0 | 16 | 0 |
| B | 0 | 16 | 0 |
| C | 0 | 16 | 0 |
| D | 0 | 17 | 0 |
| Mode SS | |||
|---|---|---|---|
| Quadrant | BADHDUFLAG | Total packets | Discarded packets |
| A | 0 | 120 | 0 |
| B | 0 | 120 | 0 |
| C | 0 | 120 | 0 |
| D | 0 | 120 | 0 |
| Quadrant | Total seconds | Saturated seconds | Saturation percentage |
|---|---|---|---|
| A | 5897 | 14 | 0.237409% |
| B | 5897 | 31 | 0.525691% |
| C | 5897 | 850 | 14.414109% |
| D | 5897 | 574 | 9.733763% |
Noise dominated data is calculated using 1-second bins in cleaned event files. If a bin has >2000 counts, and if more than 50% of those come from <1% of pixels, then it is considered to be noise-dominated and hence unusable.
| Quadrant | # 1 sec bins | Bins with >0 counts | Bins with >2000 counts | High rate bins dominated by noise | Noise dominated (total time) | Noise dominated (detector-on time) | Marked lightcurve |
|---|---|---|---|---|---|---|---|
| A | 7210 | 5898 | 3 | 3 | 0.04% | 0.05% | 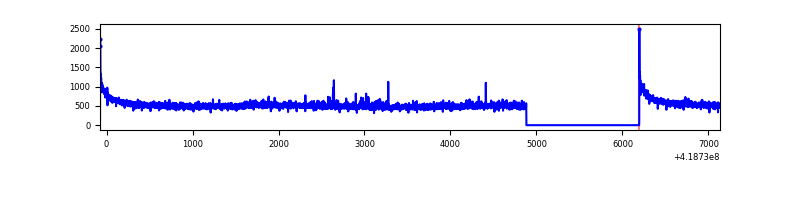 |
| B | 7210 | 5898 | 18 | 18 | 0.25% | 0.31% | 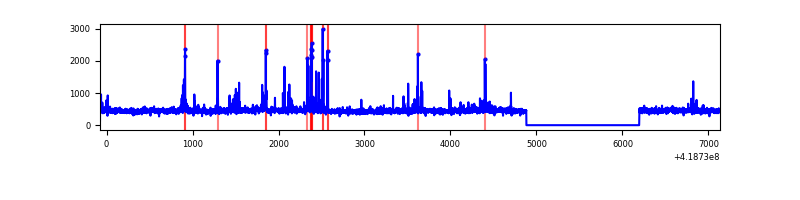 |
| C | 7210 | 5898 | 848 | 848 | 11.76% | 14.38% | 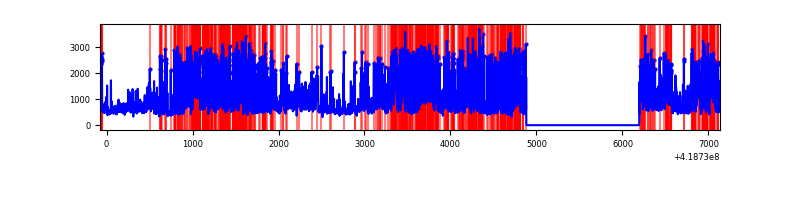 |
| D | 7210 | 5898 | 54 | 54 | 0.75% | 0.92% | 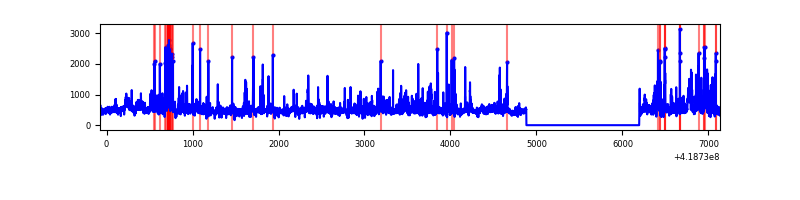 |
Top three noisy pixels from each quadrant. If the there are fewer than three noisy pixels in the level2.evt file, extra rows are filled as -1
| Pixel properties | Quadrant properties | ||||||
|---|---|---|---|---|---|---|---|
| Quadrant | DetID | PixID | Counts | Sigma | Mean | Median | Sigma |
| A | 10 | 83 | 524753 | 3879.09 | 656 | 642 | 135.1 |
| A | 12 | 189 | 40612 | 295.83 | 656 | 642 | 135.1 |
| A | 13 | 254 | 7761 | 52.69 | 656 | 642 | 135.1 |
| B | 5 | 255 | 112664 | 867.01 | 653 | 635 | 129.2 |
| B | 0 | 190 | 66097 | 506.62 | 653 | 635 | 129.2 |
| B | 3 | 112 | 20154 | 151.06 | 653 | 635 | 129.2 |
| C | 9 | 187 | 4150933 | 28959.85 | 608 | 610 | 143.3 |
| C | 15 | 214 | 244913 | 1704.68 | 608 | 610 | 143.3 |
| C | 5 | 10 | 4190 | 24.98 | 608 | 610 | 143.3 |
| D | 2 | 250 | 293634 | 1927.23 | 606 | 589 | 152.1 |
| D | 13 | 249 | 199352 | 1307.18 | 606 | 589 | 152.1 |
| D | 12 | 191 | 184598 | 1210.15 | 606 | 589 | 152.1 |
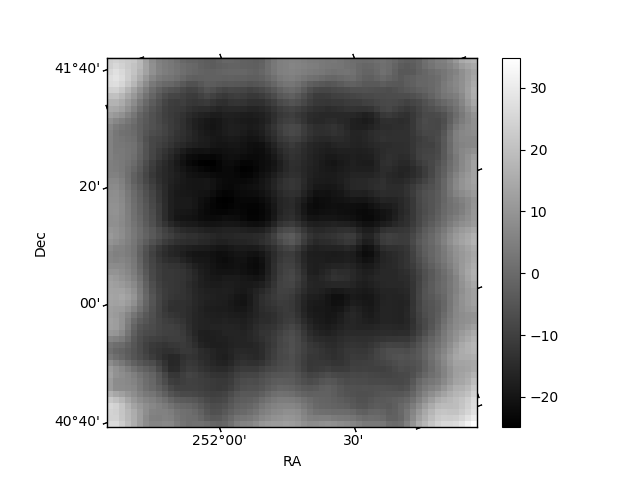
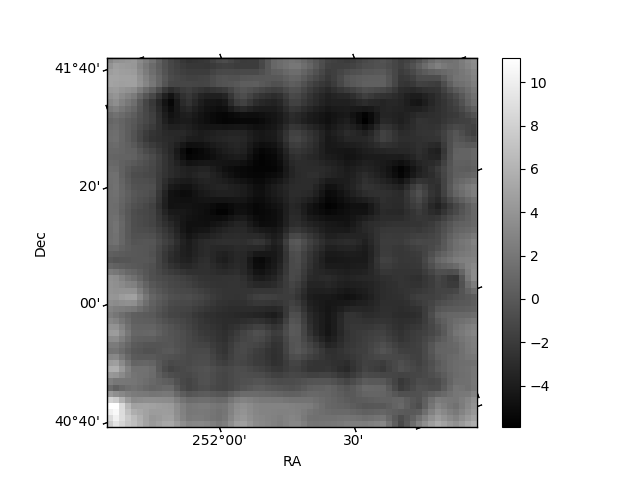
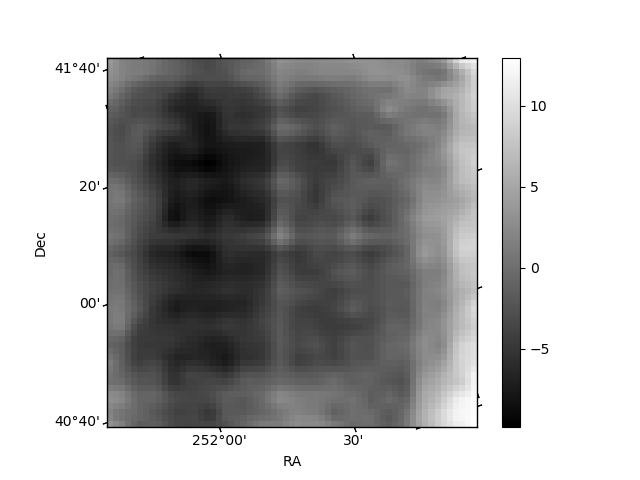
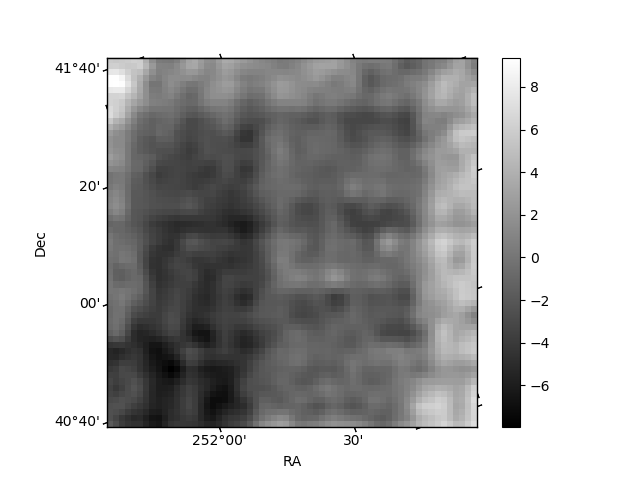
Histogram calculated using DETX and DETY for each event in the final _common_clean file
| Quadrant A | 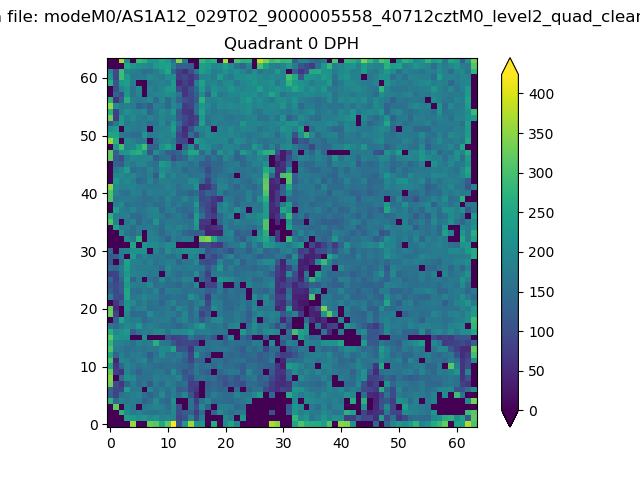 |
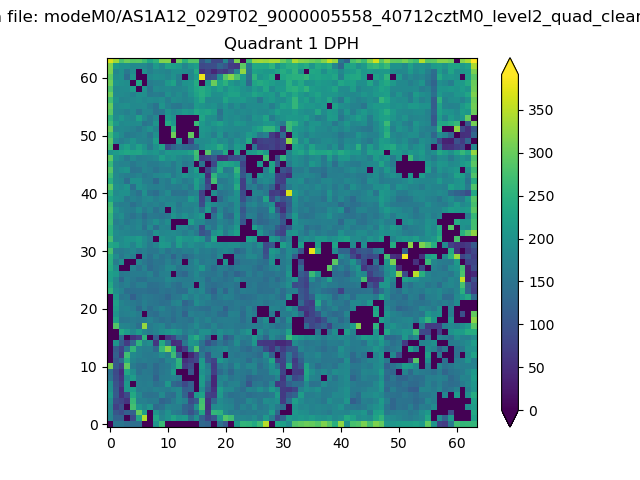 |
Quadrant B |
|---|---|---|---|
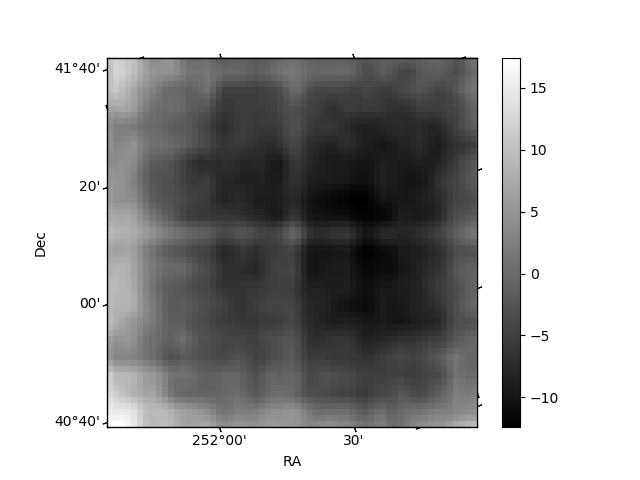
| Quadrant D | 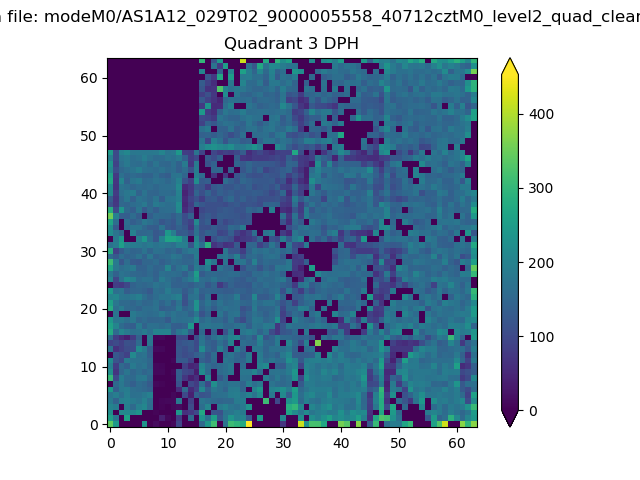 |
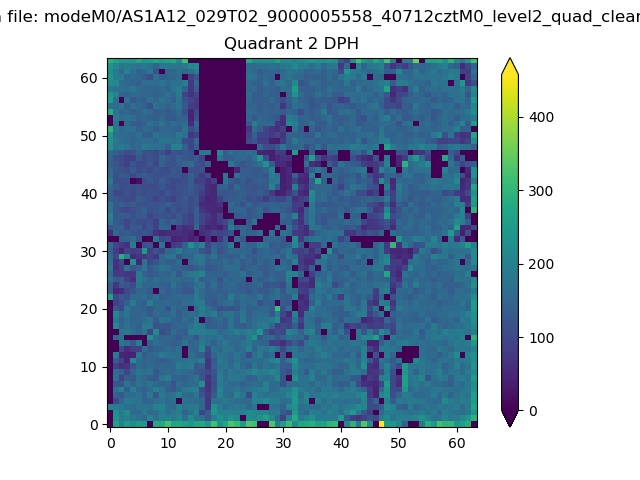 |
Quadrant C |
| Plot type | Count rate plots | Images |
|---|---|---|
| Comparison with Poisson distribution Blue bars denote a histogram of data divided into 1 sec bins. Red curve is a Poisson curve with rate = median count rate of data. |
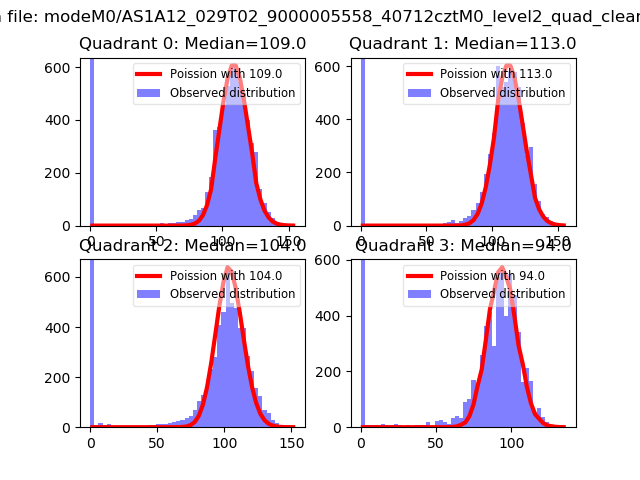 |
 |
| Quadrant-wise count rates Data is divided into 100 sec bins |
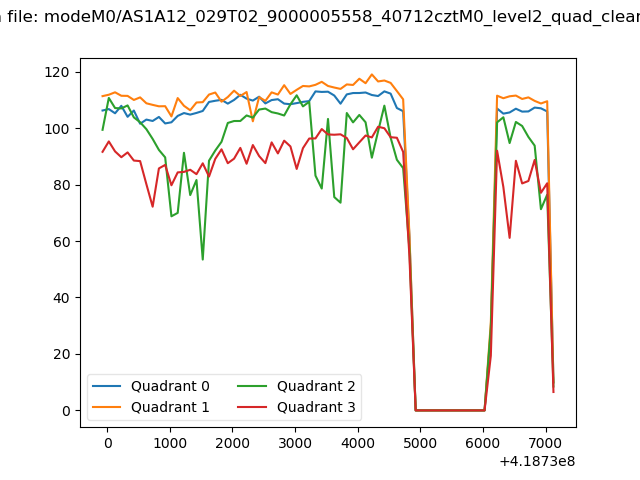 |
|
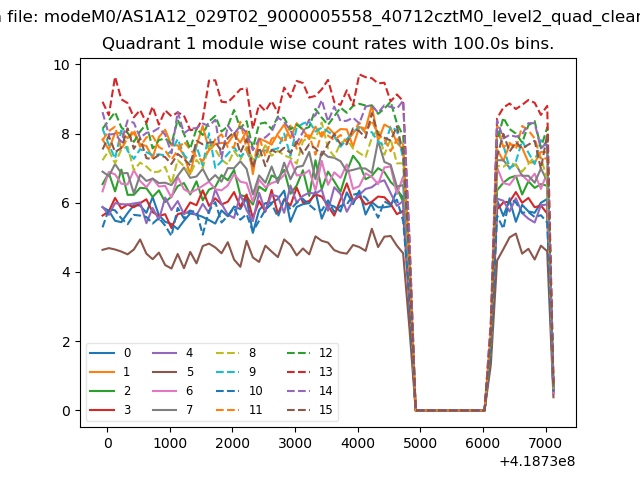
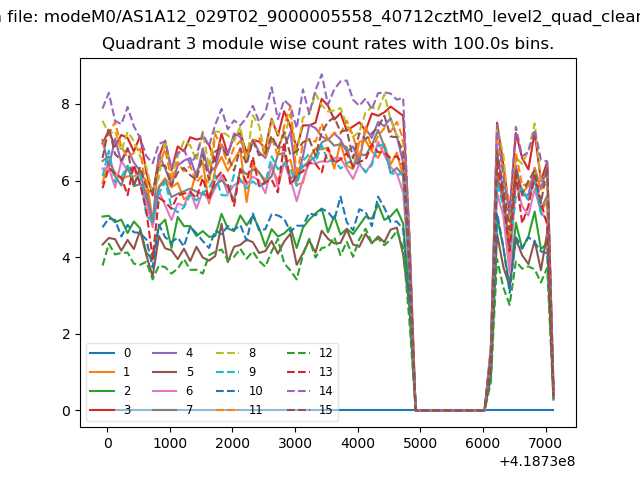
| Module-wise count rates for Quadrant A Data is divided into 100 sec bins |
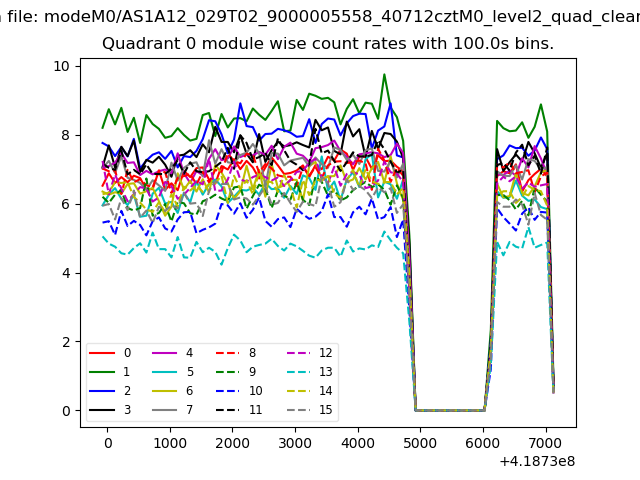 |
 |
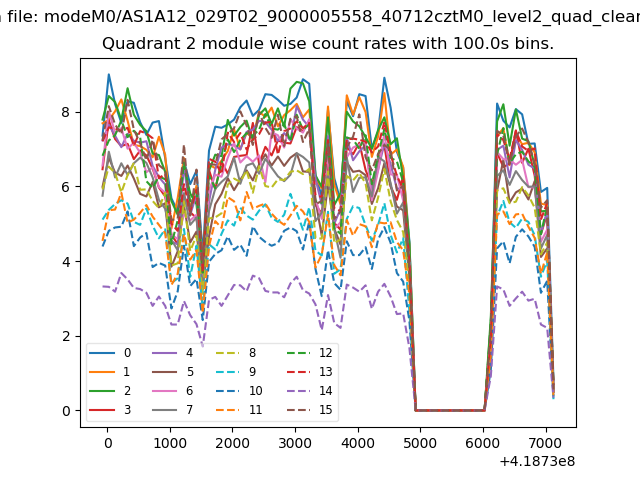
| Module-wise count rates for Quadrant B Data is divided into 100 sec bins |
 |
 |
| Module-wise count rates for Quadrant C Data is divided into 100 sec bins |
 |
 |
| Module-wise count rates for Quadrant D Data is divided into 100 sec bins |
 |
 |
| Parameter | Plot |
|---|---|
| CZT HV Monitor | 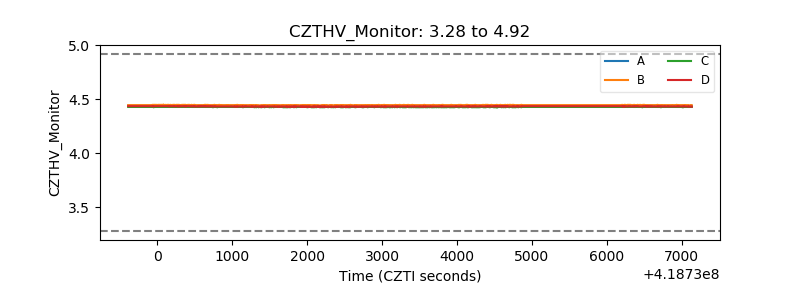 |
| D_VDD | 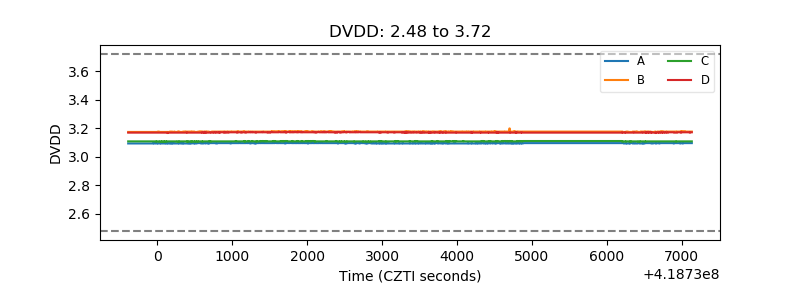 |
| Temperature 1 | 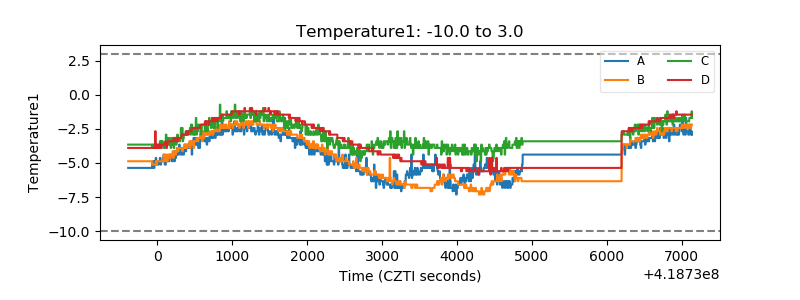 |
| Veto HV Monitor | 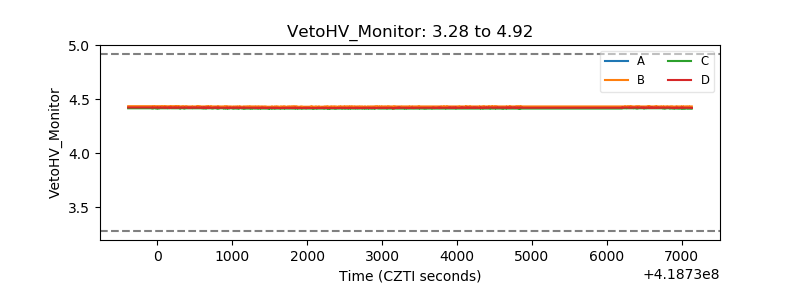 |
| Veto LLD | 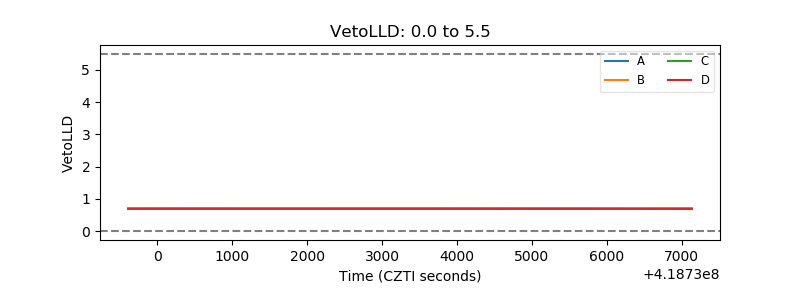 |
| Alpha Counter | 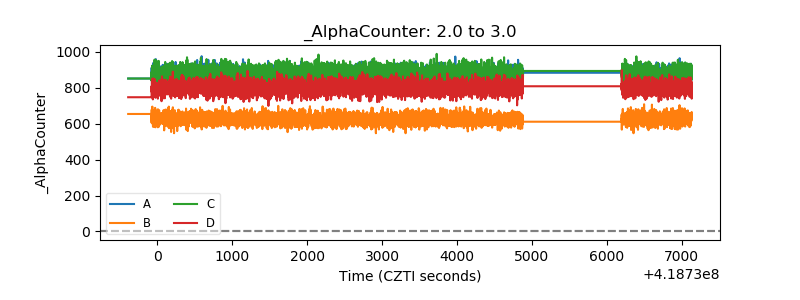 |
| _CPM_Rate | 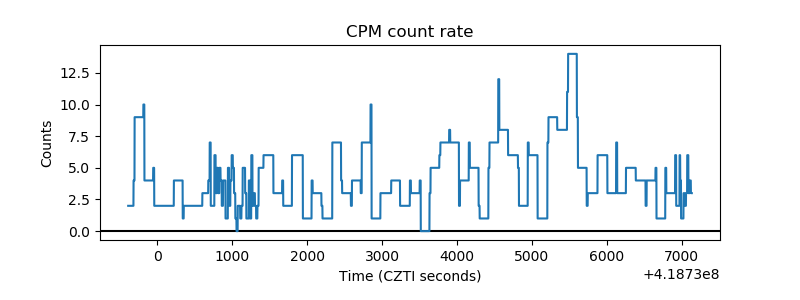 |
| CZT Counter | 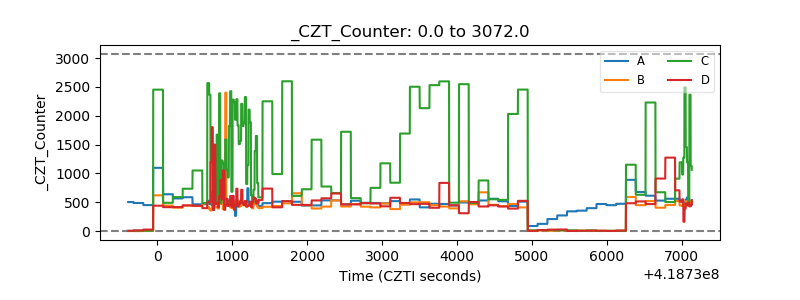 |
| +2.5 Volts monitor | 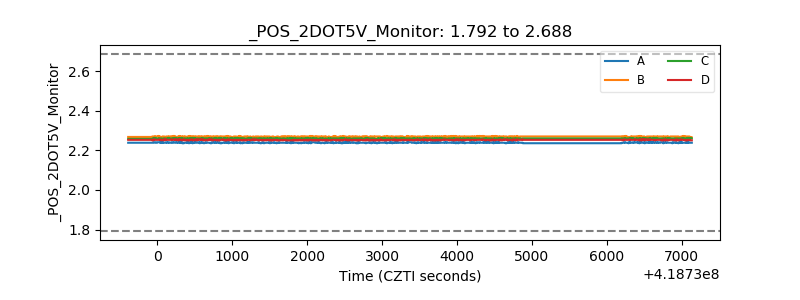 |
| +5 Volts monitor | 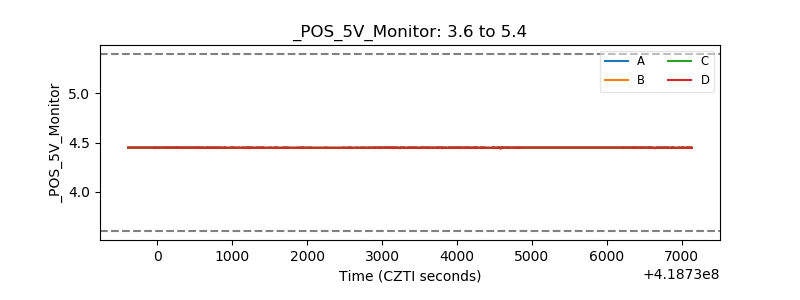 |
| _ROLL_ROT | 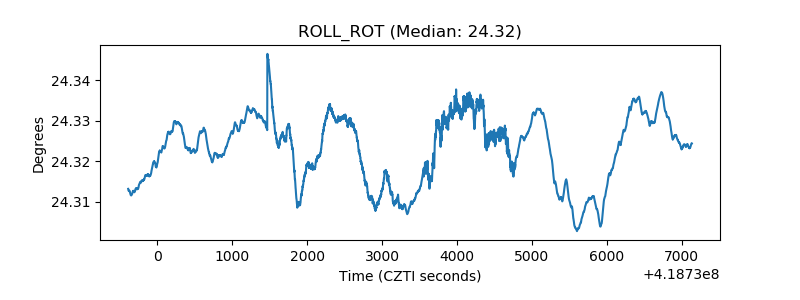 |
| _Roll_DEC | 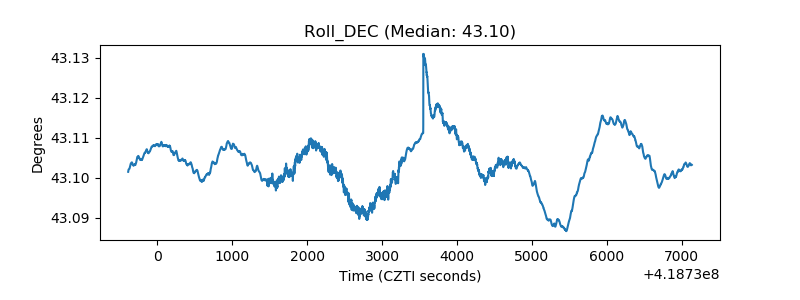 |
| _Roll_RA | 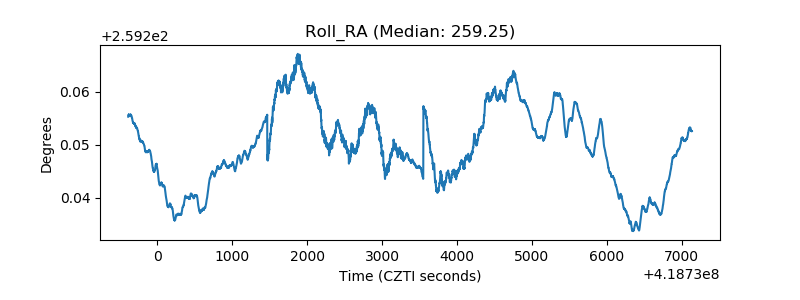 |
| Veto Counter | 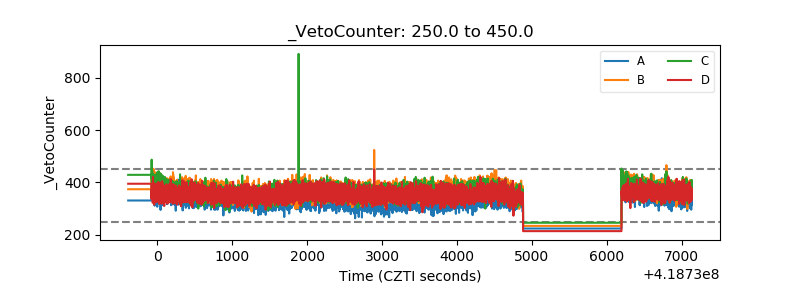 |