| Param | Original file | Final file |
|---|---|---|
| Filename | modeM0/AS1A12_029T02_9000005558_40716cztM0_level2.fits | modeM0/AS1A12_029T02_9000005558_40716cztM0_level2_quad_clean.evt |
| Size (bytes) | 434,036,160 | 87,275,520 |
| Size | 413.9 MB | 83.2 MB |
| Events in quadrant A | 2,998,862 | 620,344 |
| Events in quadrant B | 2,599,250 | 636,799 |
| Events in quadrant C | 6,362,346 | 544,146 |
| Events in quadrant D | 3,669,840 | 448,726 |
| Mode M0 | |||
|---|---|---|---|
| Quadrant | BADHDUFLAG | Total packets | Discarded packets |
| A | 0 | 12471 | 3 |
| B | 0 | 11579 | 2 |
| C | 0 | 22634 | 2 |
| D | 0 | 14940 | 2 |
| Mode M9 | |||
|---|---|---|---|
| Quadrant | BADHDUFLAG | Total packets | Discarded packets |
| A | 0 | 18 | 0 |
| B | 0 | 18 | 0 |
| C | 0 | 18 | 0 |
| D | 0 | 19 | 0 |
| Mode SS | |||
|---|---|---|---|
| Quadrant | BADHDUFLAG | Total packets | Discarded packets |
| A | 0 | 116 | 0 |
| B | 0 | 116 | 0 |
| C | 0 | 116 | 0 |
| D | 0 | 116 | 0 |
| Quadrant | Total seconds | Saturated seconds | Saturation percentage |
|---|---|---|---|
| A | 5600 | 19 | 0.339286% |
| B | 5600 | 21 | 0.375000% |
| C | 5600 | 814 | 14.535714% |
| D | 5600 | 1266 | 22.607143% |
Noise dominated data is calculated using 1-second bins in cleaned event files. If a bin has >2000 counts, and if more than 50% of those come from <1% of pixels, then it is considered to be noise-dominated and hence unusable.
| Quadrant | # 1 sec bins | Bins with >0 counts | Bins with >2000 counts | High rate bins dominated by noise | Noise dominated (total time) | Noise dominated (detector-on time) | Marked lightcurve |
|---|---|---|---|---|---|---|---|
| A | 7212 | 5601 | 4 | 4 | 0.06% | 0.07% | 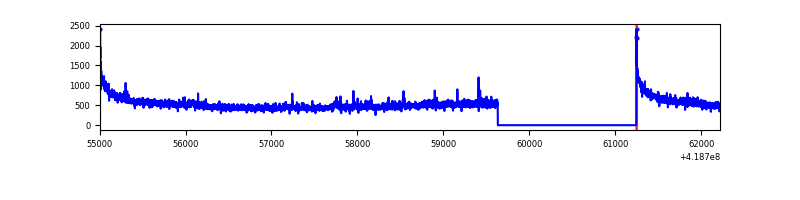 |
| B | 7212 | 5601 | 5 | 5 | 0.07% | 0.09% | 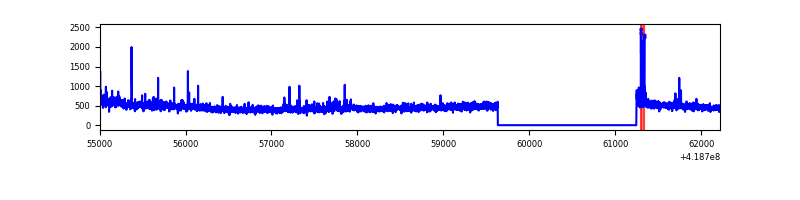 |
| C | 7212 | 5601 | 838 | 838 | 11.62% | 14.96% | 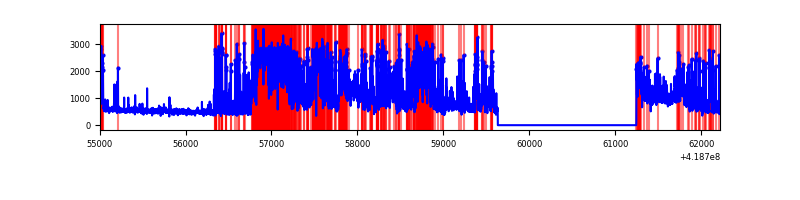 |
| D | 7212 | 5601 | 147 | 147 | 2.04% | 2.62% | 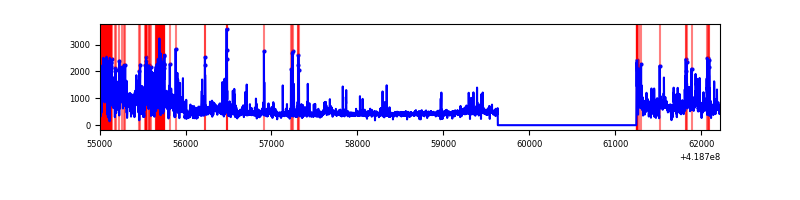 |
Top three noisy pixels from each quadrant. If the there are fewer than three noisy pixels in the level2.evt file, extra rows are filled as -1
| Pixel properties | Quadrant properties | ||||||
|---|---|---|---|---|---|---|---|
| Quadrant | DetID | PixID | Counts | Sigma | Mean | Median | Sigma |
| A | 10 | 83 | 513794 | 3990.92 | 625 | 611 | 128.6 |
| A | 12 | 189 | 40940 | 313.63 | 625 | 611 | 128.6 |
| A | 7 | 3 | 16435 | 123.06 | 625 | 611 | 128.6 |
| B | 0 | 190 | 70419 | 574.21 | 625 | 607 | 121.6 |
| B | 0 | 230 | 22958 | 183.84 | 625 | 607 | 121.6 |
| B | 4 | 170 | 20101 | 160.34 | 625 | 607 | 121.6 |
| C | 9 | 187 | 3709512 | 27013.36 | 585 | 588 | 137.3 |
| C | 15 | 214 | 232474 | 1688.91 | 585 | 588 | 137.3 |
| C | 14 | 254 | 126931 | 920.2 | 585 | 588 | 137.3 |
| D | 2 | 249 | 663829 | 4936.47 | 538 | 524 | 134.4 |
| D | 1 | 52 | 349335 | 2595.93 | 538 | 524 | 134.4 |
| D | 12 | 191 | 223914 | 1662.52 | 538 | 524 | 134.4 |
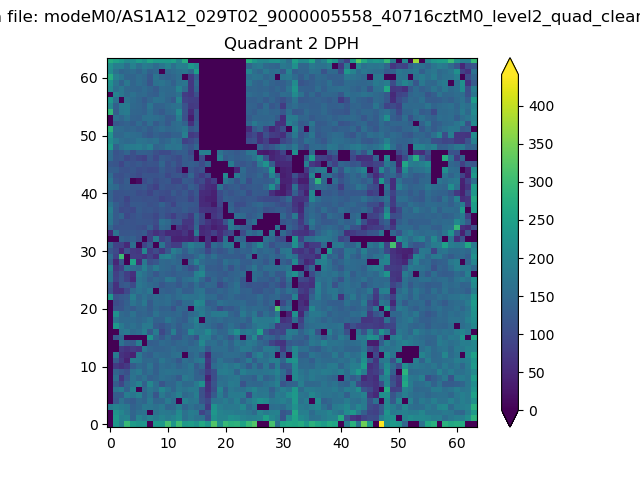
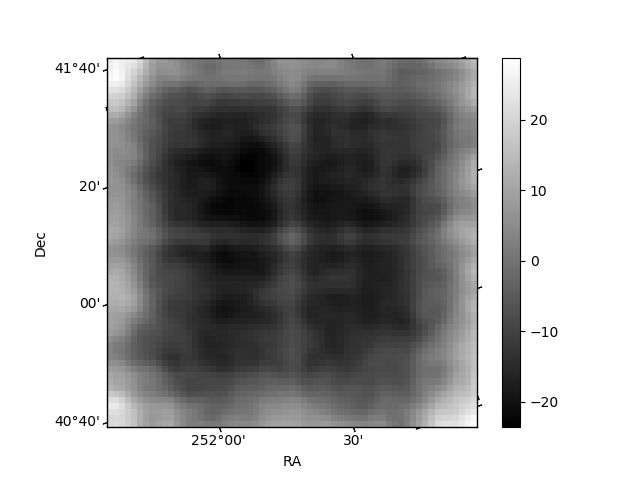
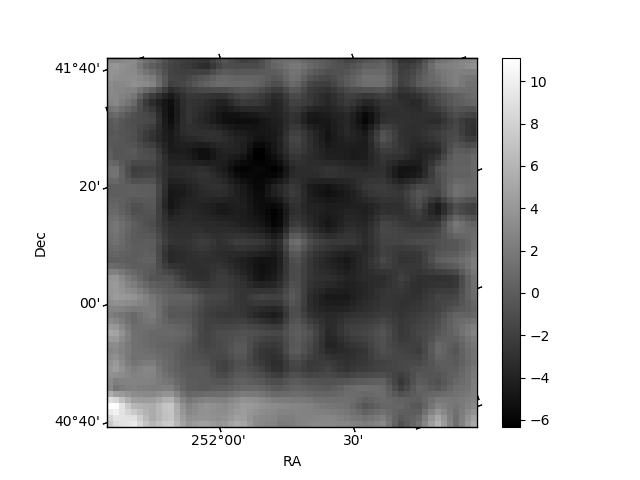
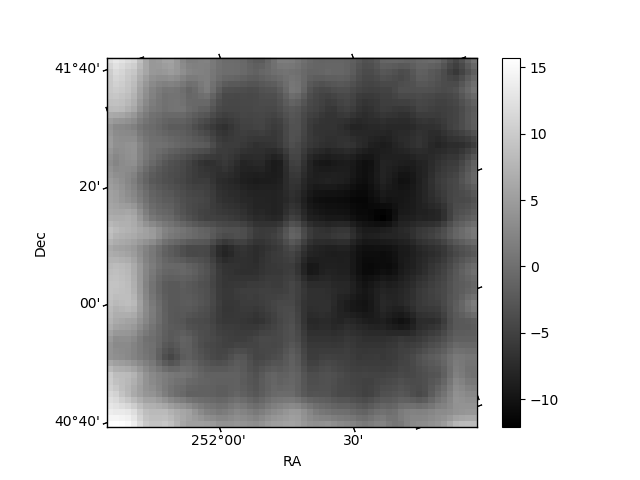
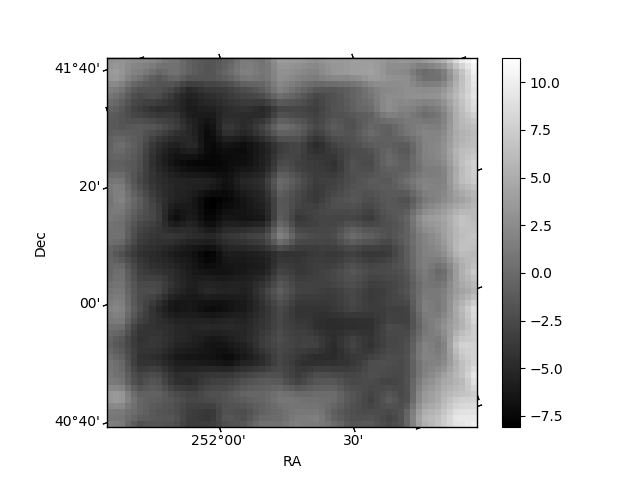
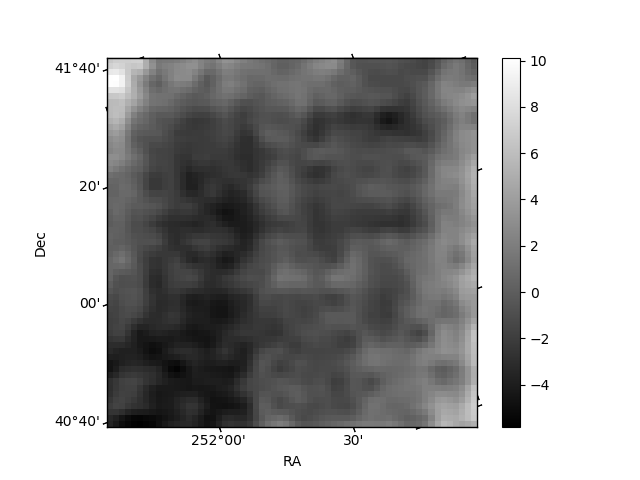
Histogram calculated using DETX and DETY for each event in the final _common_clean file
| Quadrant A | 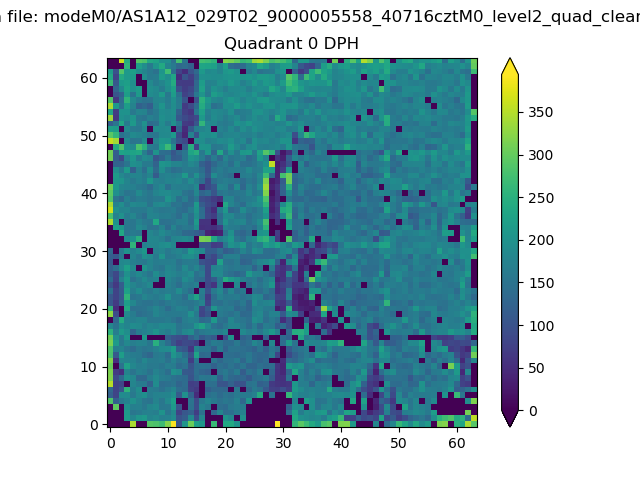 |
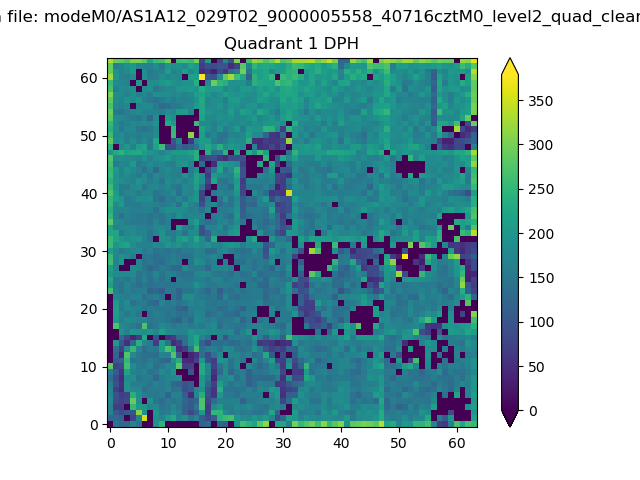 |
Quadrant B |
|---|---|---|---|
| Quadrant D | 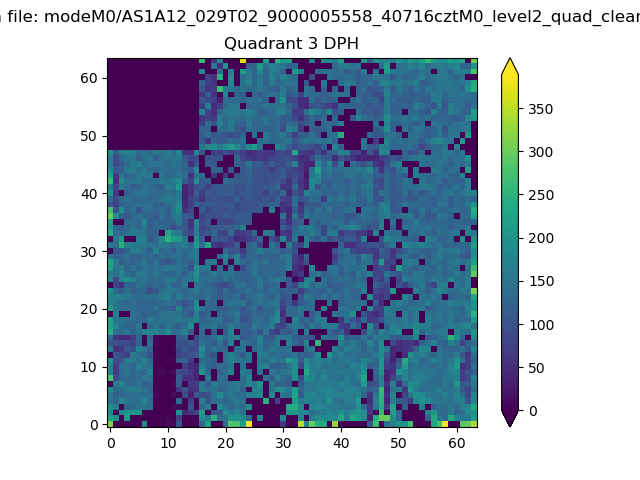 |
 |
Quadrant C |
| Plot type | Count rate plots | Images |
|---|---|---|
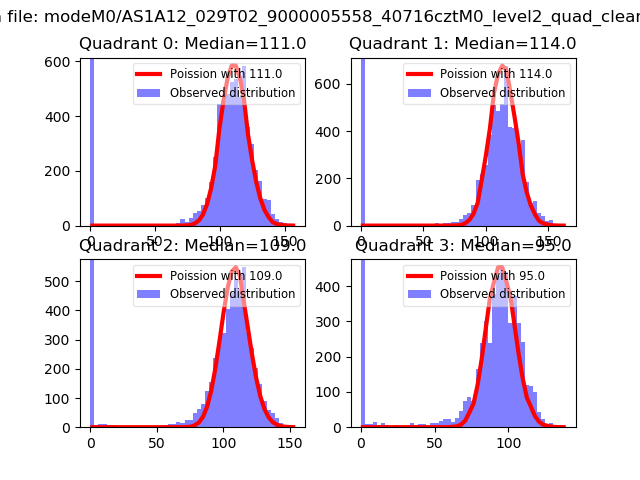
| Comparison with Poisson distribution Blue bars denote a histogram of data divided into 1 sec bins. Red curve is a Poisson curve with rate = median count rate of data. |
 |
 |
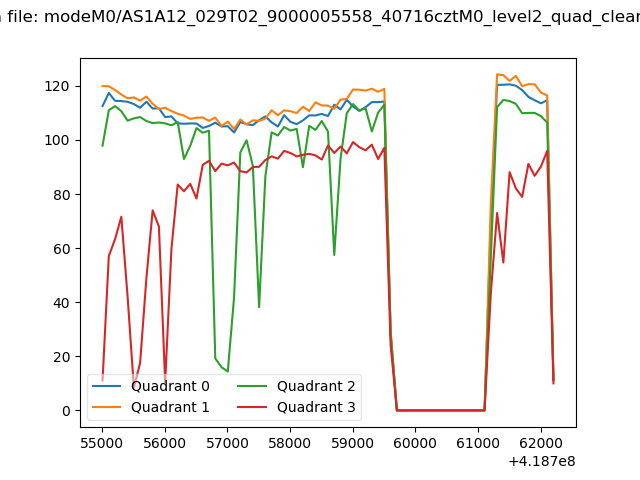
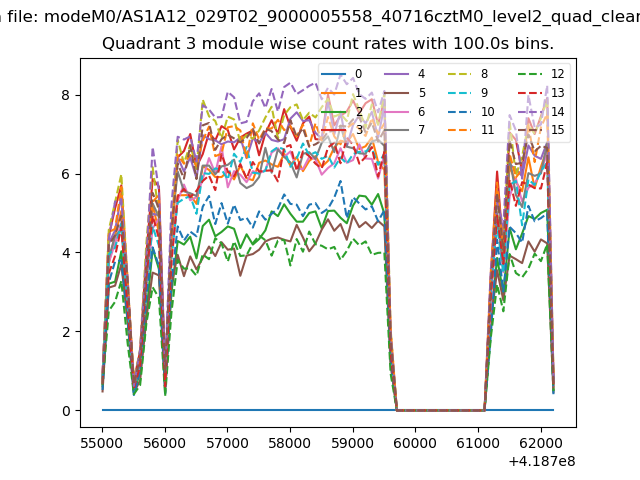
| Quadrant-wise count rates Data is divided into 100 sec bins |
 |
|
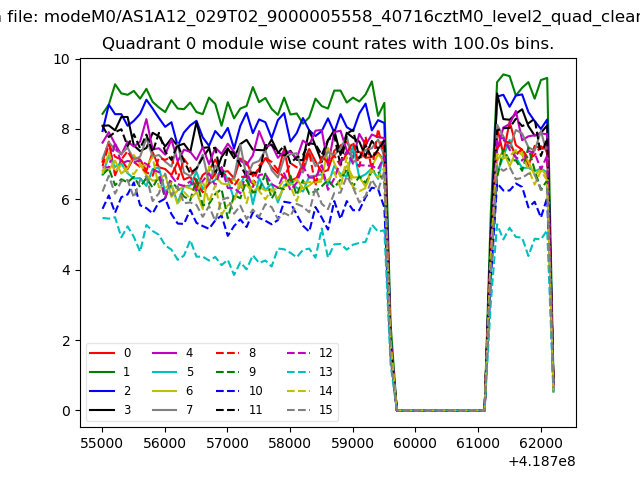
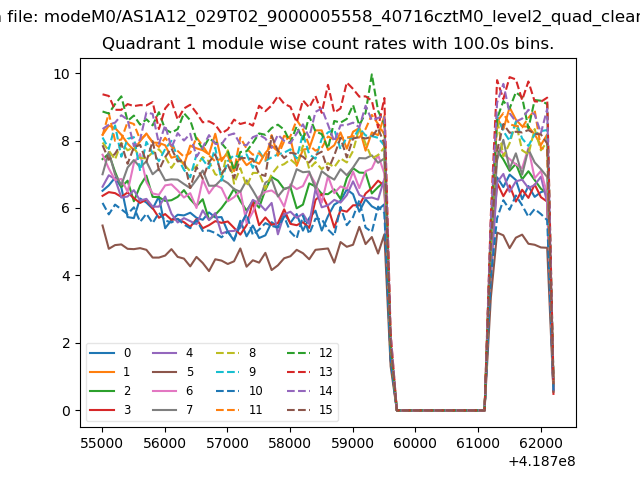
| Module-wise count rates for Quadrant A Data is divided into 100 sec bins |
 |
 |
| Module-wise count rates for Quadrant B Data is divided into 100 sec bins |
 |
 |
| Module-wise count rates for Quadrant C Data is divided into 100 sec bins |
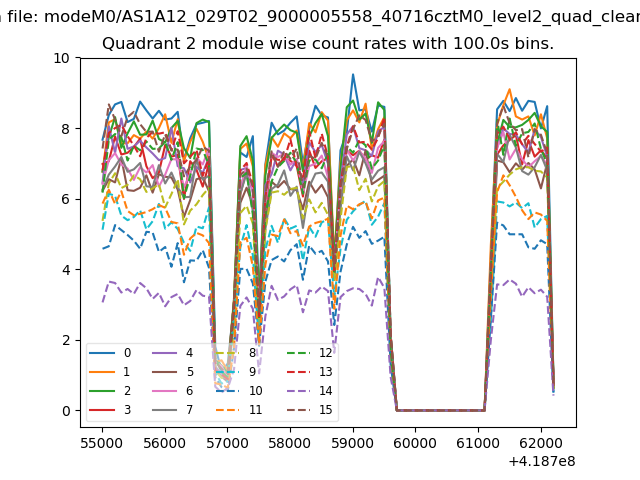 |
 |
| Module-wise count rates for Quadrant D Data is divided into 100 sec bins |
 |
 |
| Parameter | Plot |
|---|---|
| CZT HV Monitor | 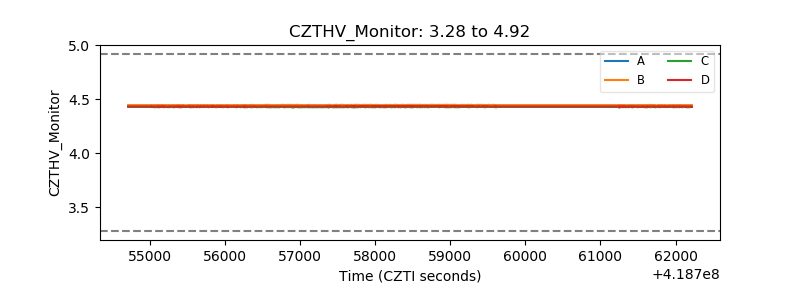 |
| D_VDD | 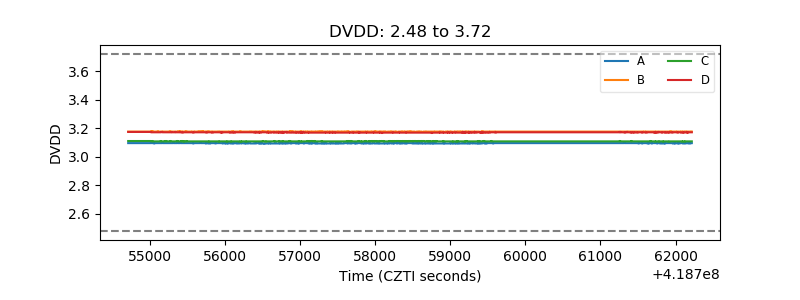 |
| Temperature 1 | 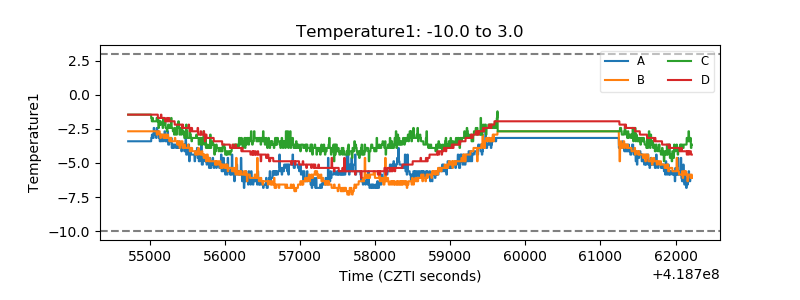 |
| Veto HV Monitor | 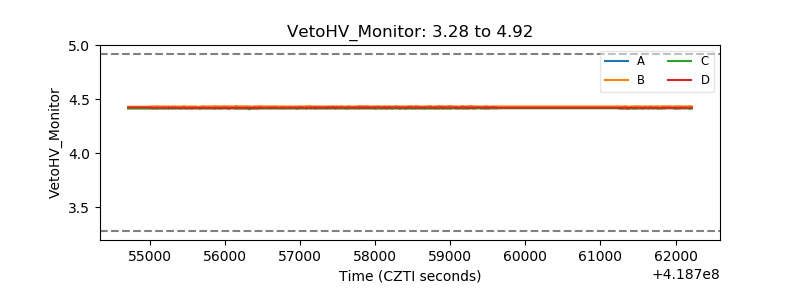 |
| Veto LLD | 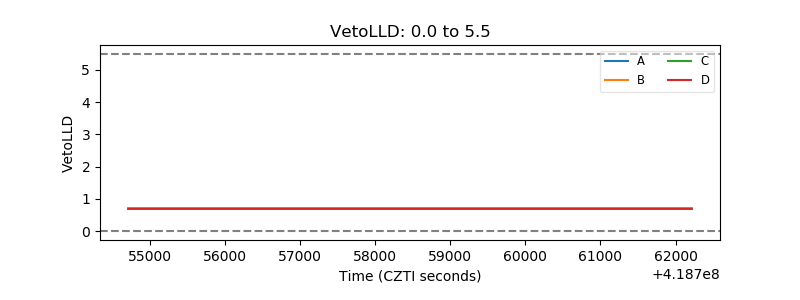 |
| Alpha Counter | 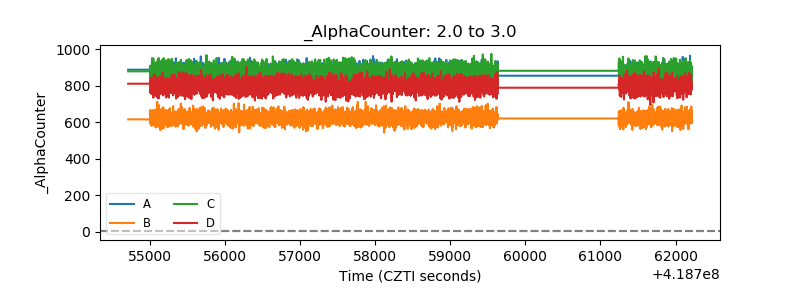 |
| _CPM_Rate | 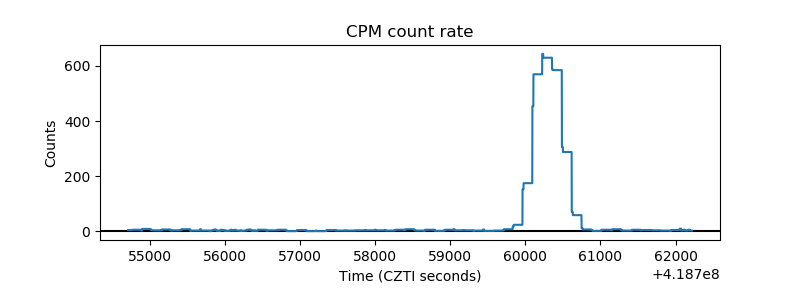 |
| CZT Counter | 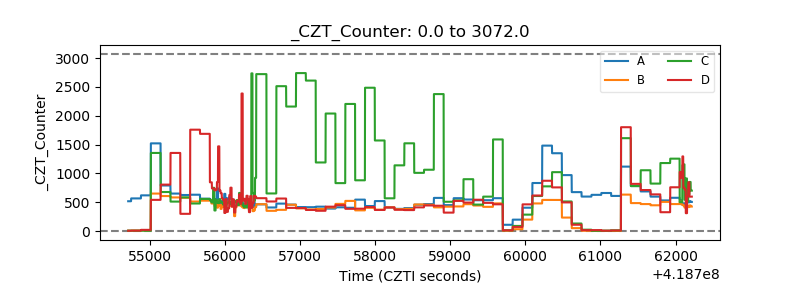 |
| +2.5 Volts monitor |  |
| +5 Volts monitor |  |
| _ROLL_ROT | 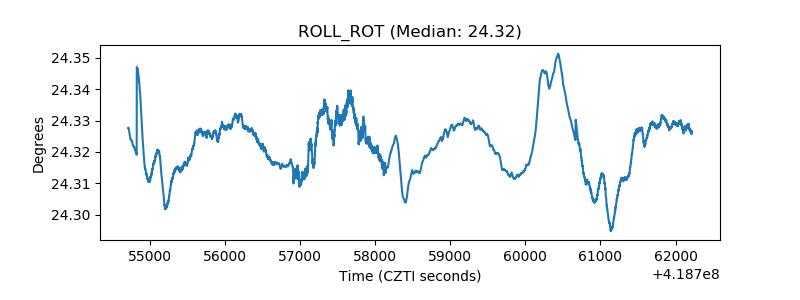 |
| _Roll_DEC | 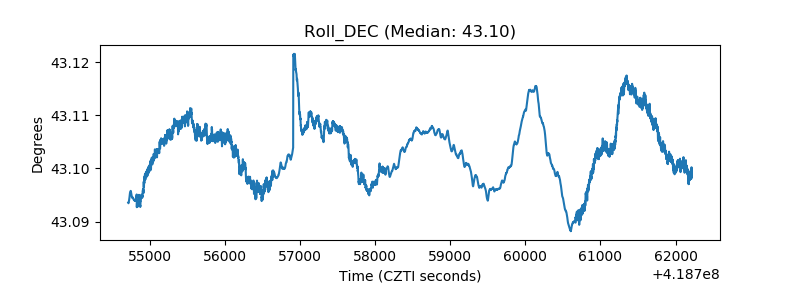 |
| _Roll_RA | 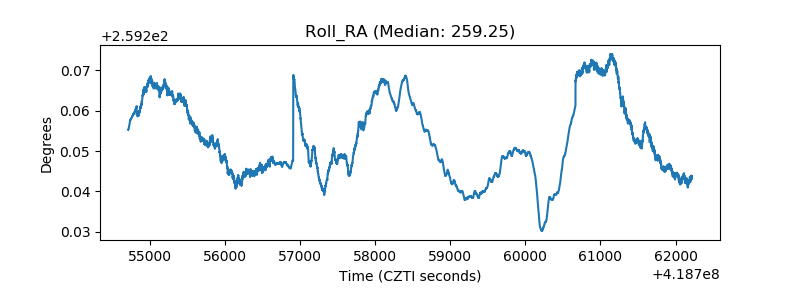 |
| Veto Counter | 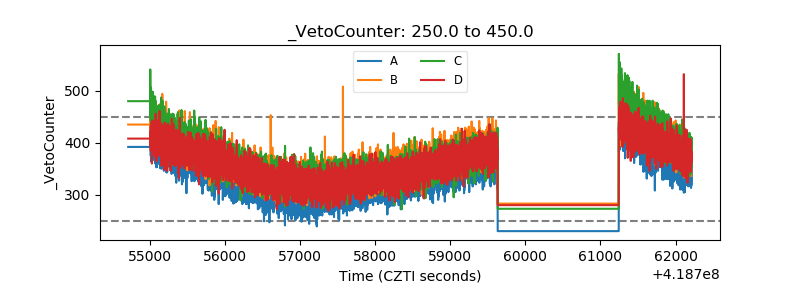 |