| Param | Original file | Final file |
|---|---|---|
| Filename | modeM0/AS1A12_029T02_9000005558_40718cztM0_level2.fits | modeM0/AS1A12_029T02_9000005558_40718cztM0_level2_quad_clean.evt |
| Size (bytes) | 401,051,520 | 88,606,080 |
| Size | 382.5 MB | 84.5 MB |
| Events in quadrant A | 2,861,166 | 608,566 |
| Events in quadrant B | 2,476,087 | 629,889 |
| Events in quadrant C | 5,771,097 | 573,839 |
| Events in quadrant D | 3,318,311 | 494,135 |
| Mode M0 | |||
|---|---|---|---|
| Quadrant | BADHDUFLAG | Total packets | Discarded packets |
| A | 0 | 11954 | 3 |
| B | 0 | 11083 | 2 |
| C | 0 | 20770 | 2 |
| D | 0 | 13670 | 2 |
| Mode M9 | |||
|---|---|---|---|
| Quadrant | BADHDUFLAG | Total packets | Discarded packets |
| A | 0 | 26 | 0 |
| B | 0 | 26 | 0 |
| C | 0 | 26 | 0 |
| D | 0 | 27 | 0 |
| Mode SS | |||
|---|---|---|---|
| Quadrant | BADHDUFLAG | Total packets | Discarded packets |
| A | 0 | 108 | 0 |
| B | 0 | 108 | 0 |
| C | 0 | 108 | 0 |
| D | 0 | 108 | 0 |
| Quadrant | Total seconds | Saturated seconds | Saturation percentage |
|---|---|---|---|
| A | 5379 | 16 | 0.297453% |
| B | 5379 | 17 | 0.316044% |
| C | 5379 | 501 | 9.313999% |
| D | 5379 | 698 | 12.976390% |
Noise dominated data is calculated using 1-second bins in cleaned event files. If a bin has >2000 counts, and if more than 50% of those come from <1% of pixels, then it is considered to be noise-dominated and hence unusable.
| Quadrant | # 1 sec bins | Bins with >0 counts | Bins with >2000 counts | High rate bins dominated by noise | Noise dominated (total time) | Noise dominated (detector-on time) | Marked lightcurve |
|---|---|---|---|---|---|---|---|
| A | 7112 | 5380 | 5 | 5 | 0.07% | 0.09% | 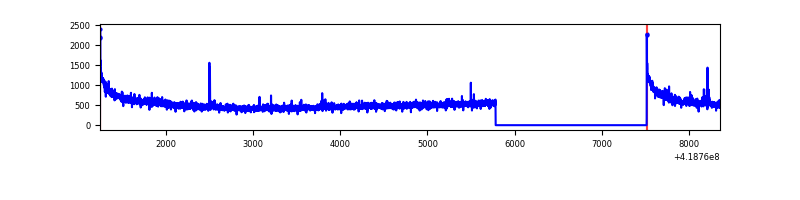 |
| B | 7112 | 5380 | 6 | 6 | 0.08% | 0.11% | 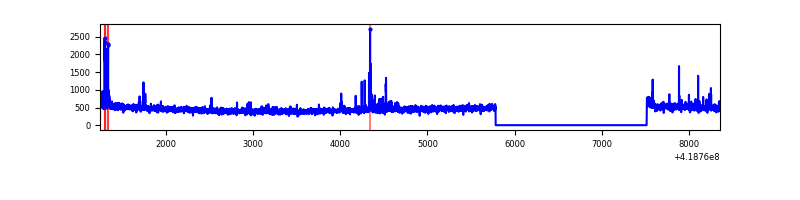 |
| C | 7112 | 5380 | 562 | 562 | 7.90% | 10.45% | 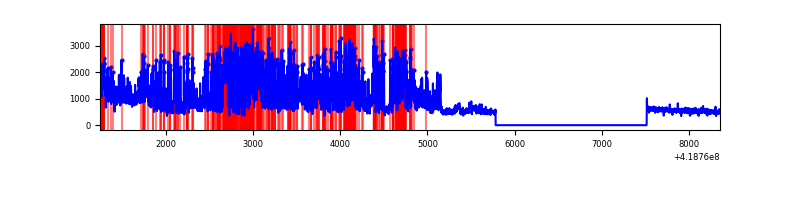 |
| D | 7112 | 5380 | 54 | 54 | 0.76% | 1.00% | 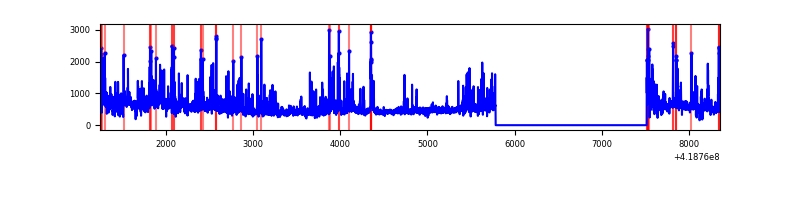 |
Top three noisy pixels from each quadrant. If the there are fewer than three noisy pixels in the level2.evt file, extra rows are filled as -1
| Pixel properties | Quadrant properties | ||||||
|---|---|---|---|---|---|---|---|
| Quadrant | DetID | PixID | Counts | Sigma | Mean | Median | Sigma |
| A | 10 | 83 | 486591 | 3949.62 | 601 | 589 | 123.1 |
| A | 12 | 189 | 45709 | 366.68 | 601 | 589 | 123.1 |
| A | 13 | 254 | 7160 | 53.4 | 601 | 589 | 123.1 |
| B | 0 | 190 | 83495 | 711.38 | 601 | 584 | 116.6 |
| B | 5 | 255 | 20700 | 172.6 | 601 | 584 | 116.6 |
| B | 12 | 111 | 14995 | 123.65 | 601 | 584 | 116.6 |
| C | 9 | 187 | 3263981 | 24138.85 | 579 | 582 | 135.2 |
| C | 15 | 214 | 228951 | 1689.21 | 579 | 582 | 135.2 |
| C | 12 | 249 | 8611 | 59.39 | 579 | 582 | 135.2 |
| D | 1 | 52 | 265331 | 1925.1 | 553 | 537 | 137.5 |
| D | 2 | 250 | 183281 | 1328.58 | 553 | 537 | 137.5 |
| D | 6 | 239 | 177836 | 1289.0 | 553 | 537 | 137.5 |
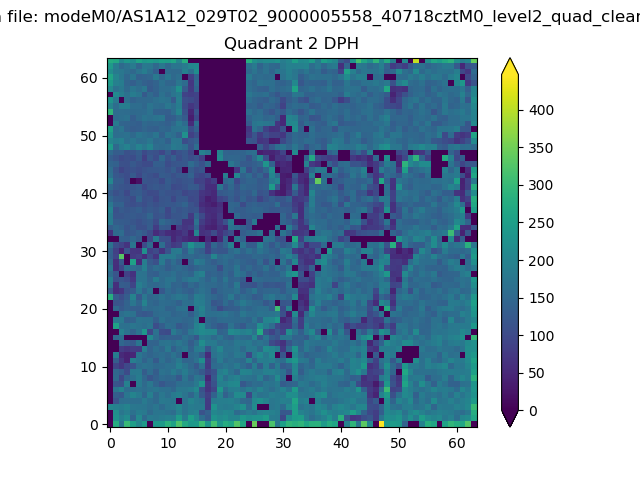
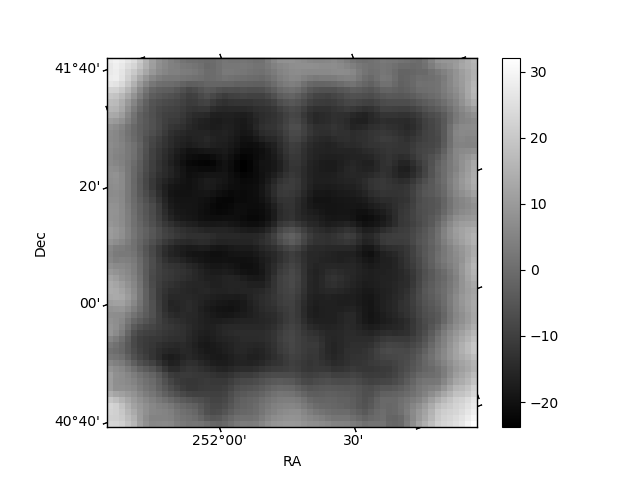
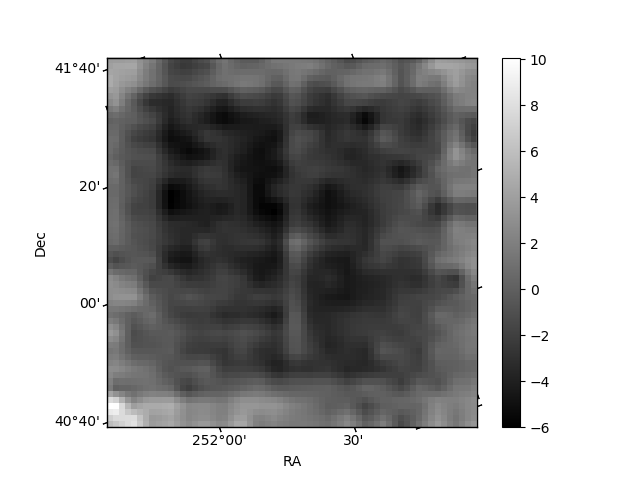
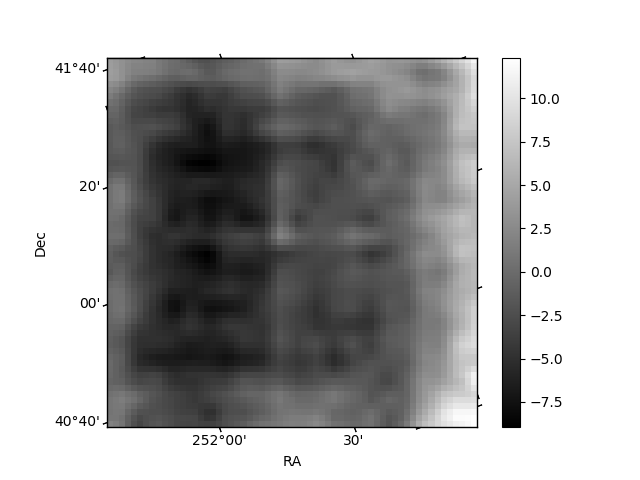
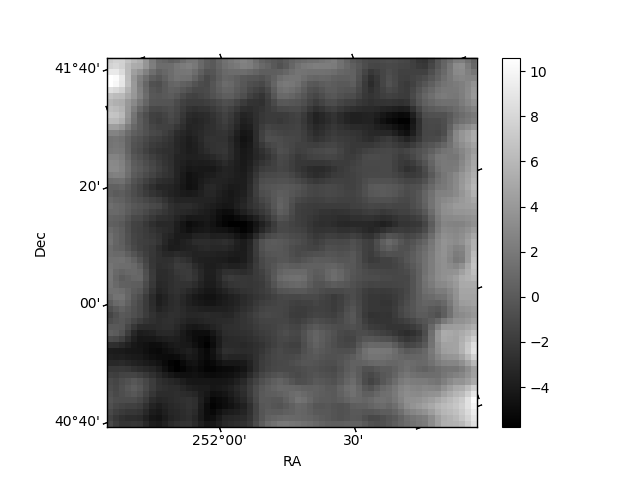
Histogram calculated using DETX and DETY for each event in the final _common_clean file
| Quadrant A | 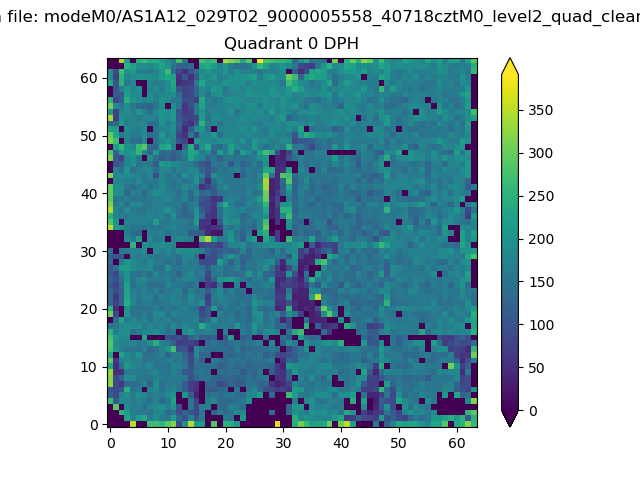 |
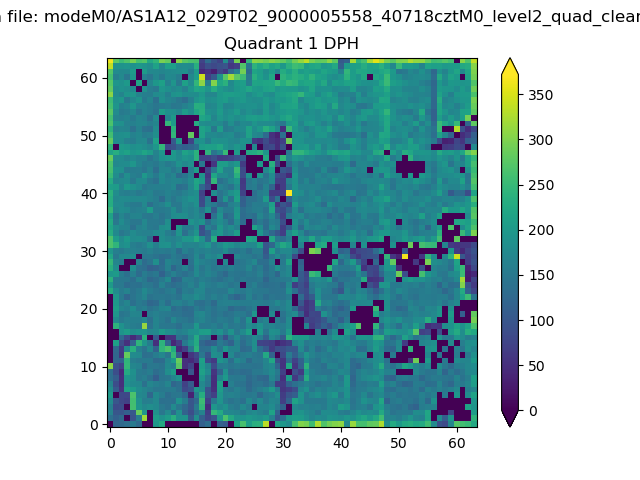 |
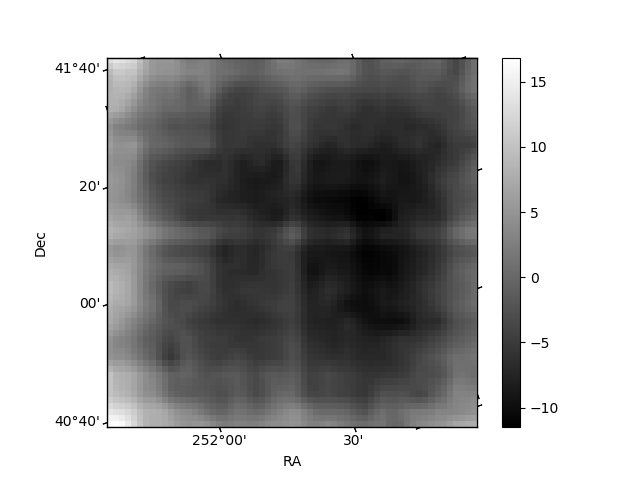
Quadrant B |
|---|---|---|---|
| Quadrant D | 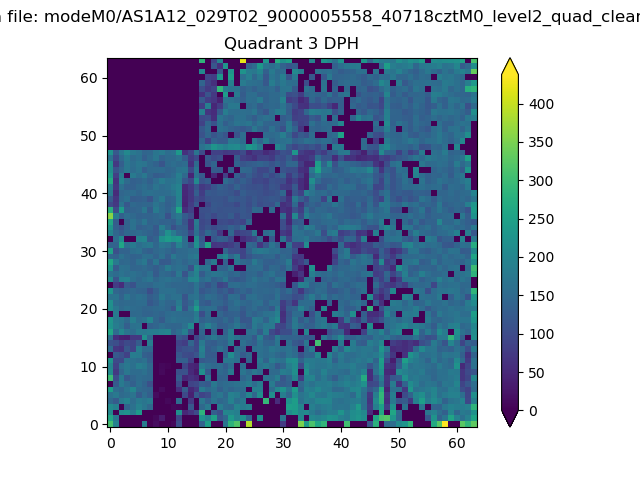 |
 |
Quadrant C |
| Plot type | Count rate plots | Images |
|---|---|---|
| Comparison with Poisson distribution Blue bars denote a histogram of data divided into 1 sec bins. Red curve is a Poisson curve with rate = median count rate of data. |
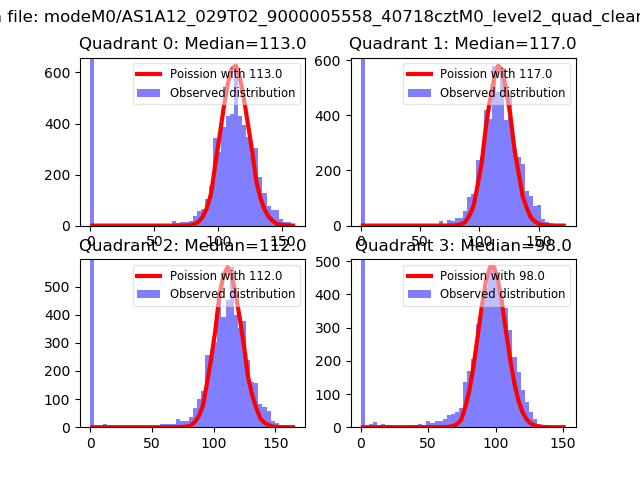 |
 |
| Quadrant-wise count rates Data is divided into 100 sec bins |
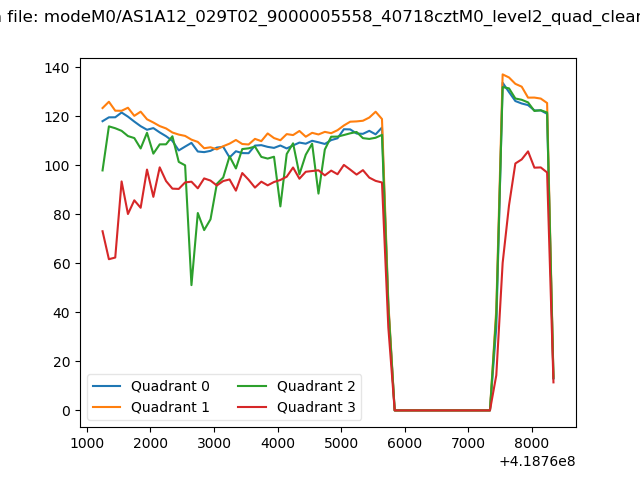 |
|
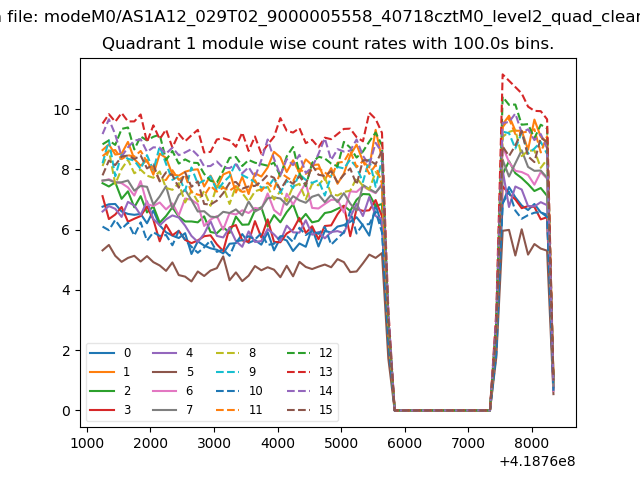
| Module-wise count rates for Quadrant A Data is divided into 100 sec bins |
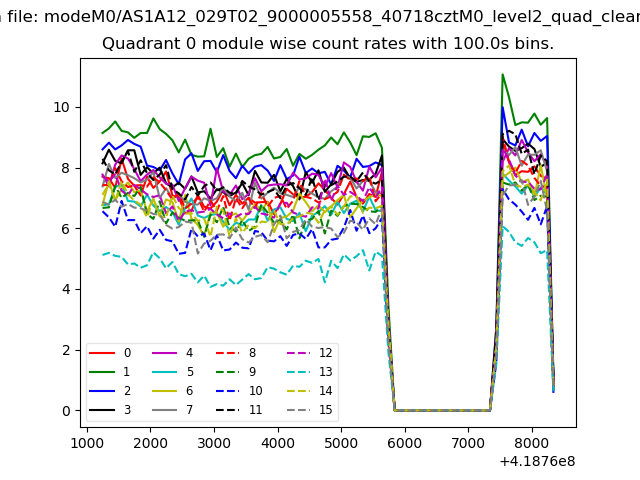 |
 |
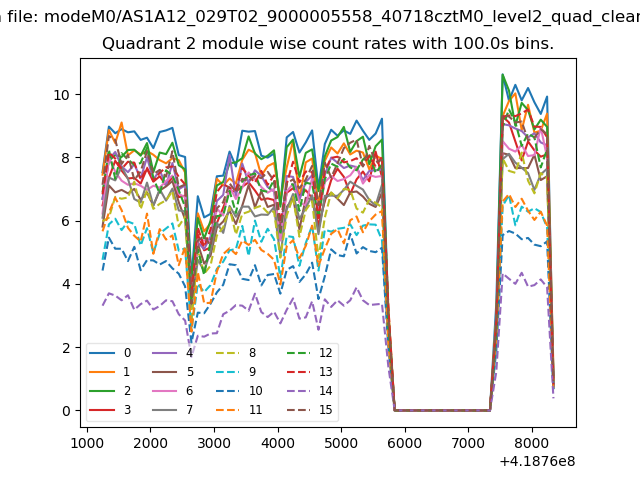
| Module-wise count rates for Quadrant B Data is divided into 100 sec bins |
 |
 |
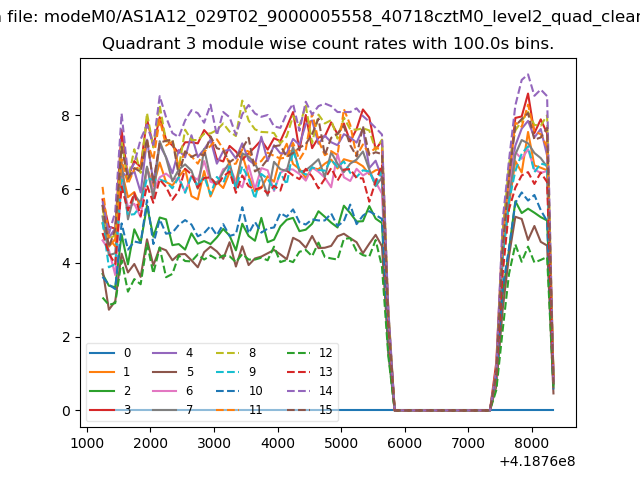
| Module-wise count rates for Quadrant C Data is divided into 100 sec bins |
 |
 |
| Module-wise count rates for Quadrant D Data is divided into 100 sec bins |
 |
 |
| Parameter | Plot |
|---|---|
| CZT HV Monitor | 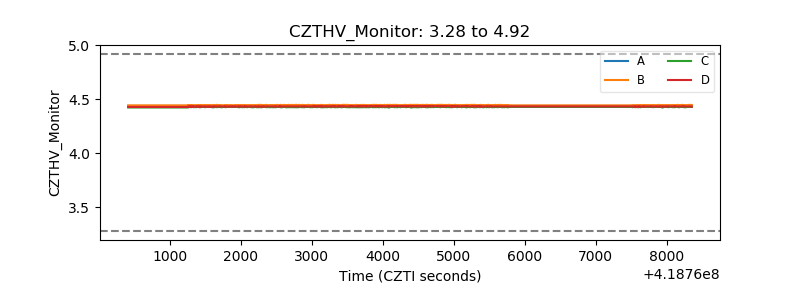 |
| D_VDD | 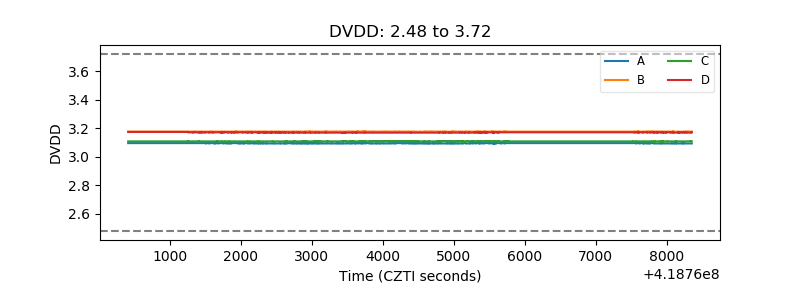 |
| Temperature 1 | 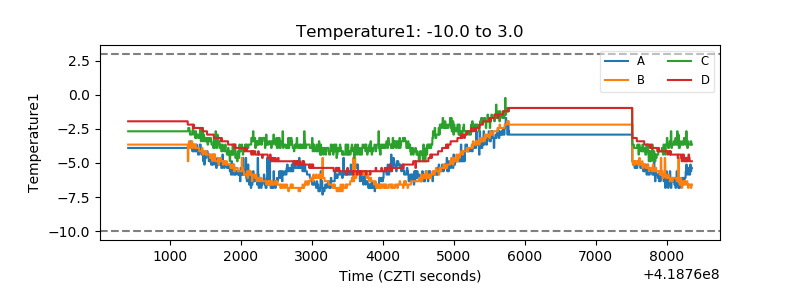 |
| Veto HV Monitor | 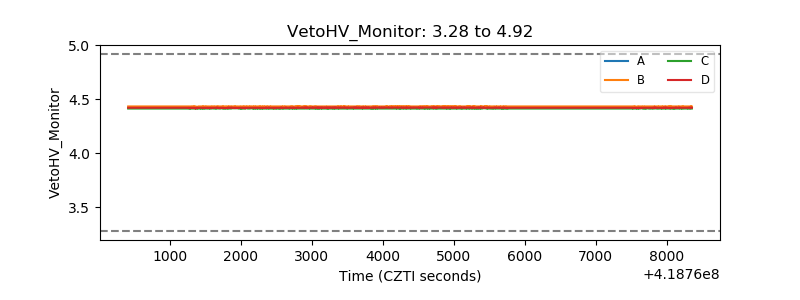 |
| Veto LLD | 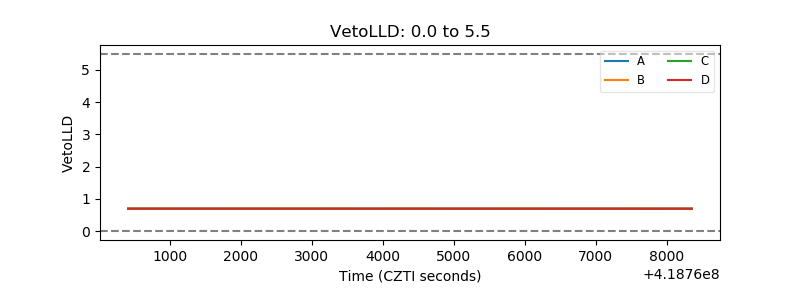 |
| Alpha Counter | 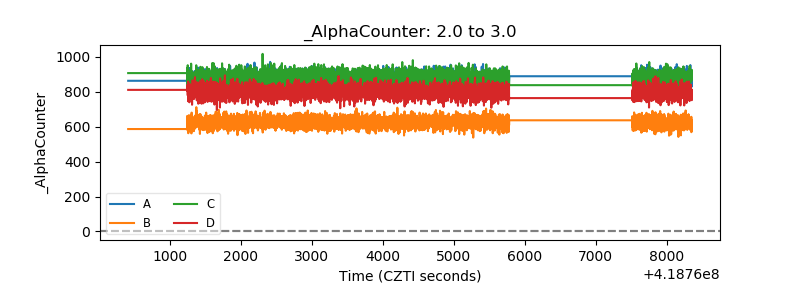 |
| _CPM_Rate | 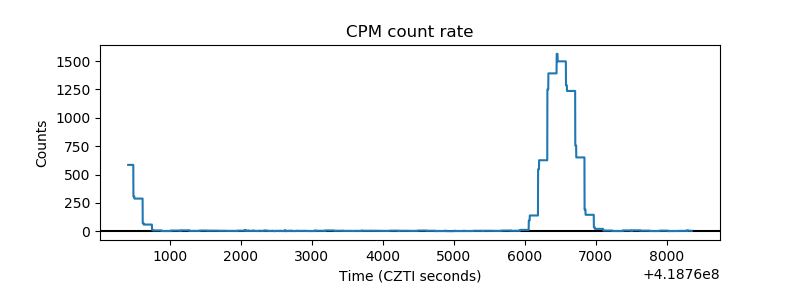 |
| CZT Counter | 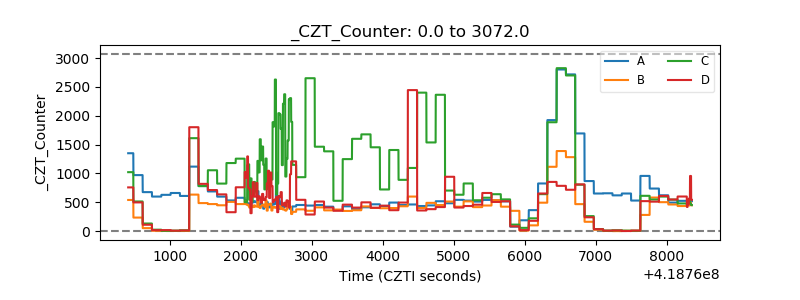 |
| +2.5 Volts monitor | 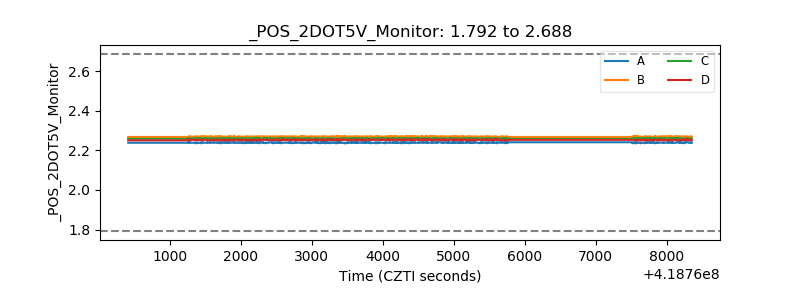 |
| +5 Volts monitor | 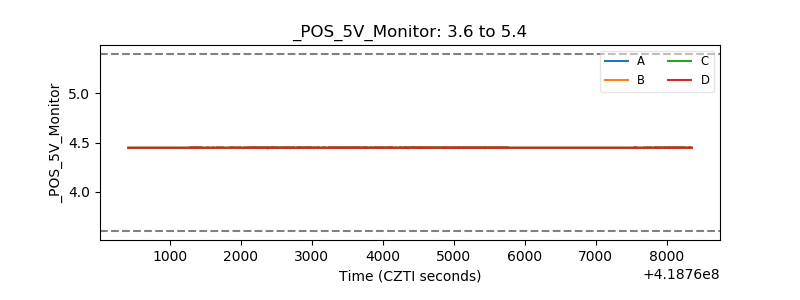 |
| _ROLL_ROT | 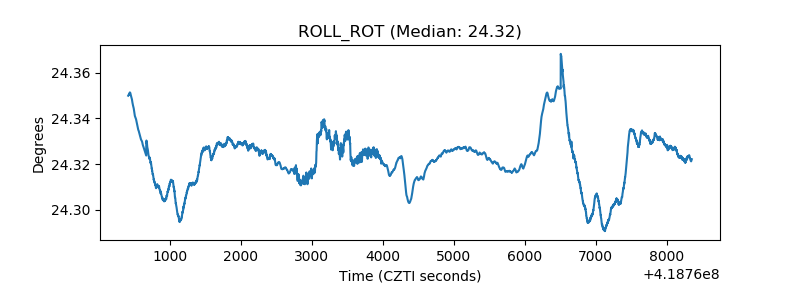 |
| _Roll_DEC | 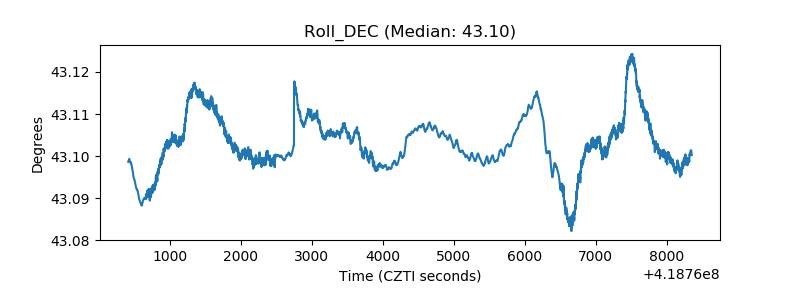 |
| _Roll_RA | 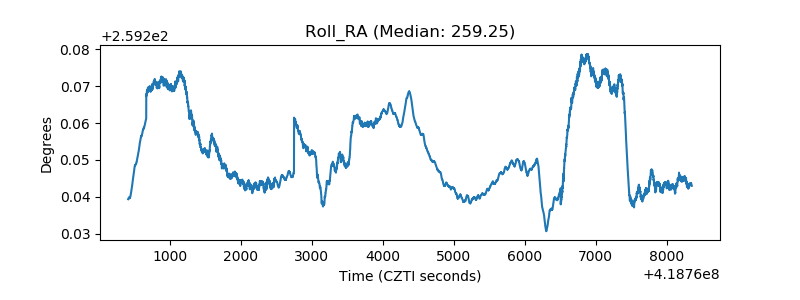 |
| Veto Counter | 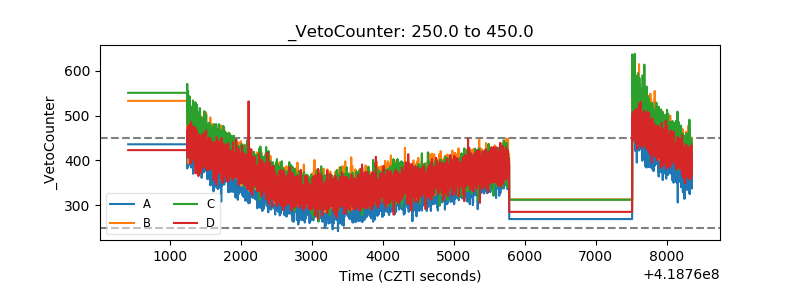 |