| Param | Original file | Final file |
|---|---|---|
| Filename | modeM0/AS1A12_029T02_9000005558_40719cztM0_level2.fits | modeM0/AS1A12_029T02_9000005558_40719cztM0_level2_quad_clean.evt |
| Size (bytes) | 99,895,680 | 28,696,320 |
| Size | 95.3 MB | 27.4 MB |
| Events in quadrant A | 918,001 | 194,927 |
| Events in quadrant B | 783,333 | 202,988 |
| Events in quadrant C | 847,944 | 196,512 |
| Events in quadrant D | 1,018,648 | 154,861 |
| Mode M0 | |||
|---|---|---|---|
| Quadrant | BADHDUFLAG | Total packets | Discarded packets |
| A | 0 | 3793 | 1 |
| B | 0 | 3387 | 1 |
| C | 0 | 3513 | 1 |
| D | 0 | 4171 | 1 |
| Mode M9 | |||
|---|---|---|---|
| Quadrant | BADHDUFLAG | Total packets | Discarded packets |
| A | 0 | 14 | 0 |
| B | 0 | 14 | 0 |
| C | 0 | 14 | 0 |
| D | 0 | 15 | 0 |
| Mode SS | |||
|---|---|---|---|
| Quadrant | BADHDUFLAG | Total packets | Discarded packets |
| A | 0 | 32 | 0 |
| B | 0 | 32 | 0 |
| C | 0 | 32 | 0 |
| D | 0 | 32 | 0 |
| Quadrant | Total seconds | Saturated seconds | Saturation percentage |
|---|---|---|---|
| A | 1630 | 6 | 0.368098% |
| B | 1630 | 1 | 0.061350% |
| C | 1630 | 2 | 0.122699% |
| D | 1630 | 248 | 15.214724% |
Noise dominated data is calculated using 1-second bins in cleaned event files. If a bin has >2000 counts, and if more than 50% of those come from <1% of pixels, then it is considered to be noise-dominated and hence unusable.
| Quadrant | # 1 sec bins | Bins with >0 counts | Bins with >2000 counts | High rate bins dominated by noise | Noise dominated (total time) | Noise dominated (detector-on time) | Marked lightcurve |
|---|---|---|---|---|---|---|---|
| A | 1630 | 1630 | 2 | 2 | 0.12% | 0.12% | 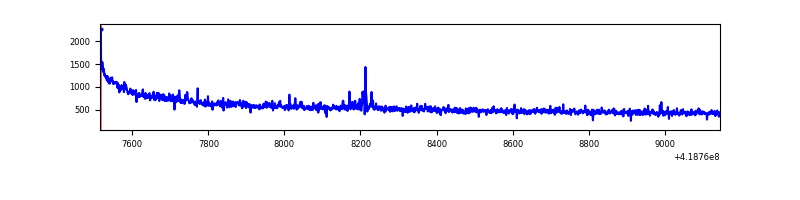 |
| B | 1630 | 1630 | 0 | 0 | 0.00% | 0.00% | 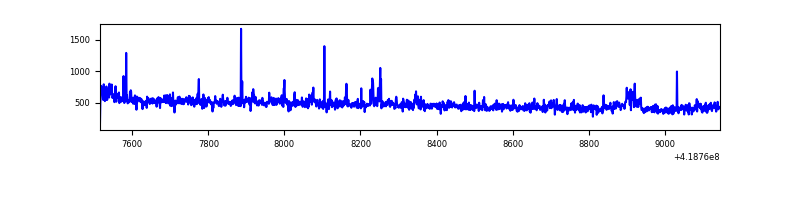 |
| C | 1630 | 1630 | 1 | 1 | 0.06% | 0.06% | 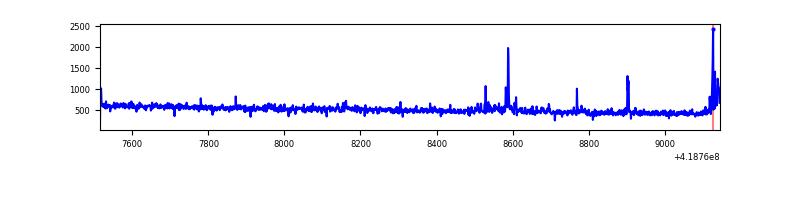 |
| D | 1630 | 1630 | 34 | 34 | 2.09% | 2.09% | 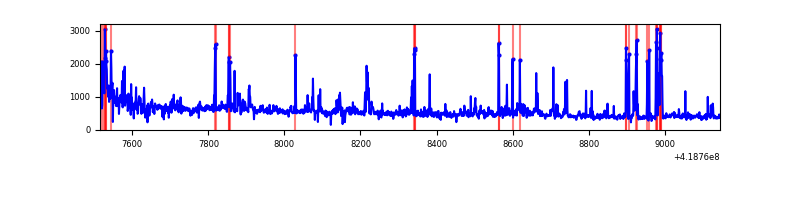 |
Top three noisy pixels from each quadrant. If the there are fewer than three noisy pixels in the level2.evt file, extra rows are filled as -1
| Pixel properties | Quadrant properties | ||||||
|---|---|---|---|---|---|---|---|
| Quadrant | DetID | PixID | Counts | Sigma | Mean | Median | Sigma |
| A | 10 | 83 | 187262 | 4795.69 | 183 | 179 | 39.0 |
| A | 12 | 189 | 21942 | 557.87 | 183 | 179 | 39.0 |
| A | 13 | 254 | 2838 | 68.16 | 183 | 179 | 39.0 |
| B | 0 | 190 | 40697 | 1071.71 | 186 | 181 | 37.8 |
| B | 5 | 255 | 7890 | 203.92 | 186 | 181 | 37.8 |
| B | 12 | 111 | 4431 | 112.42 | 186 | 181 | 37.8 |
| C | 15 | 214 | 72725 | 1601.89 | 187 | 188 | 45.3 |
| C | 9 | 187 | 35240 | 774.08 | 187 | 188 | 45.3 |
| C | 12 | 249 | 7568 | 162.98 | 187 | 188 | 45.3 |
| D | 2 | 250 | 99807 | 2321.5 | 168 | 163 | 42.9 |
| D | 1 | 52 | 79524 | 1848.95 | 168 | 163 | 42.9 |
| D | 12 | 191 | 60422 | 1403.91 | 168 | 163 | 42.9 |
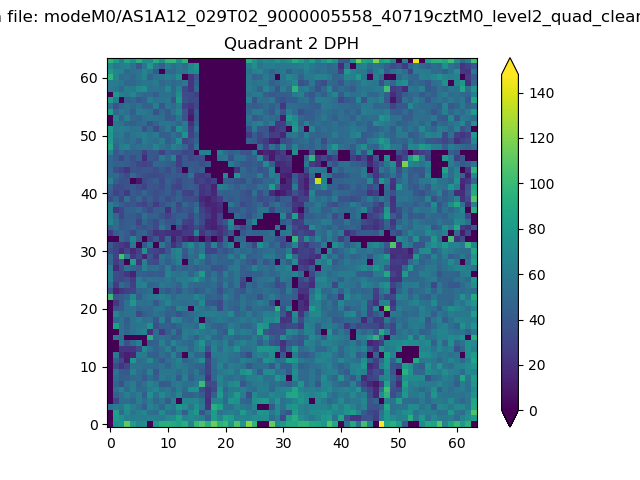
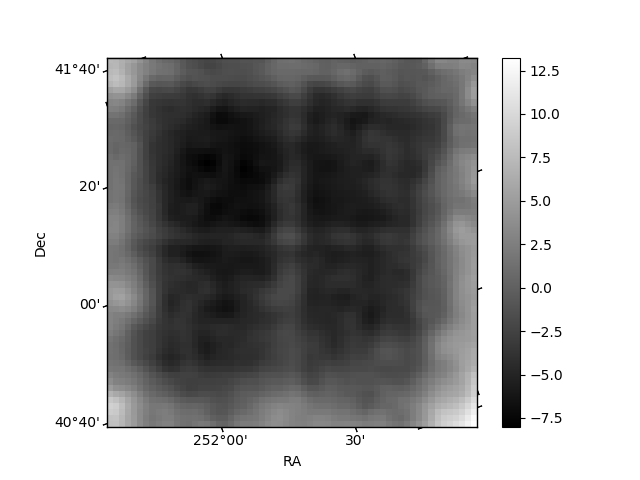
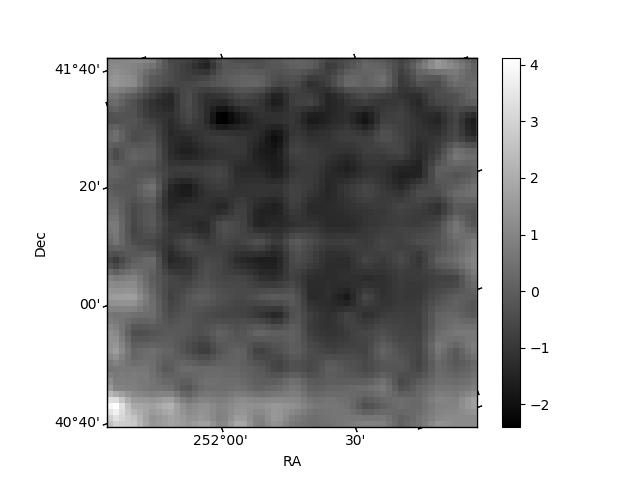
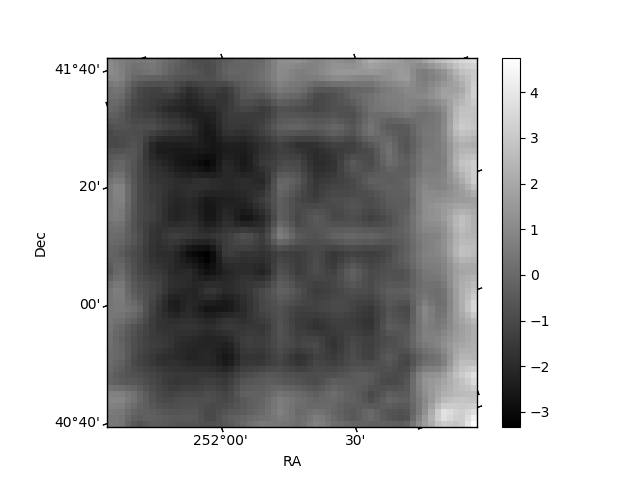
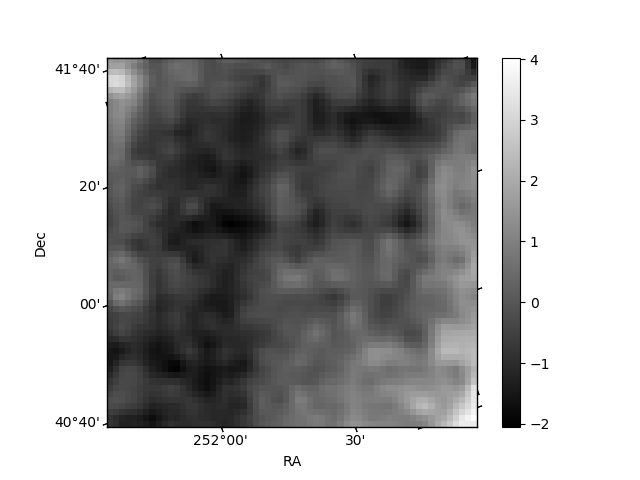
Histogram calculated using DETX and DETY for each event in the final _common_clean file
| Quadrant A | 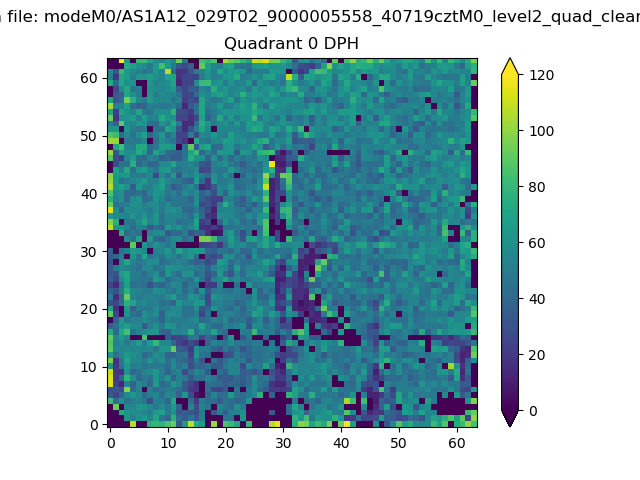 |
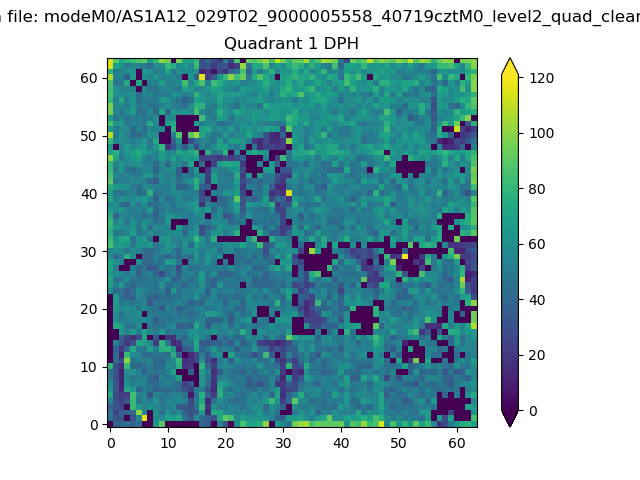 |
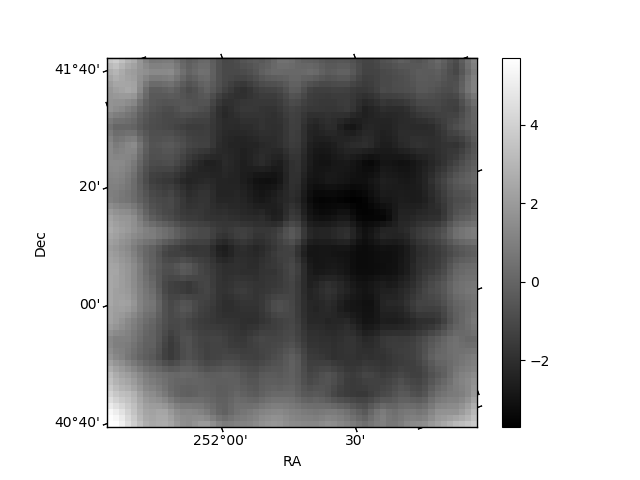
Quadrant B |
|---|---|---|---|
| Quadrant D | 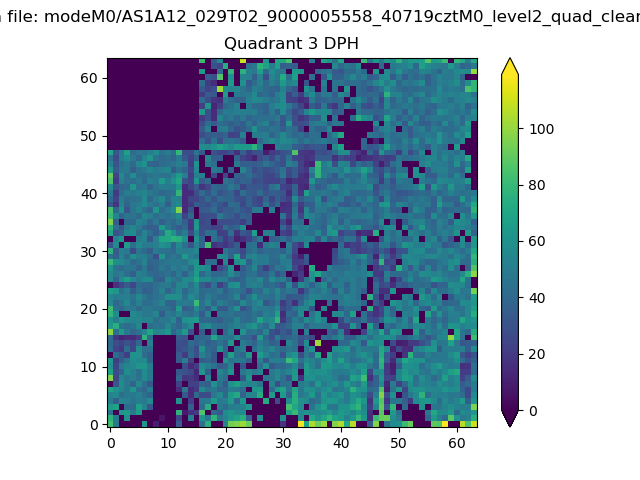 |
 |
Quadrant C |
| Plot type | Count rate plots | Images |
|---|---|---|
| Comparison with Poisson distribution Blue bars denote a histogram of data divided into 1 sec bins. Red curve is a Poisson curve with rate = median count rate of data. |
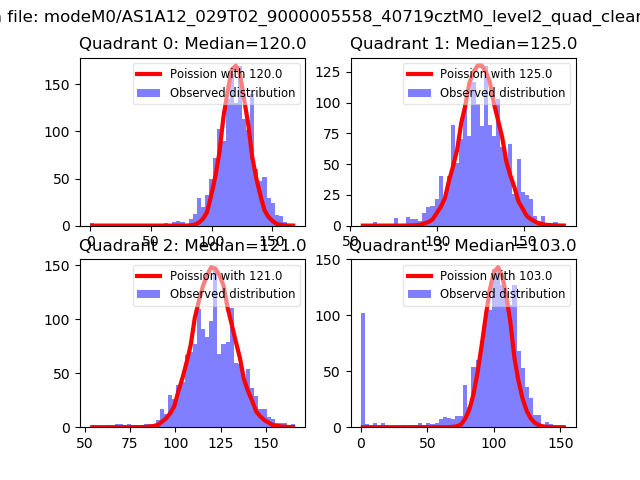 |
 |
| Quadrant-wise count rates Data is divided into 100 sec bins |
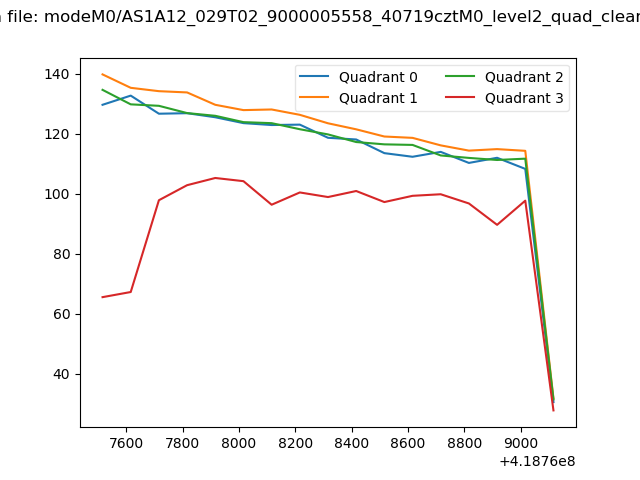 |
|
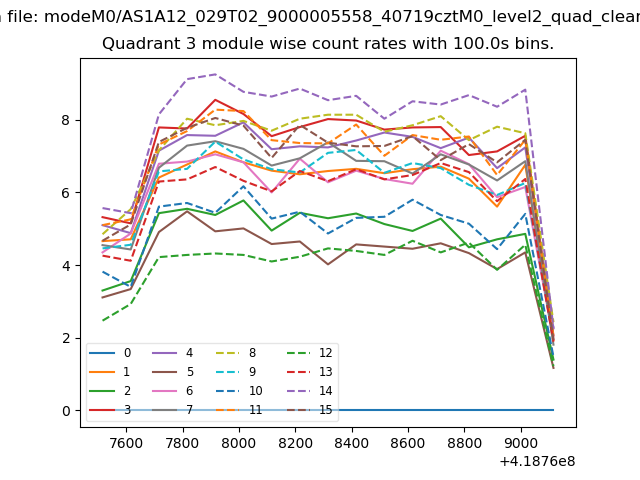
| Module-wise count rates for Quadrant A Data is divided into 100 sec bins |
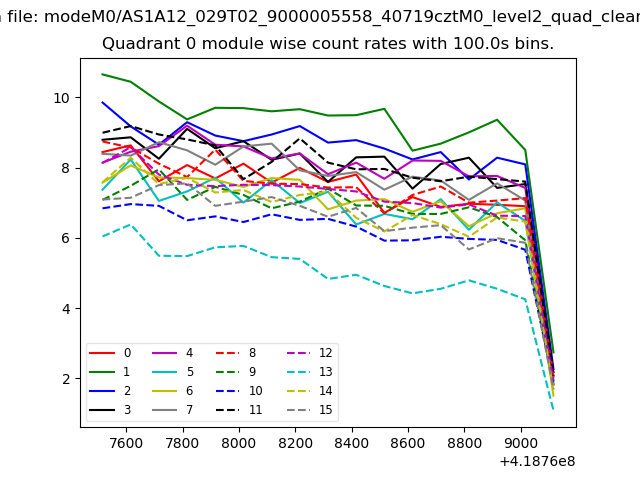 |
 |
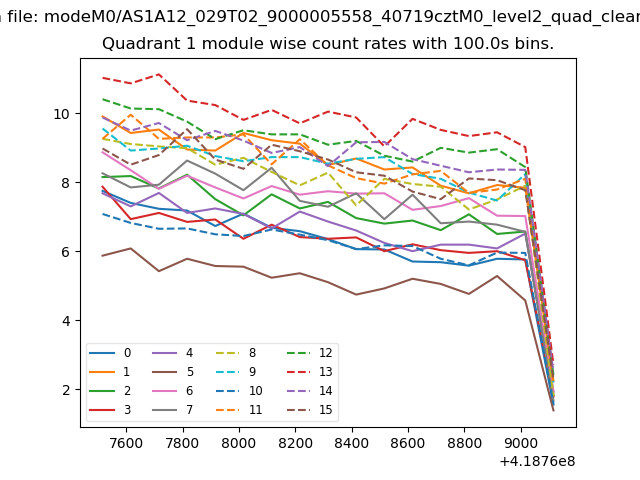
| Module-wise count rates for Quadrant B Data is divided into 100 sec bins |
 |
 |
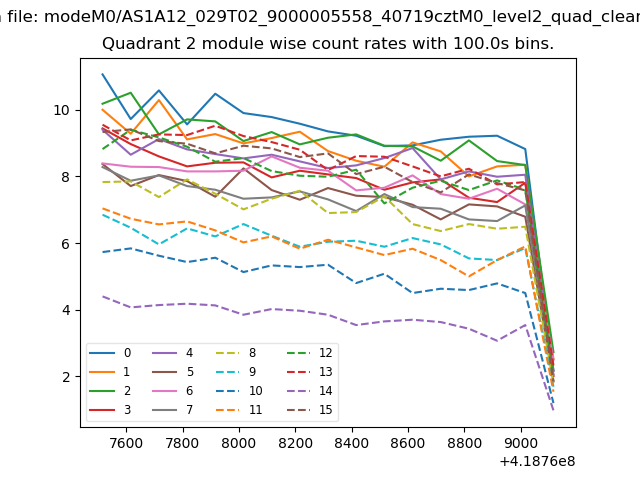
| Module-wise count rates for Quadrant C Data is divided into 100 sec bins |
 |
 |
| Module-wise count rates for Quadrant D Data is divided into 100 sec bins |
 |
 |
| Parameter | Plot |
|---|---|
| CZT HV Monitor | 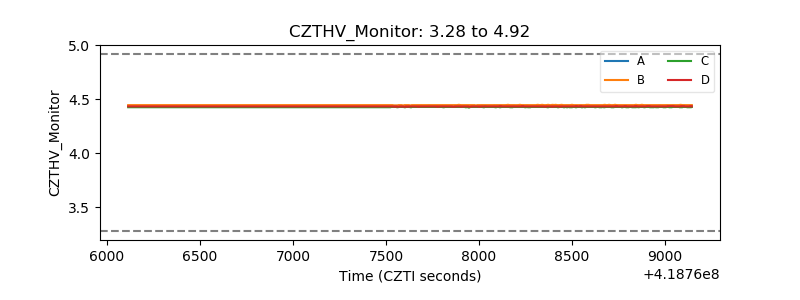 |
| D_VDD | 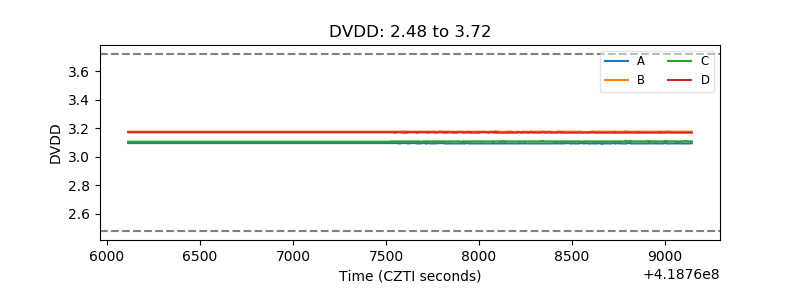 |
| Temperature 1 | 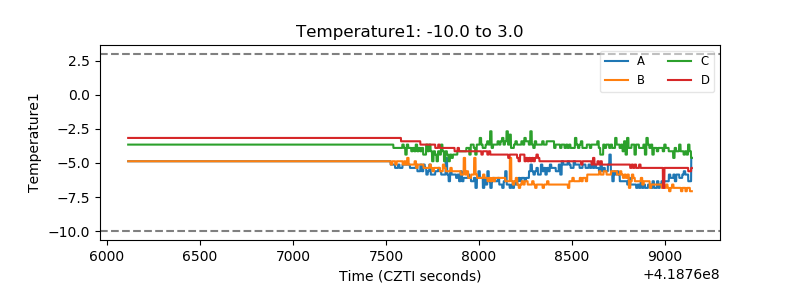 |
| Veto HV Monitor | 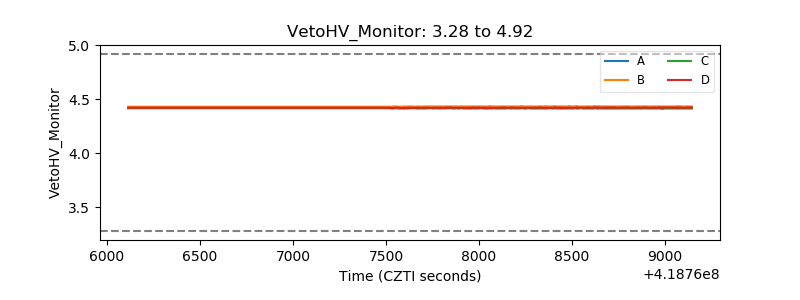 |
| Veto LLD | 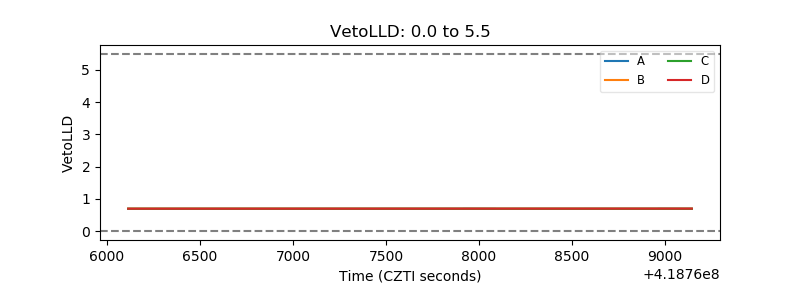 |
| Alpha Counter | 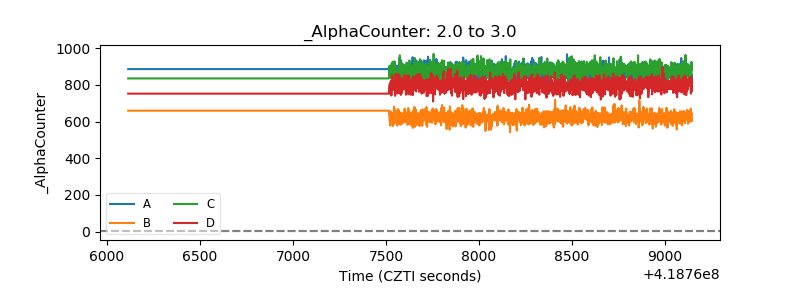 |
| _CPM_Rate | 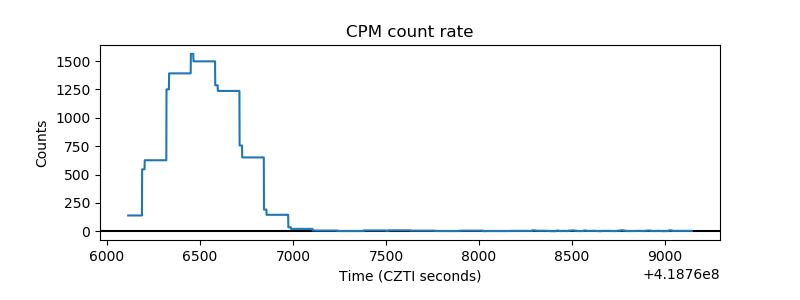 |
| CZT Counter | 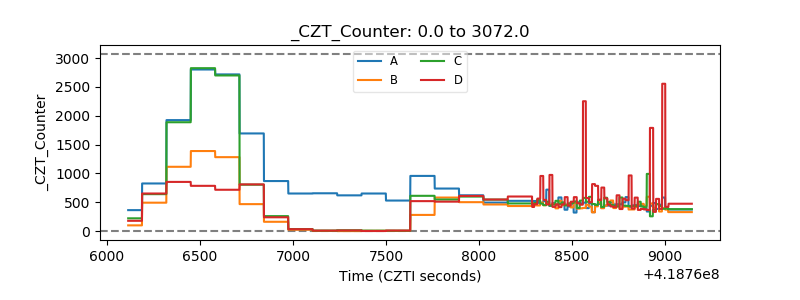 |
| +2.5 Volts monitor | 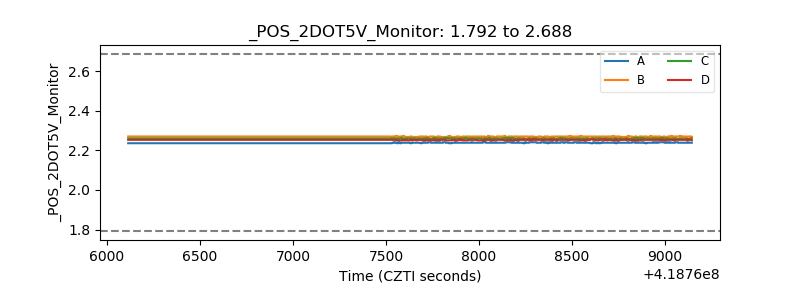 |
| +5 Volts monitor |  |
| _ROLL_ROT | 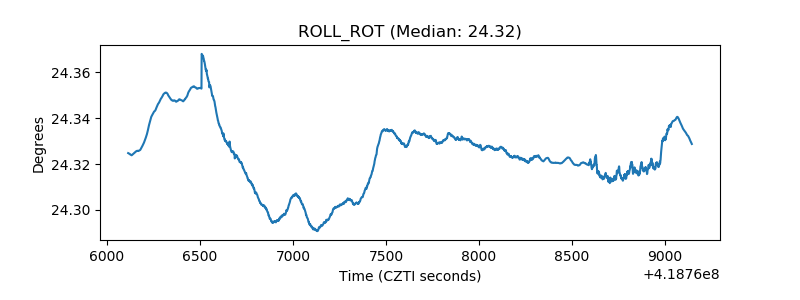 |
| _Roll_DEC |  |
| _Roll_RA | 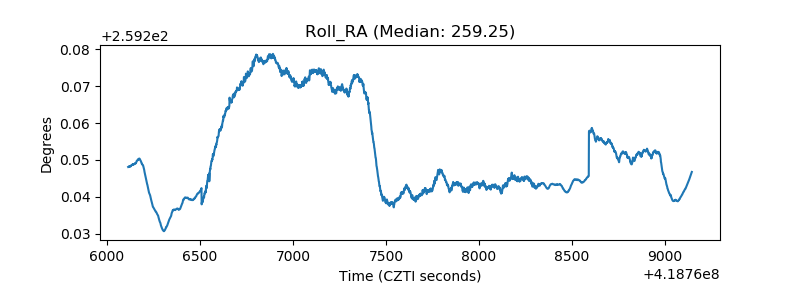 |
| Veto Counter | 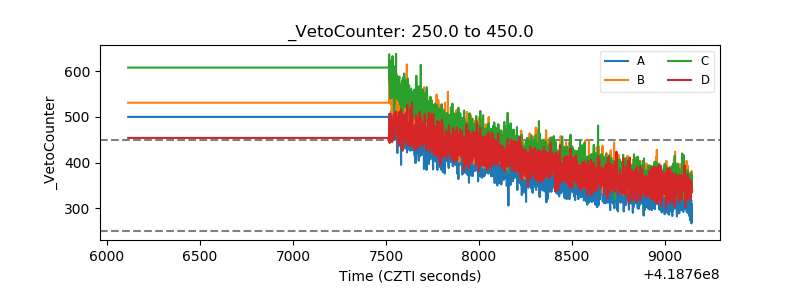 |