| Param | Original file | Final file |
|---|---|---|
| Filename | modeM0/AS1A12_042T01_9000005560_40719cztM0_level2.fits | modeM0/AS1A12_042T01_9000005560_40719cztM0_level2_quad_clean.evt |
| Size (bytes) | 175,078,080 | 50,639,040 |
| Size | 167.0 MB | 48.3 MB |
| Events in quadrant A | 1,544,638 | 342,286 |
| Events in quadrant B | 1,495,125 | 356,662 |
| Events in quadrant C | 1,752,151 | 339,576 |
| Events in quadrant D | 1,460,448 | 287,520 |
| Mode M0 | |||
|---|---|---|---|
| Quadrant | BADHDUFLAG | Total packets | Discarded packets |
| A | 0 | 6294 | 2 |
| B | 0 | 6271 | 1 |
| C | 0 | 6985 | 1 |
| D | 0 | 6331 | 1 |
| Mode M9 | |||
|---|---|---|---|
| Quadrant | BADHDUFLAG | Total packets | Discarded packets |
| A | 0 | 19 | 0 |
| B | 0 | 19 | 0 |
| C | 0 | 19 | 0 |
| D | 0 | 19 | 0 |
| Mode SS | |||
|---|---|---|---|
| Quadrant | BADHDUFLAG | Total packets | Discarded packets |
| A | 0 | 60 | 0 |
| B | 0 | 60 | 0 |
| C | 0 | 60 | 0 |
| D | 0 | 60 | 0 |
| Quadrant | Total seconds | Saturated seconds | Saturation percentage |
|---|---|---|---|
| A | 2908 | 9 | 0.309491% |
| B | 2908 | 9 | 0.309491% |
| C | 2908 | 35 | 1.203576% |
| D | 2908 | 257 | 8.837689% |
Noise dominated data is calculated using 1-second bins in cleaned event files. If a bin has >2000 counts, and if more than 50% of those come from <1% of pixels, then it is considered to be noise-dominated and hence unusable.
| Quadrant | # 1 sec bins | Bins with >0 counts | Bins with >2000 counts | High rate bins dominated by noise | Noise dominated (total time) | Noise dominated (detector-on time) | Marked lightcurve |
|---|---|---|---|---|---|---|---|
| A | 4791 | 2909 | 2 | 2 | 0.04% | 0.07% | 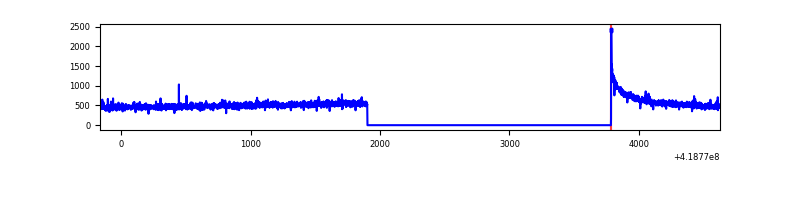 |
| B | 4791 | 2909 | 1 | 1 | 0.02% | 0.03% | 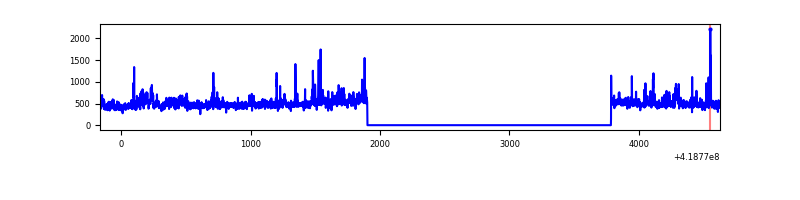 |
| C | 4791 | 2909 | 34 | 34 | 0.71% | 1.17% | 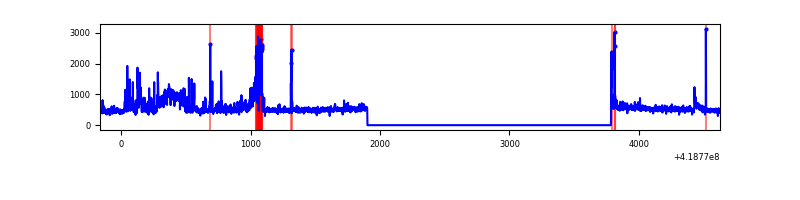 |
| D | 4791 | 2909 | 7 | 7 | 0.15% | 0.24% | 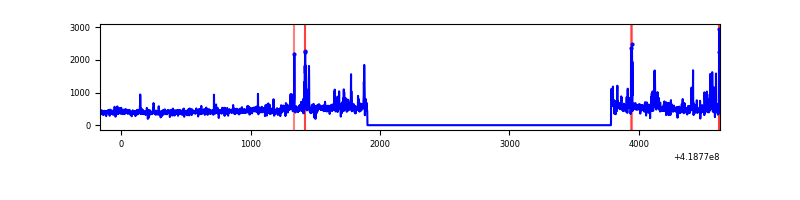 |
Top three noisy pixels from each quadrant. If the there are fewer than three noisy pixels in the level2.evt file, extra rows are filled as -1
| Pixel properties | Quadrant properties | ||||||
|---|---|---|---|---|---|---|---|
| Quadrant | DetID | PixID | Counts | Sigma | Mean | Median | Sigma |
| A | 10 | 83 | 252596 | 3683.57 | 330 | 323 | 68.5 |
| A | 12 | 189 | 11766 | 167.09 | 330 | 323 | 68.5 |
| A | 13 | 254 | 4610 | 62.6 | 330 | 323 | 68.5 |
| B | 0 | 190 | 126934 | 1959.51 | 329 | 319 | 64.6 |
| B | 4 | 170 | 37283 | 572.06 | 329 | 319 | 64.6 |
| B | 0 | 230 | 13627 | 205.96 | 329 | 319 | 64.6 |
| C | 9 | 187 | 261305 | 3499.8 | 320 | 322 | 74.6 |
| C | 15 | 214 | 125455 | 1678.04 | 320 | 322 | 74.6 |
| C | 12 | 249 | 86764 | 1159.19 | 320 | 322 | 74.6 |
| D | 12 | 191 | 94652 | 1265.6 | 304 | 295 | 74.6 |
| D | 2 | 250 | 69028 | 921.91 | 304 | 295 | 74.6 |
| D | 2 | 153 | 45866 | 611.24 | 304 | 295 | 74.6 |
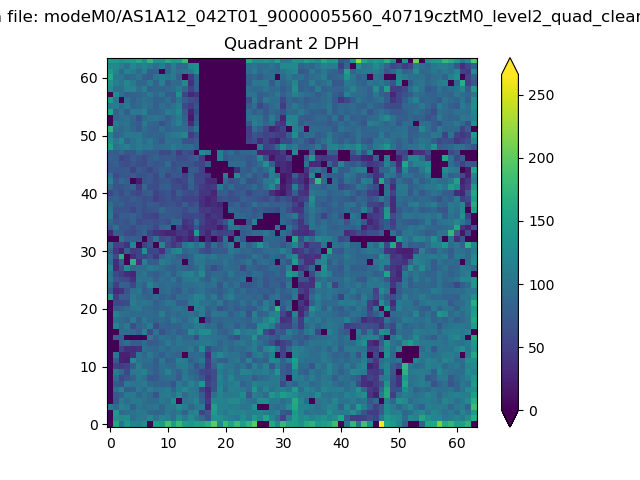
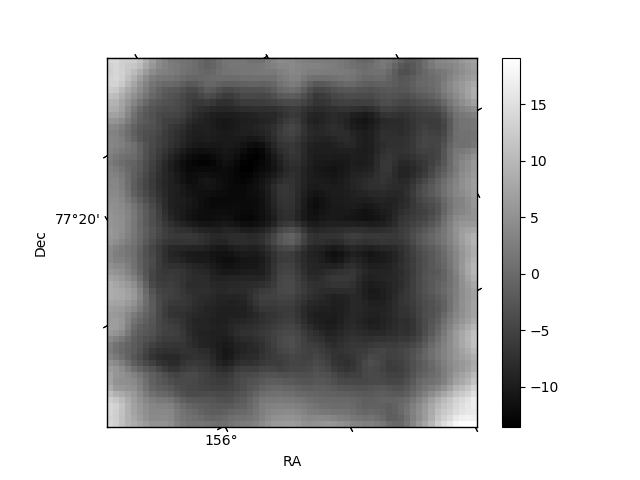
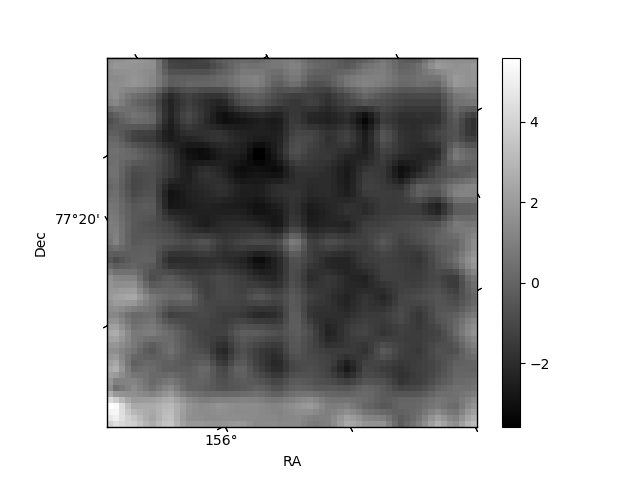
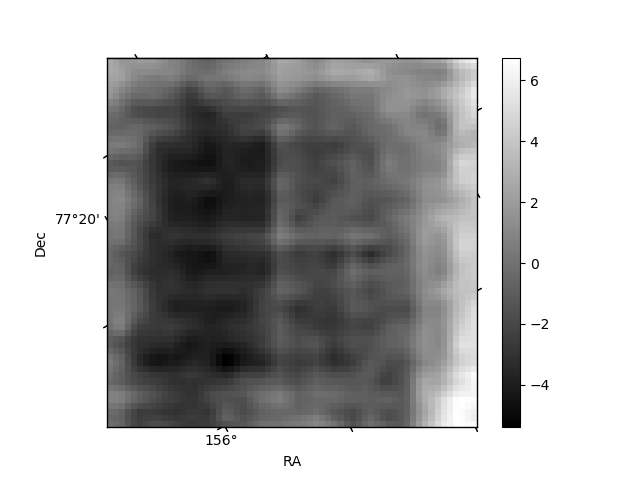
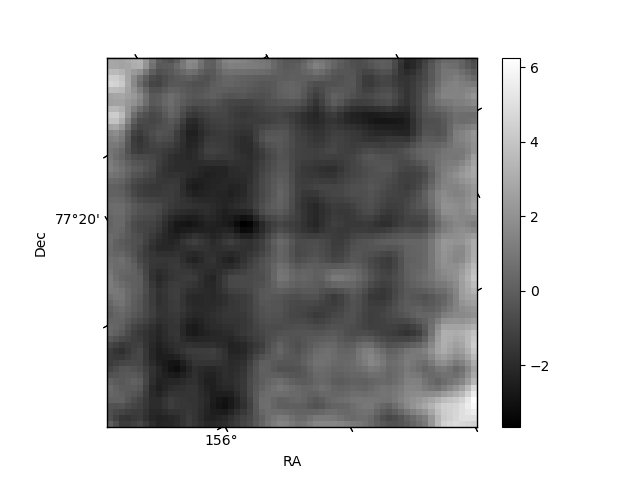
Histogram calculated using DETX and DETY for each event in the final _common_clean file
| Quadrant A | 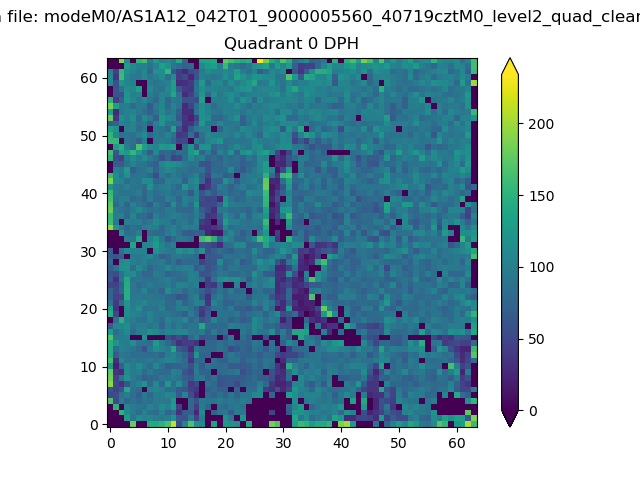 |
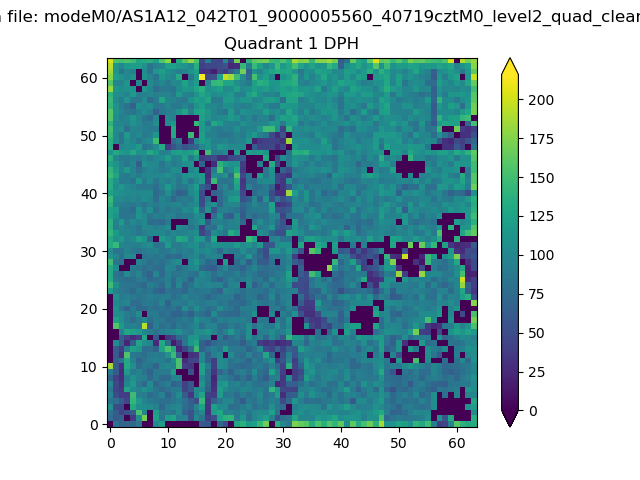 |
Quadrant B |
|---|---|---|---|
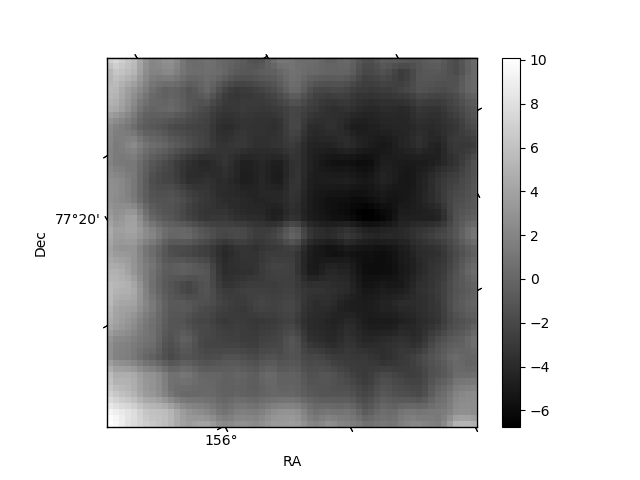
| Quadrant D | 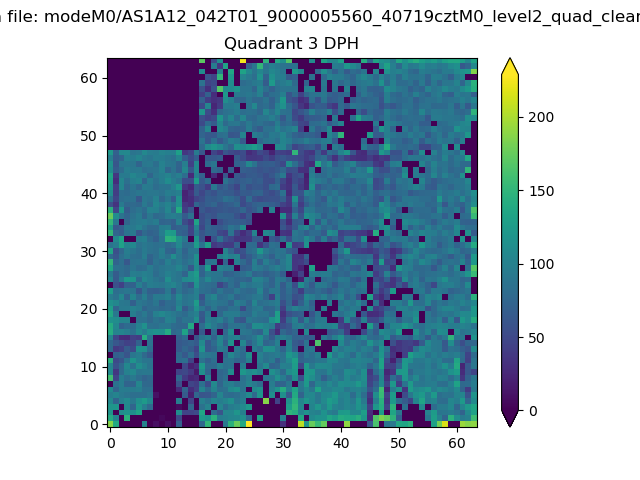 |
 |
Quadrant C |
| Plot type | Count rate plots | Images |
|---|---|---|
| Comparison with Poisson distribution Blue bars denote a histogram of data divided into 1 sec bins. Red curve is a Poisson curve with rate = median count rate of data. |
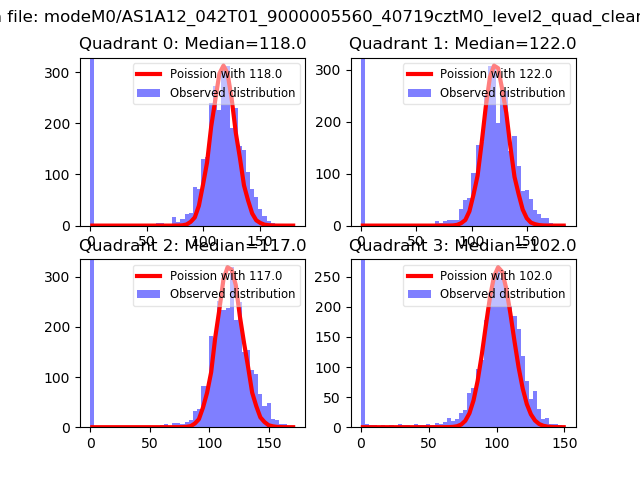 |
 |
| Quadrant-wise count rates Data is divided into 100 sec bins |
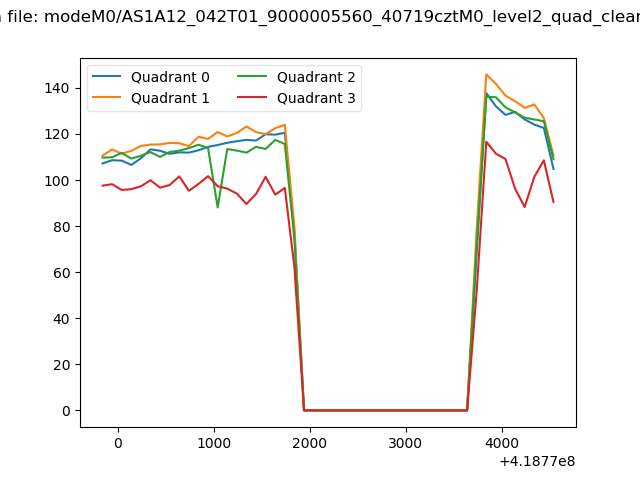 |
|
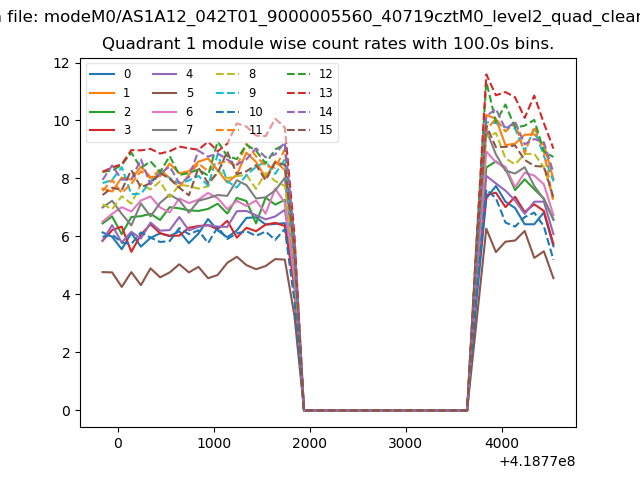
| Module-wise count rates for Quadrant A Data is divided into 100 sec bins |
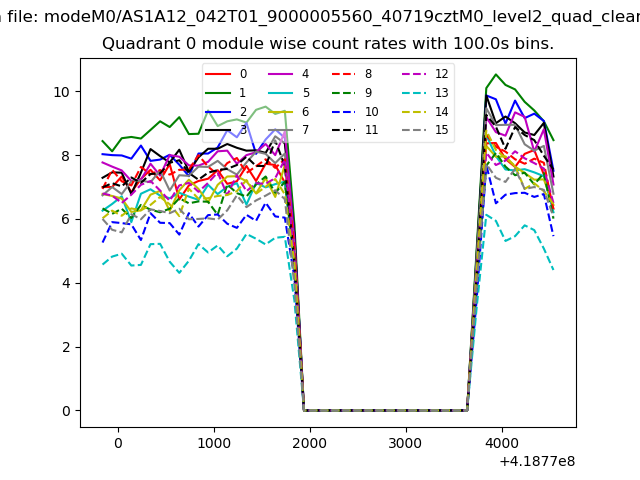 |
 |
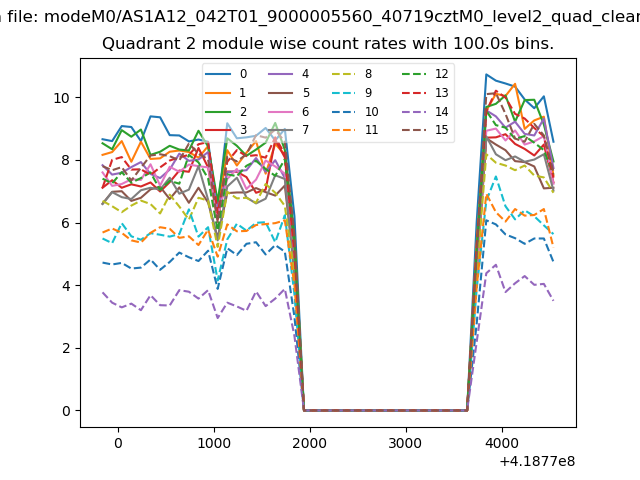
| Module-wise count rates for Quadrant B Data is divided into 100 sec bins |
 |
 |
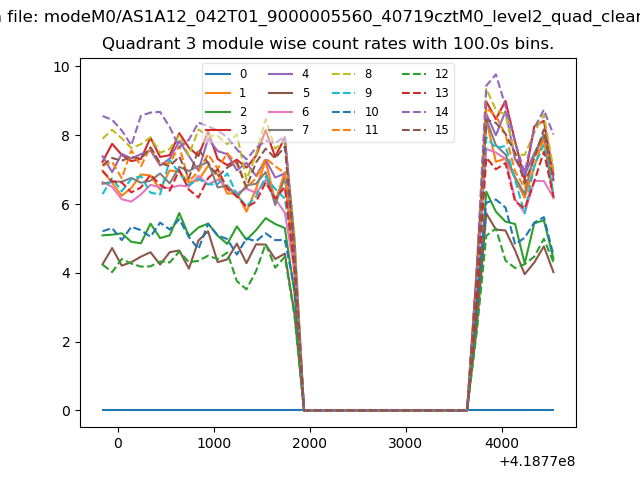
| Module-wise count rates for Quadrant C Data is divided into 100 sec bins |
 |
 |
| Module-wise count rates for Quadrant D Data is divided into 100 sec bins |
 |
 |
| Parameter | Plot |
|---|---|
| CZT HV Monitor | 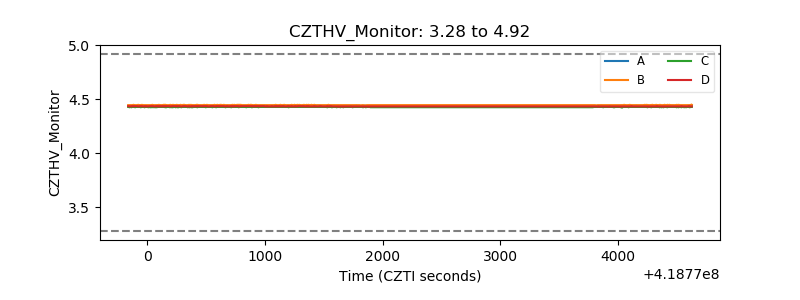 |
| D_VDD | 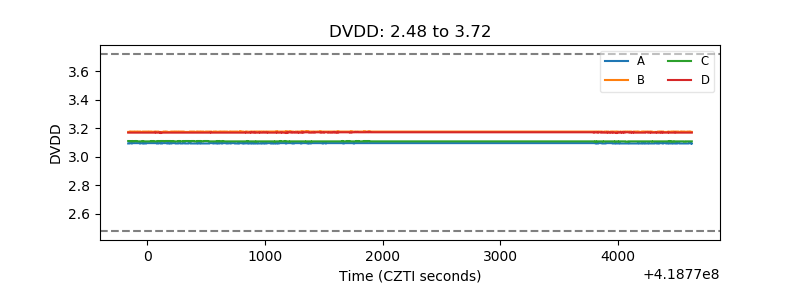 |
| Temperature 1 | 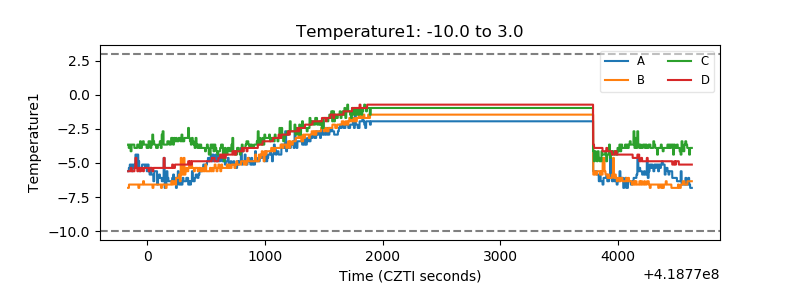 |
| Veto HV Monitor | 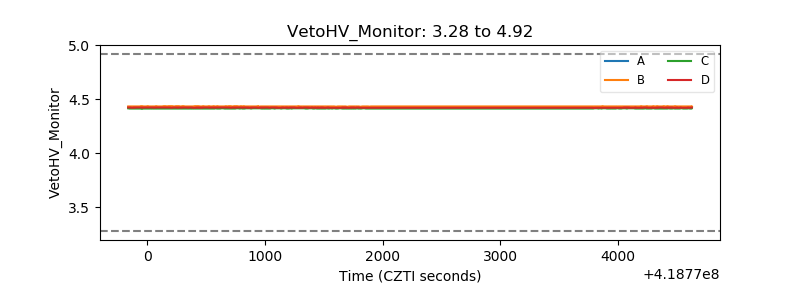 |
| Veto LLD | 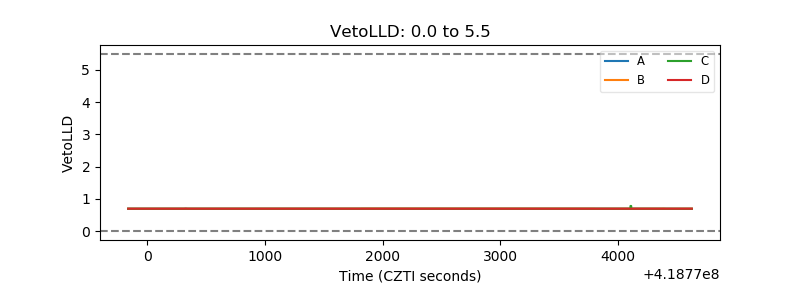 |
| Alpha Counter | 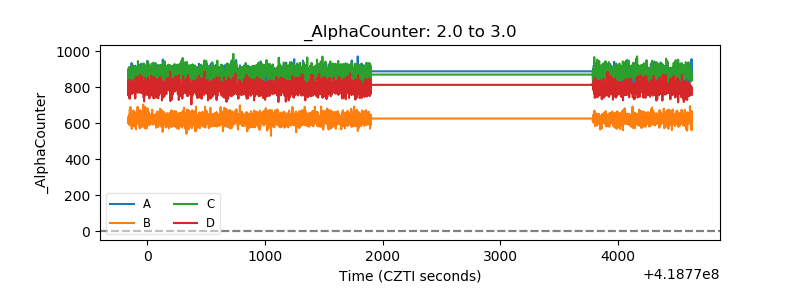 |
| _CPM_Rate | 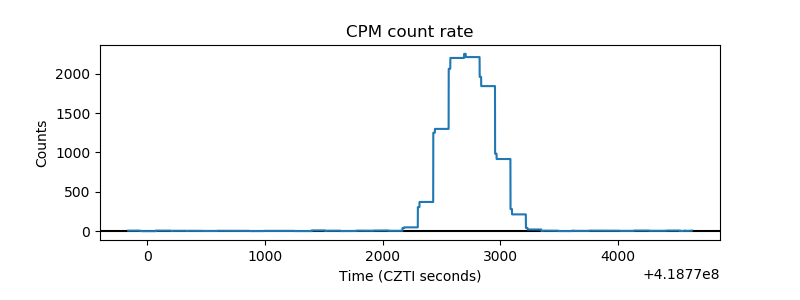 |
| CZT Counter | 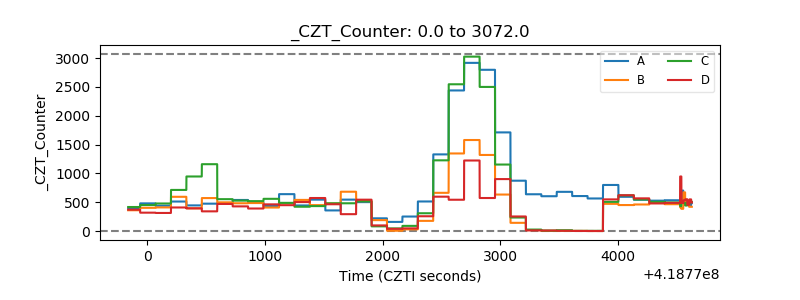 |
| +2.5 Volts monitor | 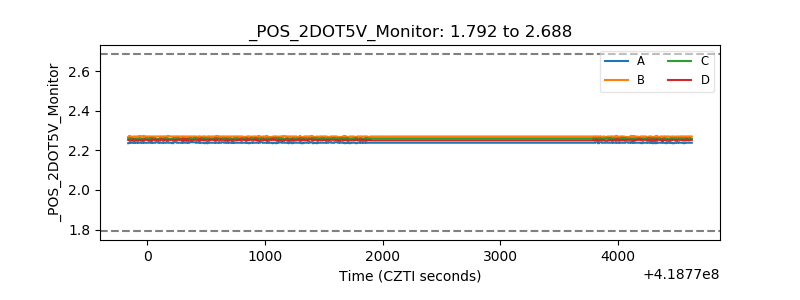 |
| +5 Volts monitor | 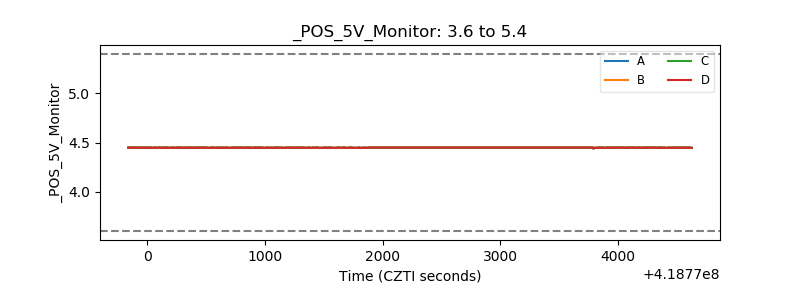 |
| _ROLL_ROT | 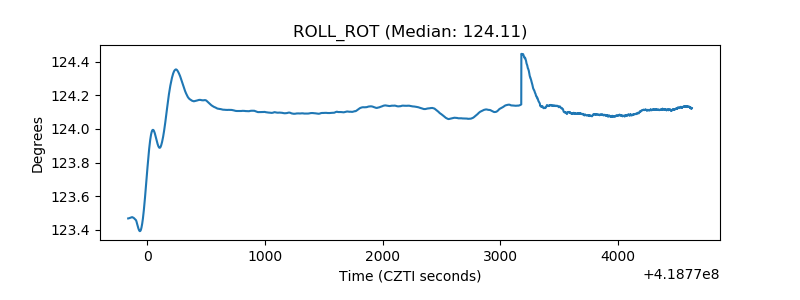 |
| _Roll_DEC |  |
| _Roll_RA | 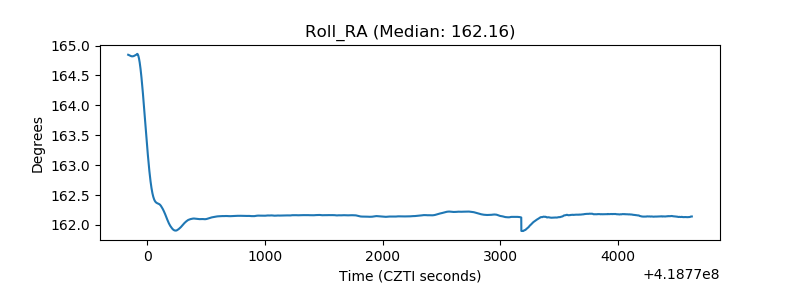 |
| Veto Counter | 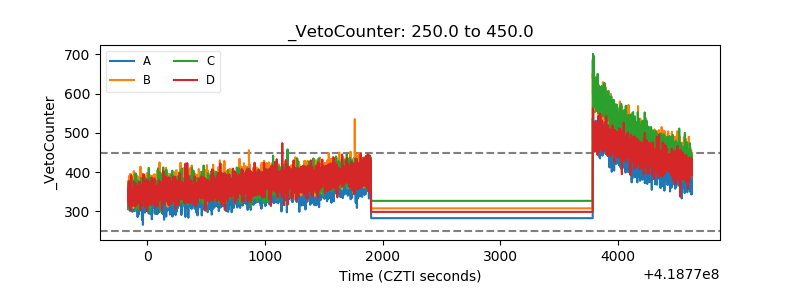 |