| Param | Original file | Final file |
|---|---|---|
| Filename | modeM0/AS1A12_042T01_9000005560_40720cztM0_level2.fits | modeM0/AS1A12_042T01_9000005560_40720cztM0_level2_quad_clean.evt |
| Size (bytes) | 327,844,800 | 88,116,480 |
| Size | 312.7 MB | 84.0 MB |
| Events in quadrant A | 2,665,130 | 600,220 |
| Events in quadrant B | 2,571,198 | 631,503 |
| Events in quadrant C | 3,784,611 | 576,946 |
| Events in quadrant D | 2,721,445 | 505,750 |
| Mode M0 | |||
|---|---|---|---|
| Quadrant | BADHDUFLAG | Total packets | Discarded packets |
| A | 0 | 11044 | 3 |
| B | 0 | 10950 | 2 |
| C | 0 | 14395 | 2 |
| D | 0 | 11590 | 2 |
| Mode M9 | |||
|---|---|---|---|
| Quadrant | BADHDUFLAG | Total packets | Discarded packets |
| A | 0 | 29 | 0 |
| B | 0 | 29 | 0 |
| C | 0 | 29 | 0 |
| D | 0 | 30 | 0 |
| Mode SS | |||
|---|---|---|---|
| Quadrant | BADHDUFLAG | Total packets | Discarded packets |
| A | 0 | 104 | 0 |
| B | 0 | 104 | 0 |
| C | 0 | 104 | 0 |
| D | 0 | 104 | 0 |
| Quadrant | Total seconds | Saturated seconds | Saturation percentage |
|---|---|---|---|
| A | 5043 | 9 | 0.178465% |
| B | 5043 | 14 | 0.277613% |
| C | 5043 | 318 | 6.305770% |
| D | 5043 | 412 | 8.169740% |
Noise dominated data is calculated using 1-second bins in cleaned event files. If a bin has >2000 counts, and if more than 50% of those come from <1% of pixels, then it is considered to be noise-dominated and hence unusable.
| Quadrant | # 1 sec bins | Bins with >0 counts | Bins with >2000 counts | High rate bins dominated by noise | Noise dominated (total time) | Noise dominated (detector-on time) | Marked lightcurve |
|---|---|---|---|---|---|---|---|
| A | 7046 | 5044 | 3 | 3 | 0.04% | 0.06% | 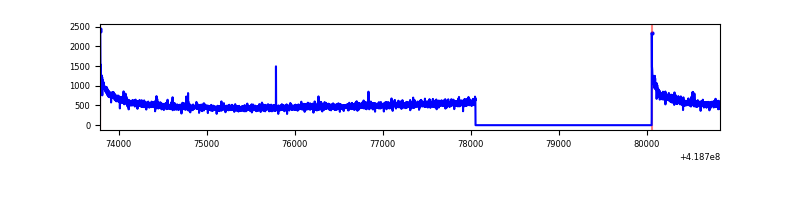 |
| B | 7046 | 5044 | 7 | 7 | 0.10% | 0.14% | 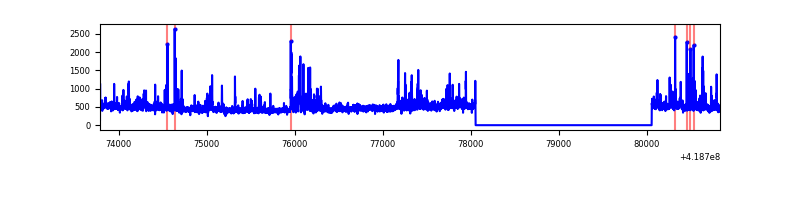 |
| C | 7046 | 5044 | 327 | 327 | 4.64% | 6.48% | 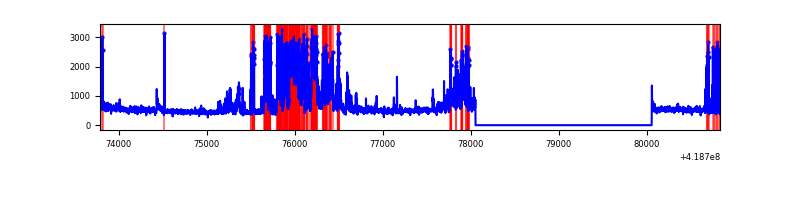 |
| D | 7046 | 5044 | 45 | 45 | 0.64% | 0.89% | 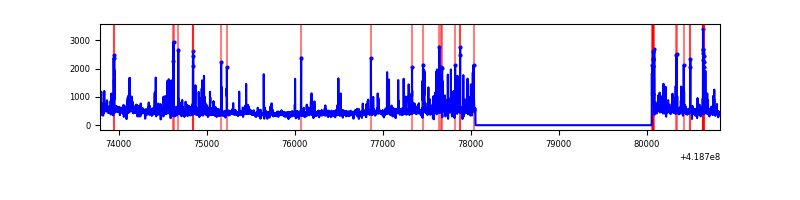 |
Top three noisy pixels from each quadrant. If the there are fewer than three noisy pixels in the level2.evt file, extra rows are filled as -1
| Pixel properties | Quadrant properties | ||||||
|---|---|---|---|---|---|---|---|
| Quadrant | DetID | PixID | Counts | Sigma | Mean | Median | Sigma |
| A | 10 | 83 | 468188 | 4141.96 | 558 | 547 | 112.9 |
| A | 12 | 189 | 30845 | 268.35 | 558 | 547 | 112.9 |
| A | 13 | 254 | 7199 | 58.92 | 558 | 547 | 112.9 |
| B | 4 | 170 | 235837 | 2214.17 | 564 | 549 | 106.3 |
| B | 0 | 190 | 33242 | 307.66 | 564 | 549 | 106.3 |
| B | 5 | 255 | 31111 | 287.6 | 564 | 549 | 106.3 |
| C | 9 | 187 | 1288593 | 10266.41 | 543 | 546 | 125.5 |
| C | 15 | 214 | 214822 | 1707.89 | 543 | 546 | 125.5 |
| C | 14 | 254 | 138435 | 1099.05 | 543 | 546 | 125.5 |
| D | 2 | 250 | 253695 | 2005.68 | 517 | 503 | 126.2 |
| D | 12 | 191 | 151862 | 1199.0 | 517 | 503 | 126.2 |
| D | 2 | 153 | 80214 | 631.44 | 517 | 503 | 126.2 |
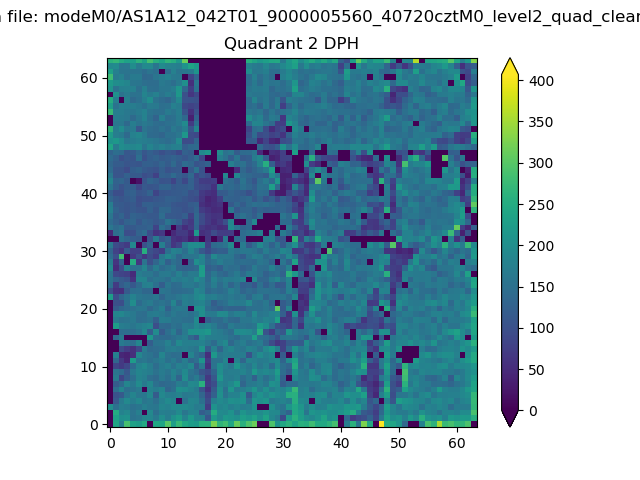
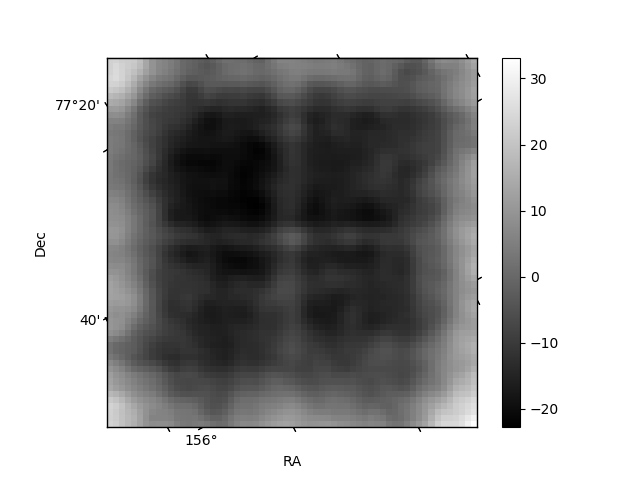
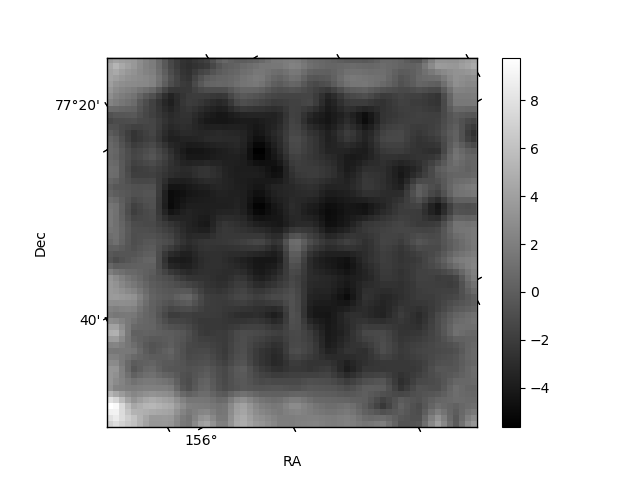
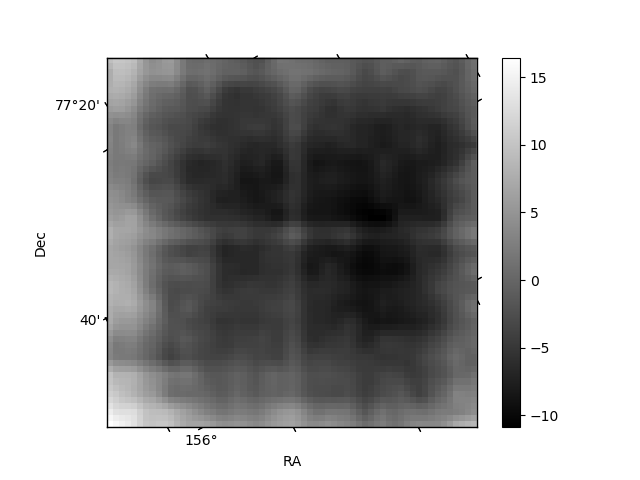
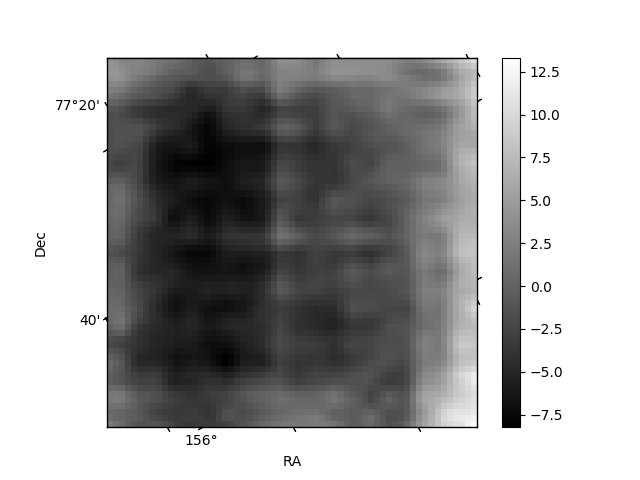
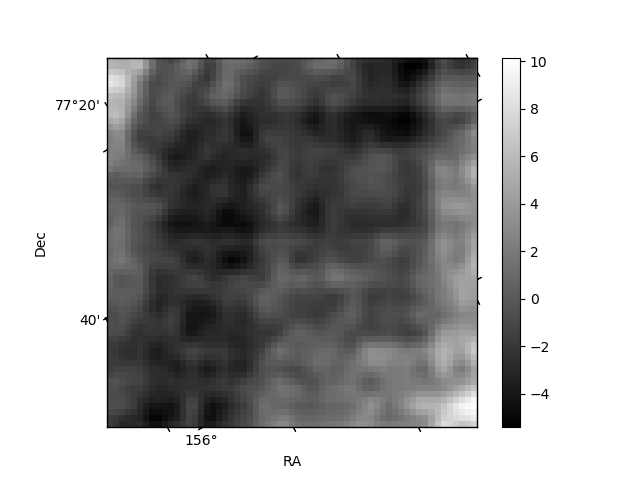
Histogram calculated using DETX and DETY for each event in the final _common_clean file
| Quadrant A | 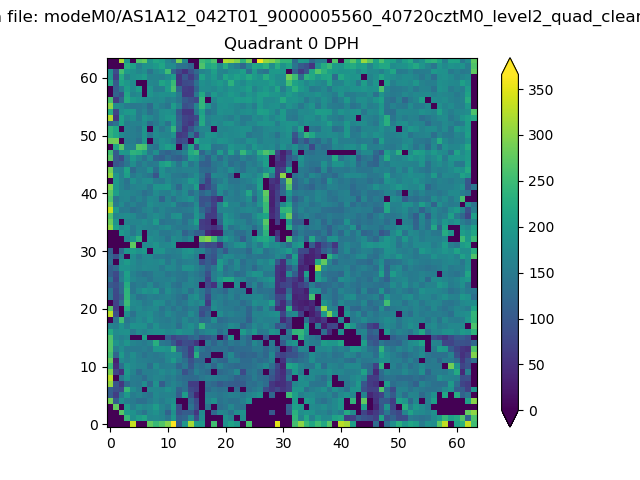 |
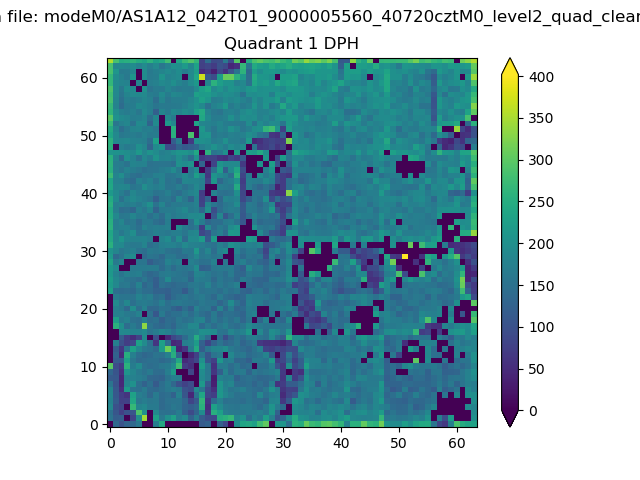 |
Quadrant B |
|---|---|---|---|
| Quadrant D | 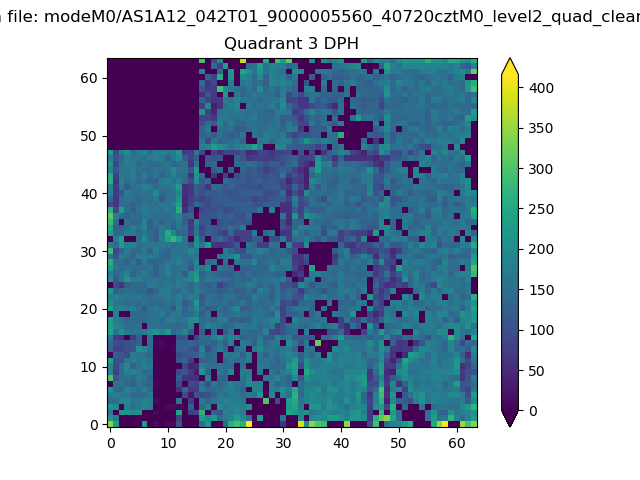 |
 |
Quadrant C |
| Plot type | Count rate plots | Images |
|---|---|---|
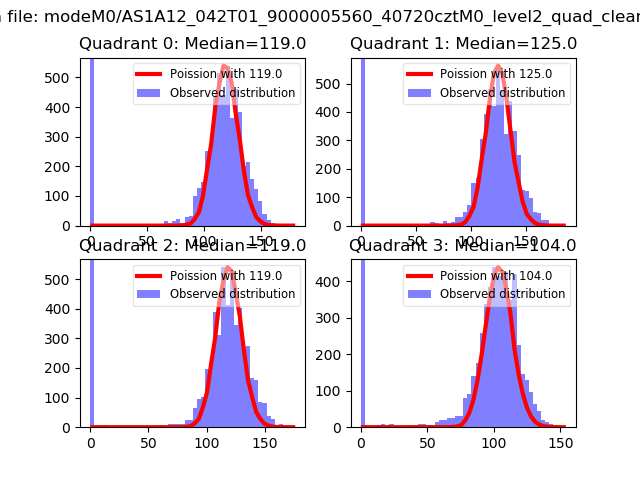
| Comparison with Poisson distribution Blue bars denote a histogram of data divided into 1 sec bins. Red curve is a Poisson curve with rate = median count rate of data. |
 |
 |
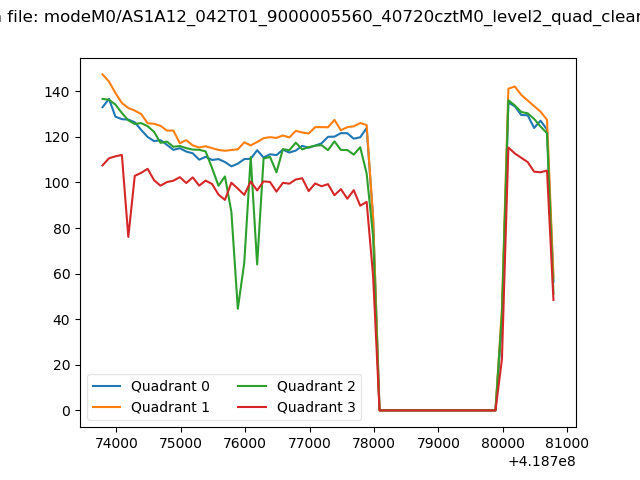
| Quadrant-wise count rates Data is divided into 100 sec bins |
 |
|
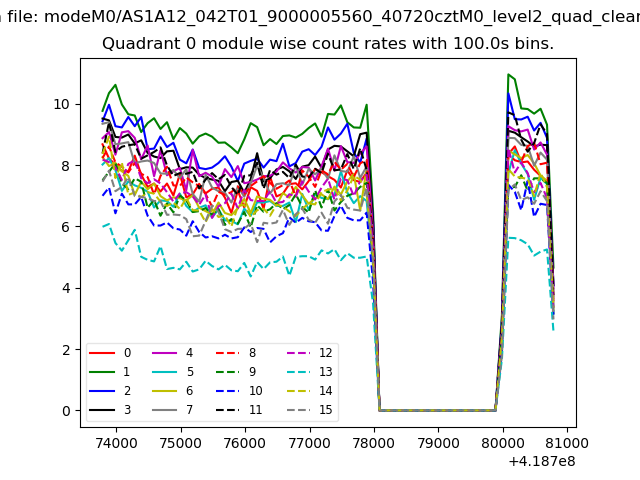
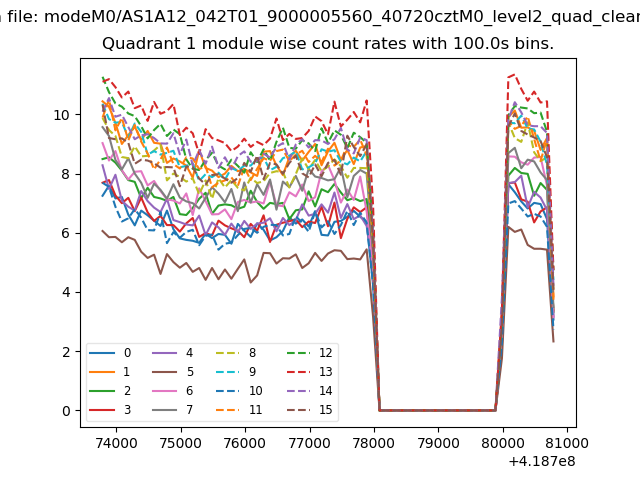
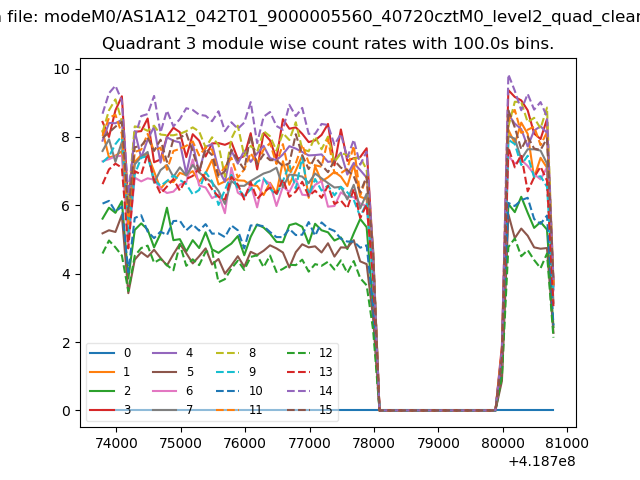
| Module-wise count rates for Quadrant A Data is divided into 100 sec bins |
 |
 |
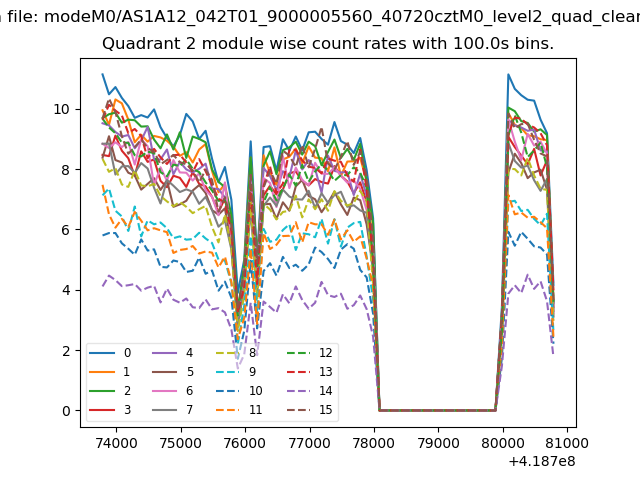
| Module-wise count rates for Quadrant B Data is divided into 100 sec bins |
 |
 |
| Module-wise count rates for Quadrant C Data is divided into 100 sec bins |
 |
 |
| Module-wise count rates for Quadrant D Data is divided into 100 sec bins |
 |
 |
| Parameter | Plot |
|---|---|
| CZT HV Monitor | 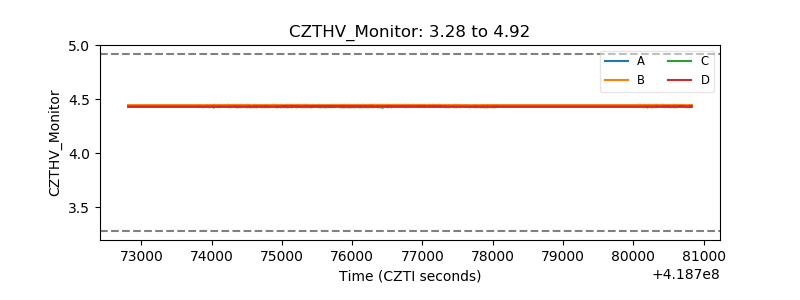 |
| D_VDD | 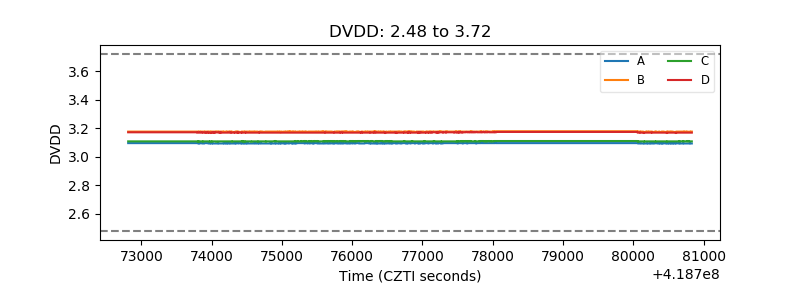 |
| Temperature 1 | 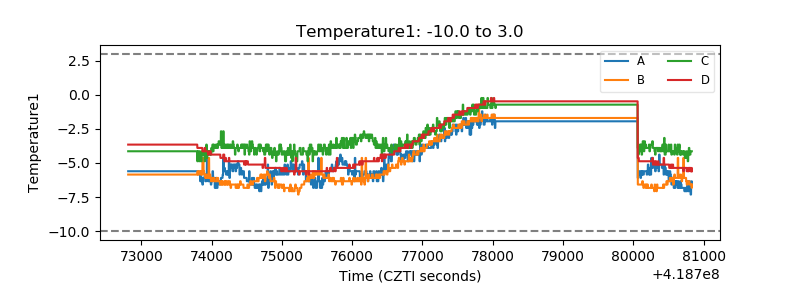 |
| Veto HV Monitor | 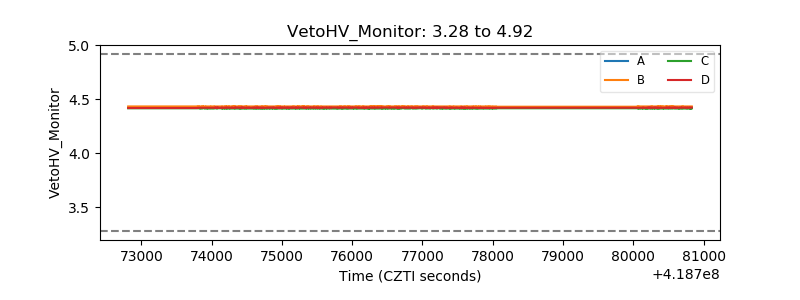 |
| Veto LLD | 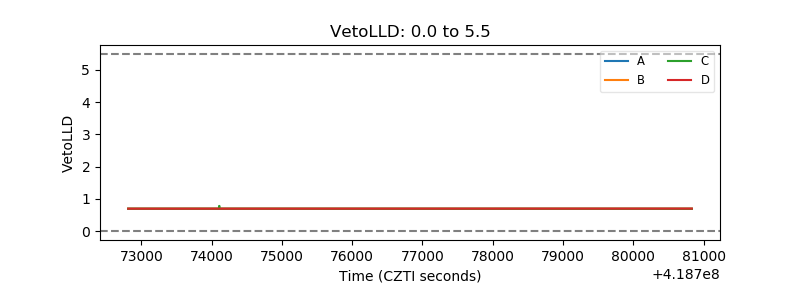 |
| Alpha Counter | 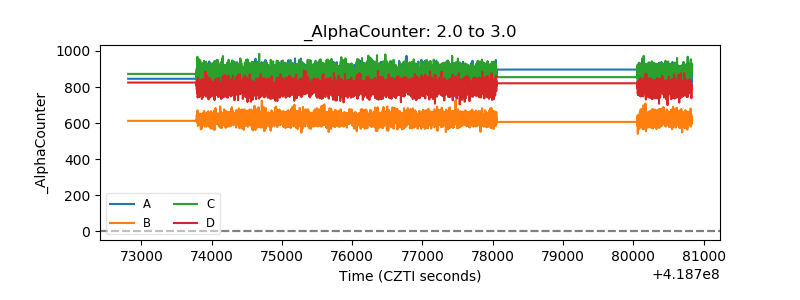 |
| _CPM_Rate | 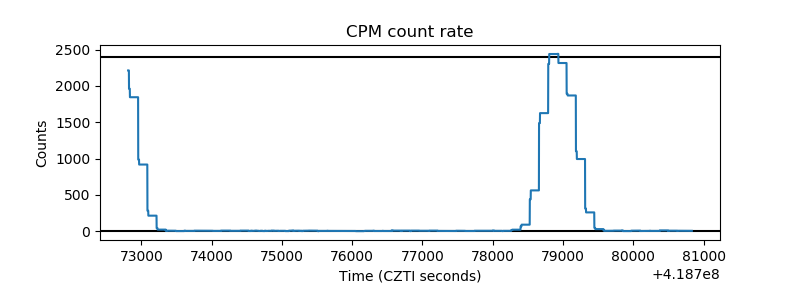 |
| CZT Counter | 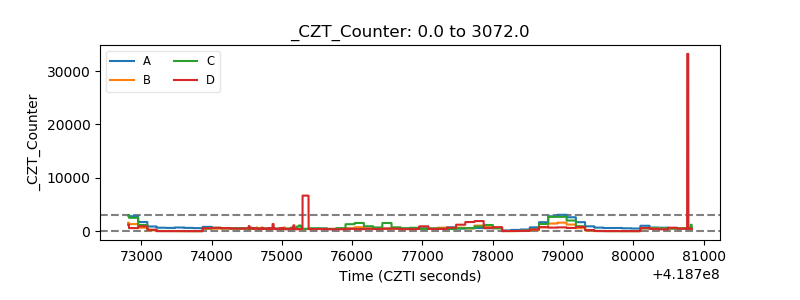 |
| +2.5 Volts monitor | 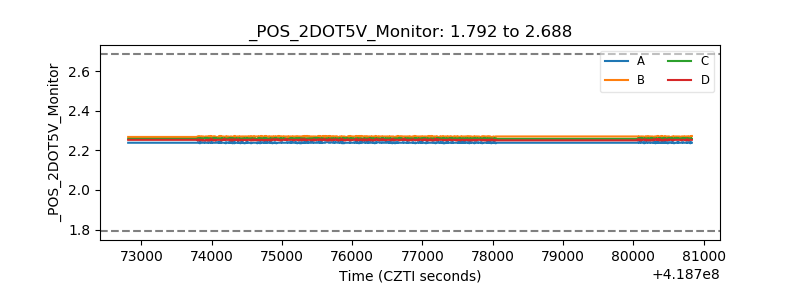 |
| +5 Volts monitor | 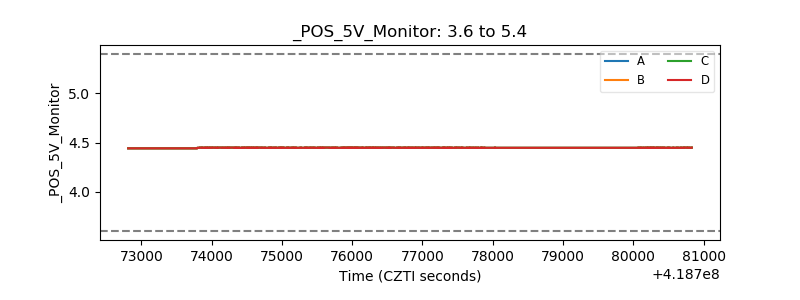 |
| _ROLL_ROT | 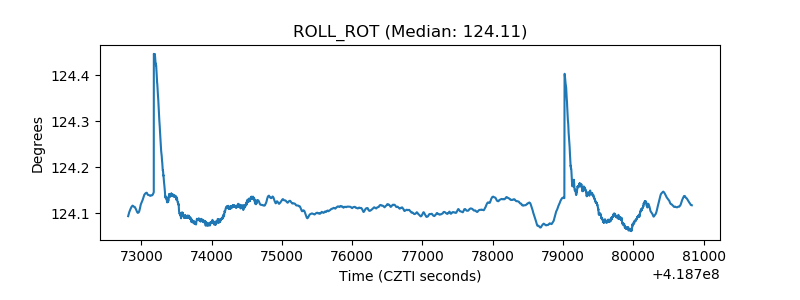 |
| _Roll_DEC | 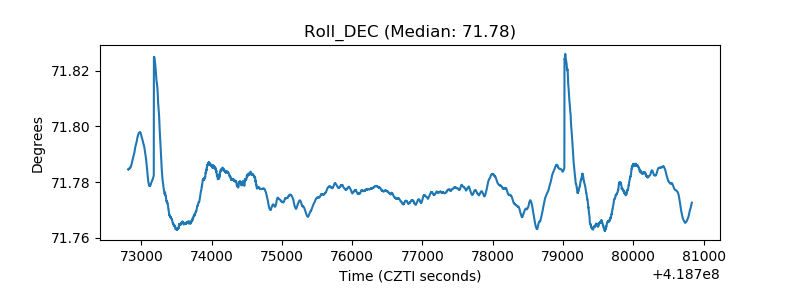 |
| _Roll_RA | 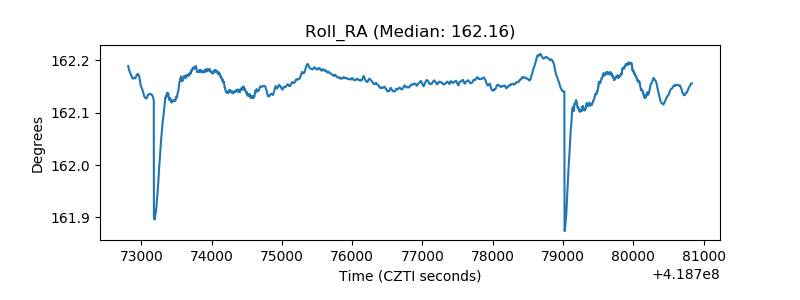 |
| Veto Counter | 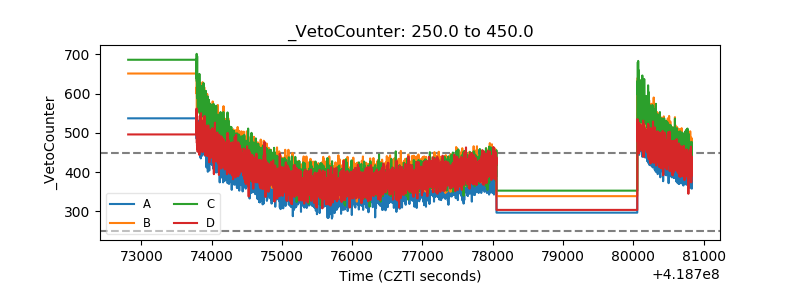 |