| Param | Original file | Final file |
|---|---|---|
| Filename | modeM0/AS1A12_042T01_9000005560_40721cztM0_level2.fits | modeM0/AS1A12_042T01_9000005560_40721cztM0_level2_quad_clean.evt |
| Size (bytes) | 394,113,600 | 90,362,880 |
| Size | 375.9 MB | 86.2 MB |
| Events in quadrant A | 2,977,708 | 627,066 |
| Events in quadrant B | 2,781,003 | 658,868 |
| Events in quadrant C | 5,585,892 | 559,848 |
| Events in quadrant D | 2,835,265 | 522,728 |
| Mode M0 | |||
|---|---|---|---|
| Quadrant | BADHDUFLAG | Total packets | Discarded packets |
| A | 0 | 12156 | 3 |
| B | 0 | 11605 | 2 |
| C | 0 | 20132 | 2 |
| D | 0 | 12093 | 2 |
| Mode M9 | |||
|---|---|---|---|
| Quadrant | BADHDUFLAG | Total packets | Discarded packets |
| A | 0 | 32 | 0 |
| B | 0 | 32 | 0 |
| C | 0 | 32 | 0 |
| D | 0 | 33 | 0 |
| Mode SS | |||
|---|---|---|---|
| Quadrant | BADHDUFLAG | Total packets | Discarded packets |
| A | 0 | 106 | 0 |
| B | 0 | 106 | 0 |
| C | 0 | 106 | 0 |
| D | 0 | 106 | 0 |
| Quadrant | Total seconds | Saturated seconds | Saturation percentage |
|---|---|---|---|
| A | 5253 | 16 | 0.304588% |
| B | 5253 | 24 | 0.456882% |
| C | 5253 | 765 | 14.563107% |
| D | 5253 | 469 | 8.928231% |
Noise dominated data is calculated using 1-second bins in cleaned event files. If a bin has >2000 counts, and if more than 50% of those come from <1% of pixels, then it is considered to be noise-dominated and hence unusable.
| Quadrant | # 1 sec bins | Bins with >0 counts | Bins with >2000 counts | High rate bins dominated by noise | Noise dominated (total time) | Noise dominated (detector-on time) | Marked lightcurve |
|---|---|---|---|---|---|---|---|
| A | 7346 | 5254 | 9 | 9 | 0.12% | 0.17% | 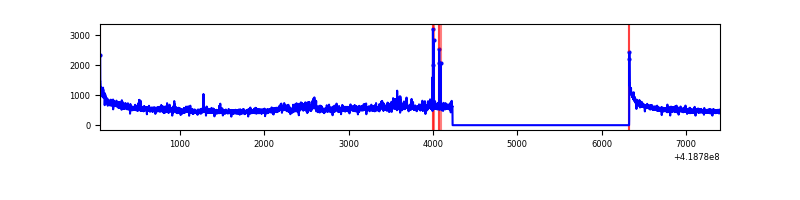 |
| B | 7346 | 5254 | 16 | 16 | 0.22% | 0.30% | 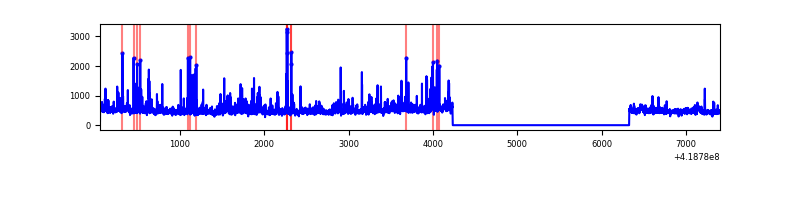 |
| C | 7346 | 5254 | 754 | 754 | 10.26% | 14.35% | 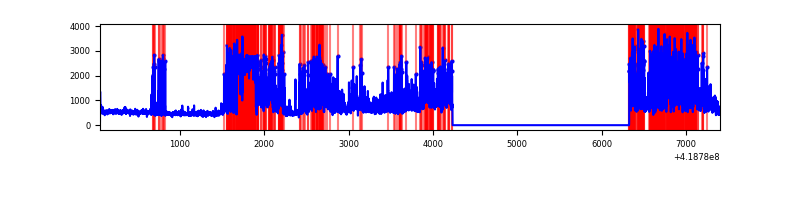 |
| D | 7346 | 5254 | 54 | 54 | 0.74% | 1.03% | 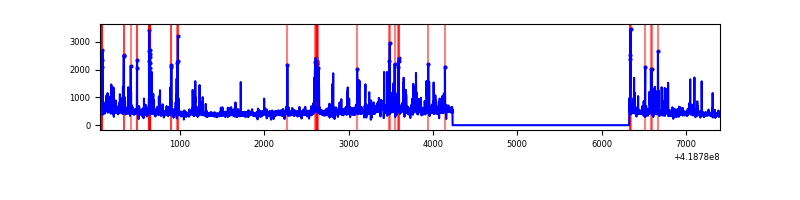 |
Top three noisy pixels from each quadrant. If the there are fewer than three noisy pixels in the level2.evt file, extra rows are filled as -1
| Pixel properties | Quadrant properties | ||||||
|---|---|---|---|---|---|---|---|
| Quadrant | DetID | PixID | Counts | Sigma | Mean | Median | Sigma |
| A | 10 | 83 | 492127 | 4164.94 | 582 | 571 | 118.0 |
| A | 12 | 189 | 202881 | 1714.17 | 582 | 571 | 118.0 |
| A | 7 | 3 | 19154 | 157.45 | 582 | 571 | 118.0 |
| B | 4 | 170 | 149740 | 1344.24 | 588 | 573 | 111.0 |
| B | 0 | 190 | 90092 | 806.72 | 588 | 573 | 111.0 |
| B | 4 | 171 | 80082 | 716.51 | 588 | 573 | 111.0 |
| C | 9 | 187 | 3154628 | 25500.28 | 538 | 539 | 123.7 |
| C | 15 | 214 | 214270 | 1727.98 | 538 | 539 | 123.7 |
| C | 14 | 254 | 97542 | 784.25 | 538 | 539 | 123.7 |
| D | 2 | 250 | 228884 | 1728.33 | 536 | 520 | 132.1 |
| D | 12 | 191 | 171504 | 1294.06 | 536 | 520 | 132.1 |
| D | 2 | 249 | 119422 | 899.89 | 536 | 520 | 132.1 |
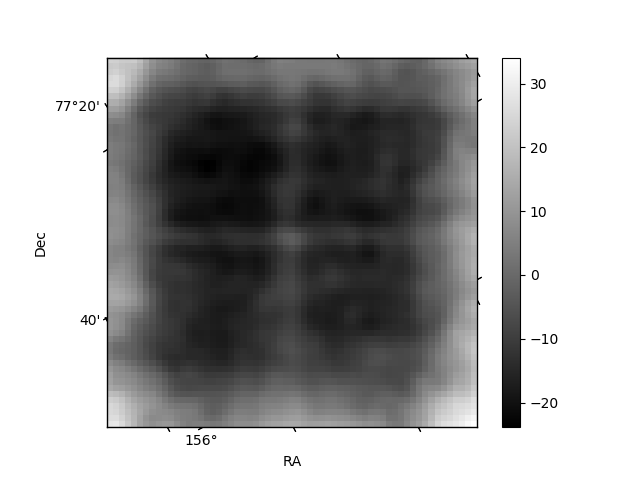
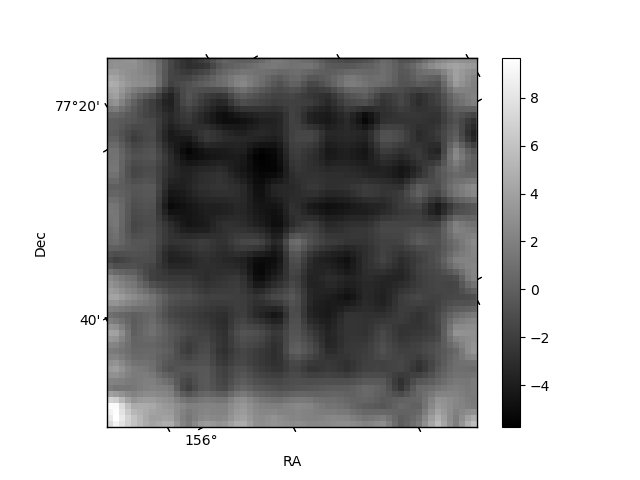
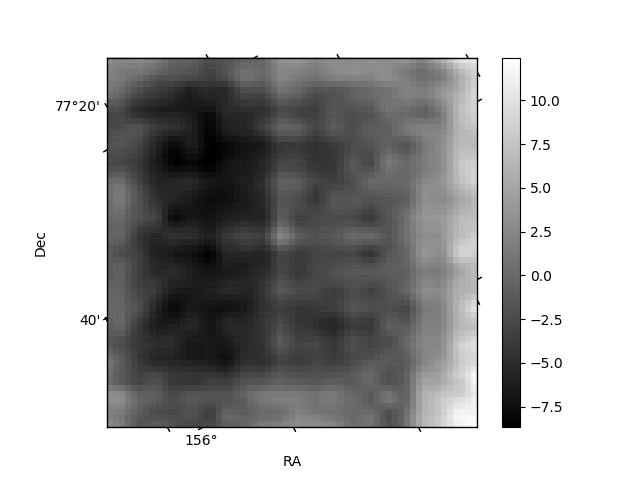
Histogram calculated using DETX and DETY for each event in the final _common_clean file
| Quadrant A | 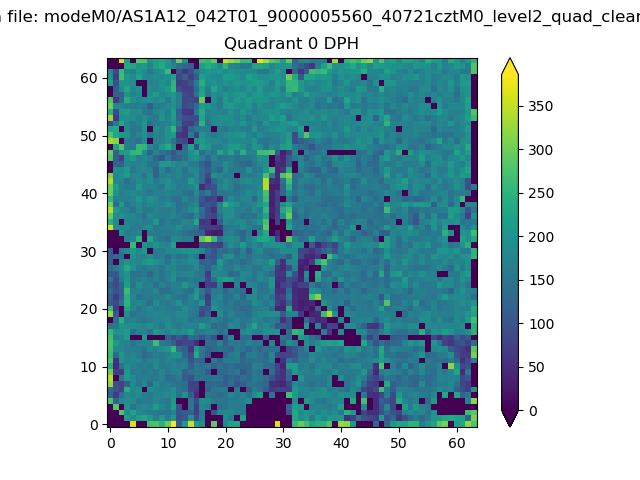 |
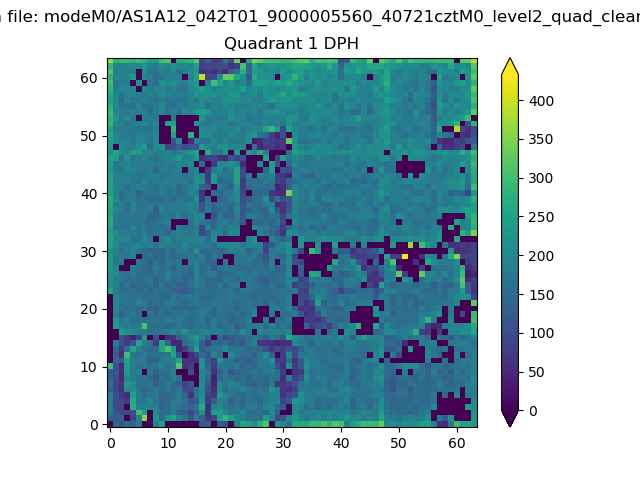 |
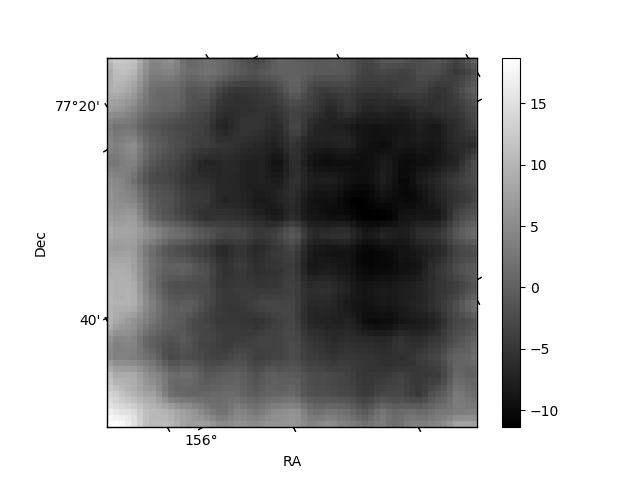
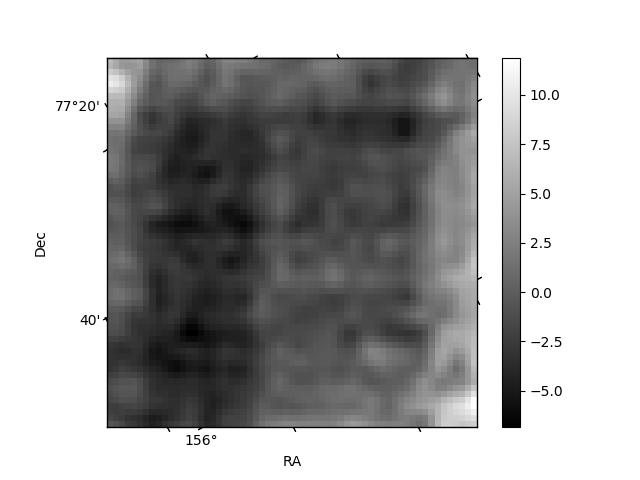
Quadrant B |
|---|---|---|---|
| Quadrant D | 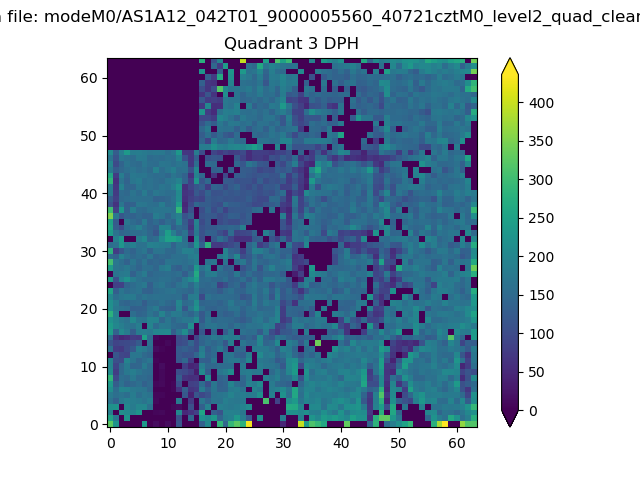 |
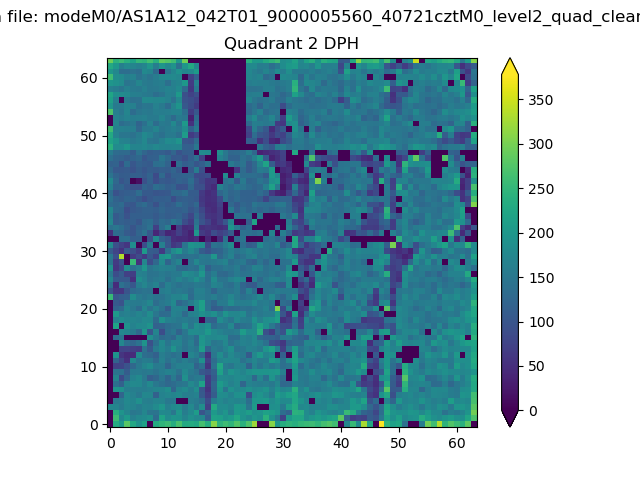 |
Quadrant C |
| Plot type | Count rate plots | Images |
|---|---|---|
| Comparison with Poisson distribution Blue bars denote a histogram of data divided into 1 sec bins. Red curve is a Poisson curve with rate = median count rate of data. |
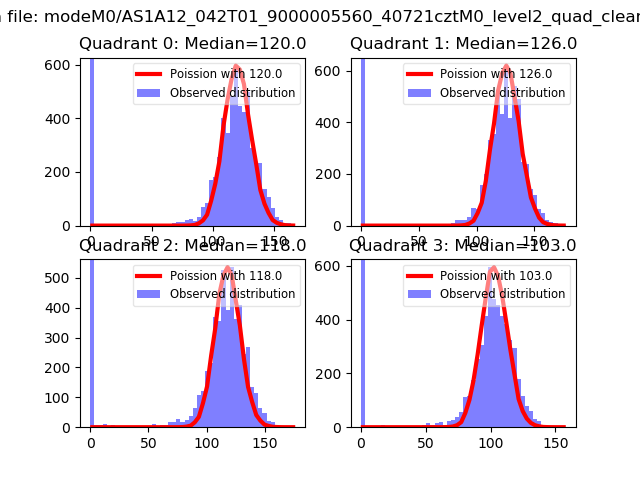 |
 |
| Quadrant-wise count rates Data is divided into 100 sec bins |
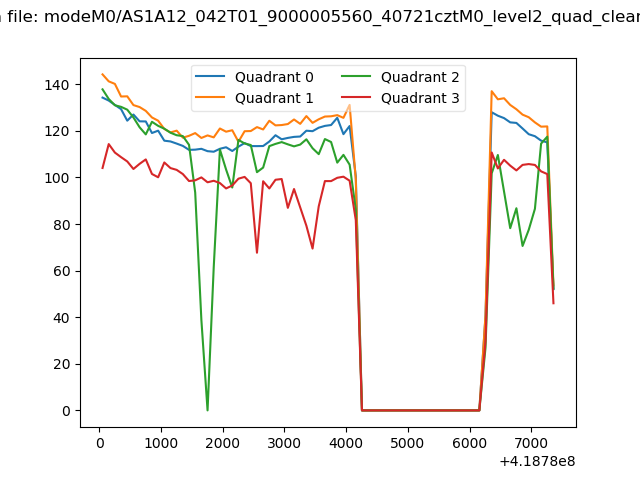 |
|
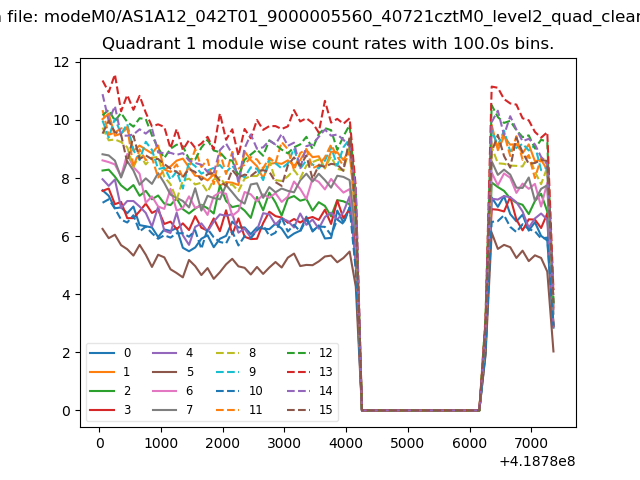
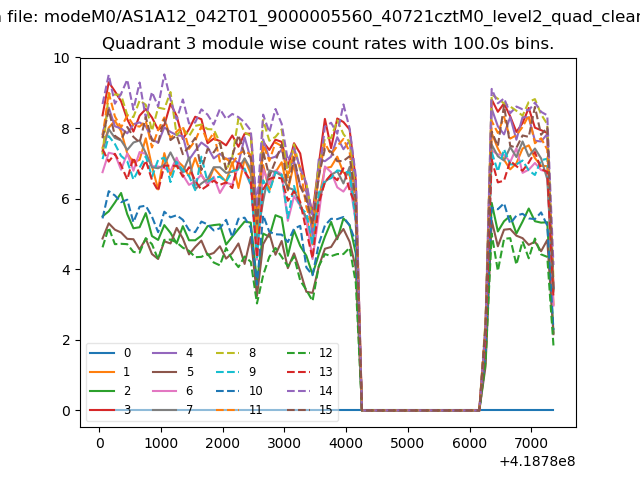
| Module-wise count rates for Quadrant A Data is divided into 100 sec bins |
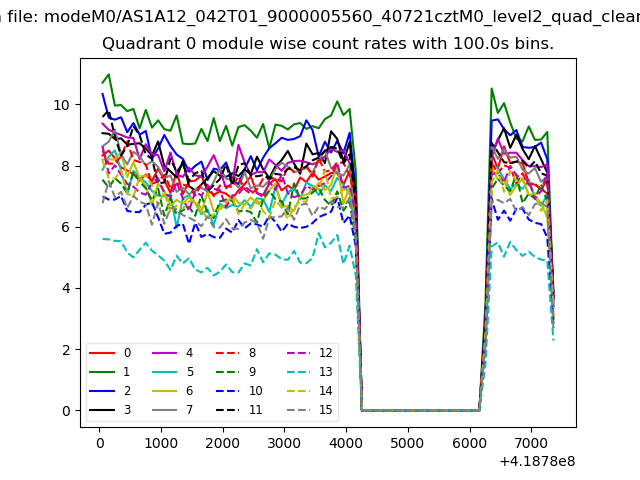 |
 |
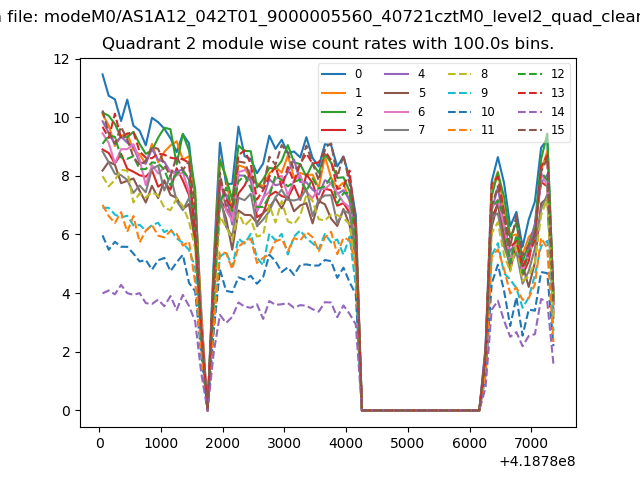
| Module-wise count rates for Quadrant B Data is divided into 100 sec bins |
 |
 |
| Module-wise count rates for Quadrant C Data is divided into 100 sec bins |
 |
 |
| Module-wise count rates for Quadrant D Data is divided into 100 sec bins |
 |
 |
| Parameter | Plot |
|---|---|
| CZT HV Monitor | 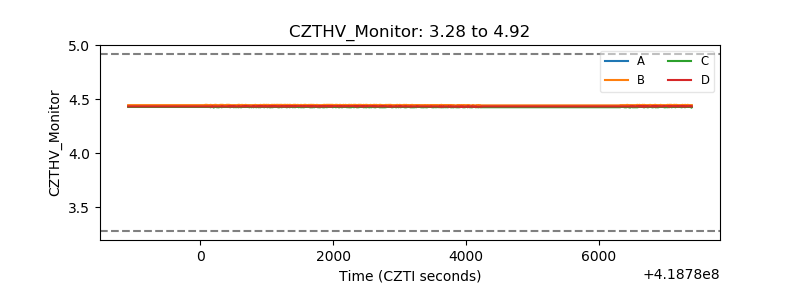 |
| D_VDD | 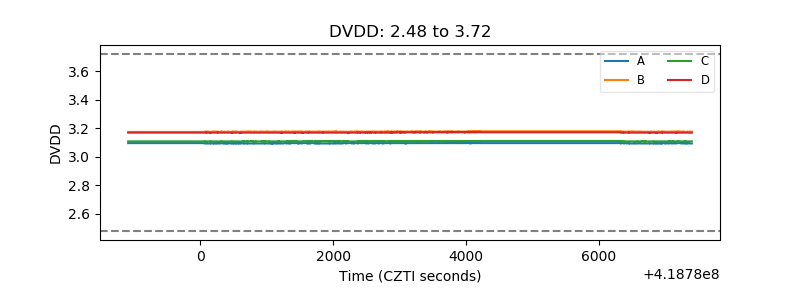 |
| Temperature 1 | 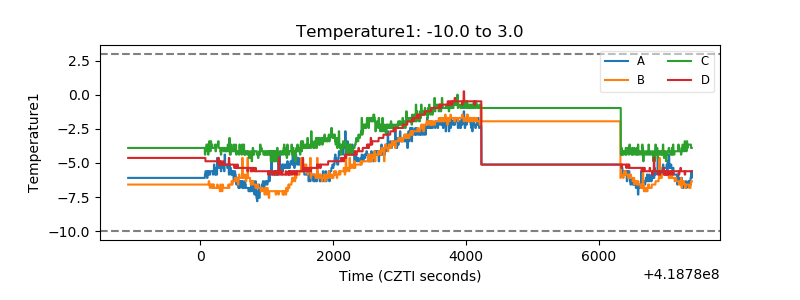 |
| Veto HV Monitor | 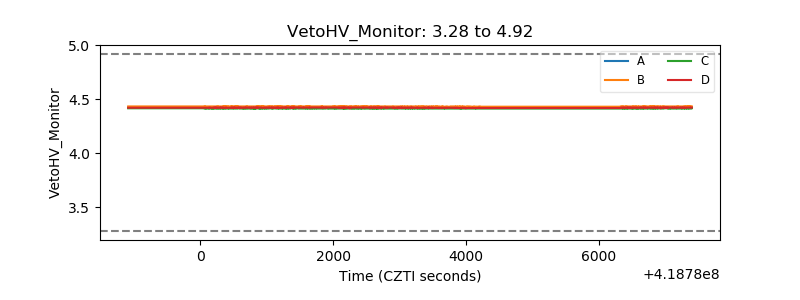 |
| Veto LLD | 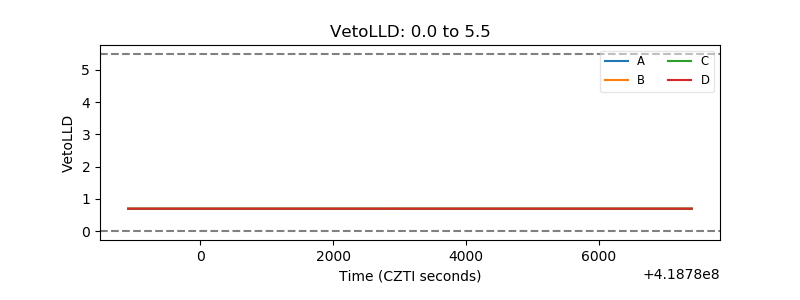 |
| Alpha Counter | 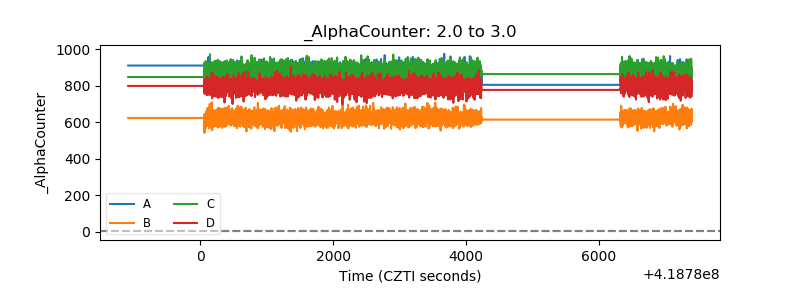 |
| _CPM_Rate | 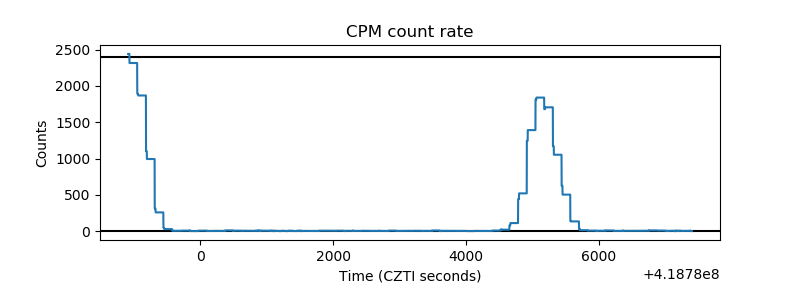 |
| CZT Counter | 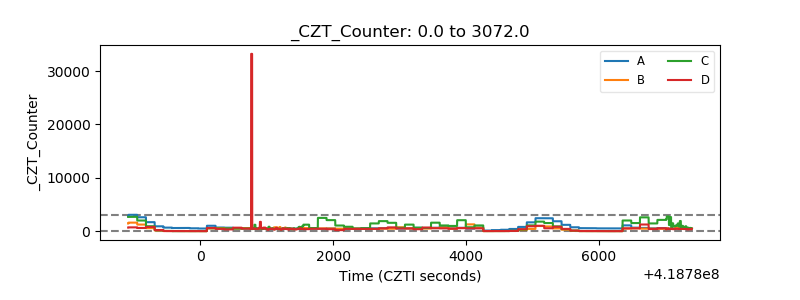 |
| +2.5 Volts monitor | 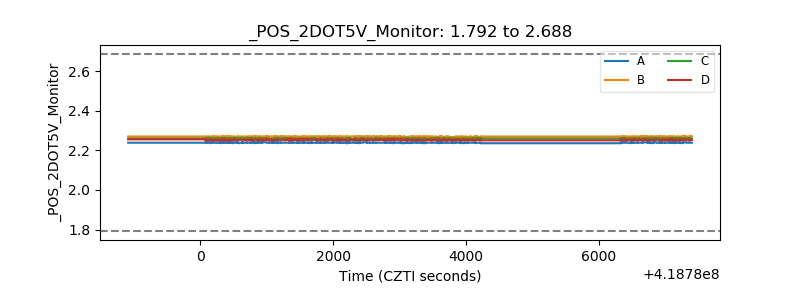 |
| +5 Volts monitor | 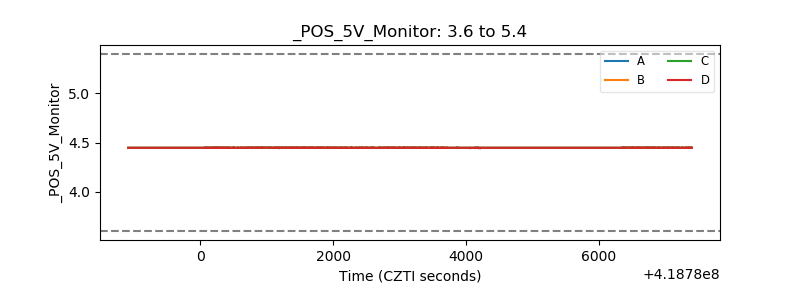 |
| _ROLL_ROT | 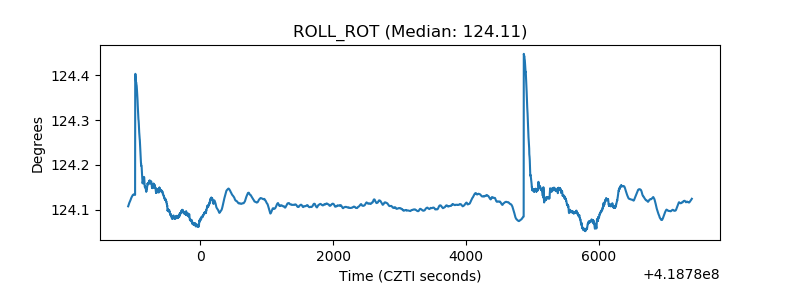 |
| _Roll_DEC |  |
| _Roll_RA | 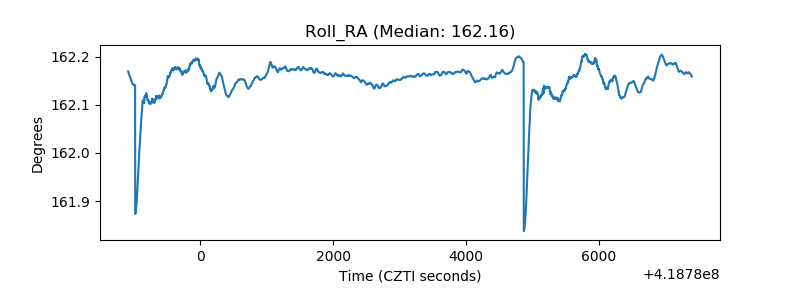 |
| Veto Counter | 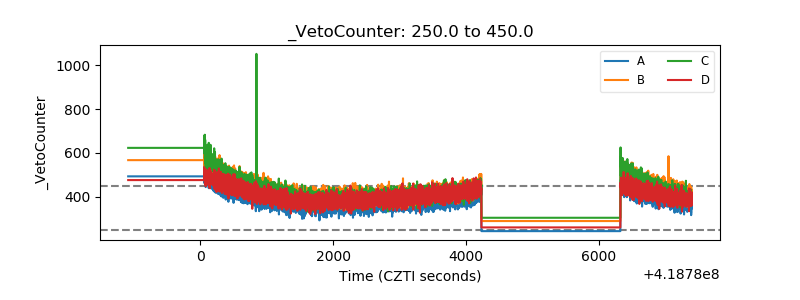 |