| Param | Original file | Final file |
|---|---|---|
| Filename | modeM0/AS1A12_042T01_9000005560_40723cztM0_level2.fits | modeM0/AS1A12_042T01_9000005560_40723cztM0_level2_quad_clean.evt |
| Size (bytes) | 389,401,920 | 82,814,400 |
| Size | 371.4 MB | 79.0 MB |
| Events in quadrant A | 2,718,661 | 578,180 |
| Events in quadrant B | 2,354,666 | 601,378 |
| Events in quadrant C | 6,419,331 | 500,553 |
| Events in quadrant D | 2,526,118 | 471,315 |
| Mode M0 | |||
|---|---|---|---|
| Quadrant | BADHDUFLAG | Total packets | Discarded packets |
| A | 0 | 11060 | 3 |
| B | 0 | 10513 | 2 |
| C | 0 | 22581 | 2 |
| D | 0 | 11131 | 2 |
| Mode M9 | |||
|---|---|---|---|
| Quadrant | BADHDUFLAG | Total packets | Discarded packets |
| A | 0 | 23 | 0 |
| B | 0 | 23 | 0 |
| C | 0 | 23 | 0 |
| D | 0 | 24 | 0 |
| Mode SS | |||
|---|---|---|---|
| Quadrant | BADHDUFLAG | Total packets | Discarded packets |
| A | 0 | 104 | 0 |
| B | 0 | 104 | 0 |
| C | 0 | 104 | 0 |
| D | 0 | 104 | 0 |
| Quadrant | Total seconds | Saturated seconds | Saturation percentage |
|---|---|---|---|
| A | 5077 | 10 | 0.196967% |
| B | 5077 | 11 | 0.216663% |
| C | 5077 | 880 | 17.333071% |
| D | 5077 | 564 | 11.108923% |
Noise dominated data is calculated using 1-second bins in cleaned event files. If a bin has >2000 counts, and if more than 50% of those come from <1% of pixels, then it is considered to be noise-dominated and hence unusable.
| Quadrant | # 1 sec bins | Bins with >0 counts | Bins with >2000 counts | High rate bins dominated by noise | Noise dominated (total time) | Noise dominated (detector-on time) | Marked lightcurve |
|---|---|---|---|---|---|---|---|
| A | 7170 | 5078 | 6 | 6 | 0.08% | 0.12% | 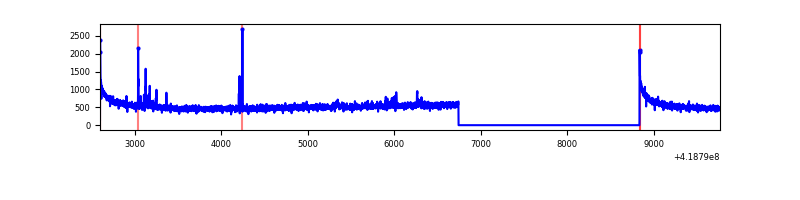 |
| B | 7170 | 5078 | 5 | 5 | 0.07% | 0.10% | 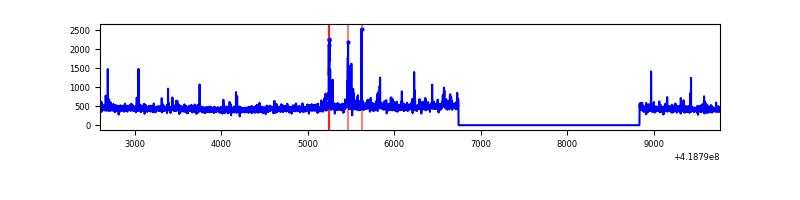 |
| C | 7170 | 5077 | 872 | 872 | 12.16% | 17.18% | 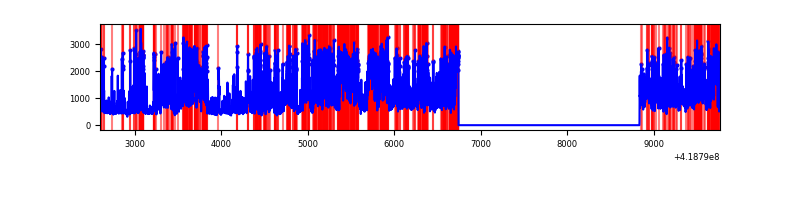 |
| D | 7169 | 5077 | 11 | 11 | 0.15% | 0.22% | 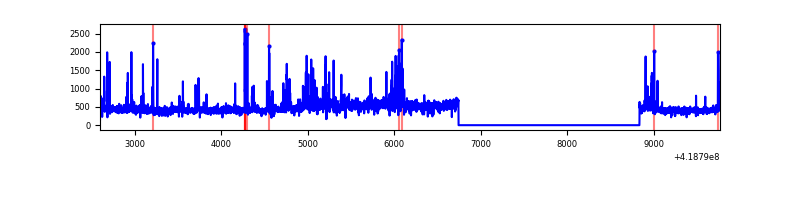 |
Top three noisy pixels from each quadrant. If the there are fewer than three noisy pixels in the level2.evt file, extra rows are filled as -1
| Pixel properties | Quadrant properties | ||||||
|---|---|---|---|---|---|---|---|
| Quadrant | DetID | PixID | Counts | Sigma | Mean | Median | Sigma |
| A | 10 | 83 | 503578 | 4411.7 | 556 | 543 | 114.0 |
| A | 12 | 189 | 33829 | 291.92 | 556 | 543 | 114.0 |
| A | 9 | 143 | 26921 | 231.34 | 556 | 543 | 114.0 |
| B | 0 | 190 | 50385 | 469.12 | 556 | 539 | 106.3 |
| B | 4 | 170 | 40678 | 377.76 | 556 | 539 | 106.3 |
| B | 15 | 35 | 15257 | 138.52 | 556 | 539 | 106.3 |
| C | 9 | 187 | 4147765 | 35216.31 | 508 | 510 | 117.8 |
| C | 15 | 214 | 211882 | 1794.86 | 508 | 510 | 117.8 |
| C | 14 | 254 | 57451 | 483.51 | 508 | 510 | 117.8 |
| D | 12 | 191 | 178684 | 1418.6 | 505 | 490 | 125.6 |
| D | 2 | 250 | 103363 | 818.97 | 505 | 490 | 125.6 |
| D | 2 | 249 | 84340 | 667.53 | 505 | 490 | 125.6 |
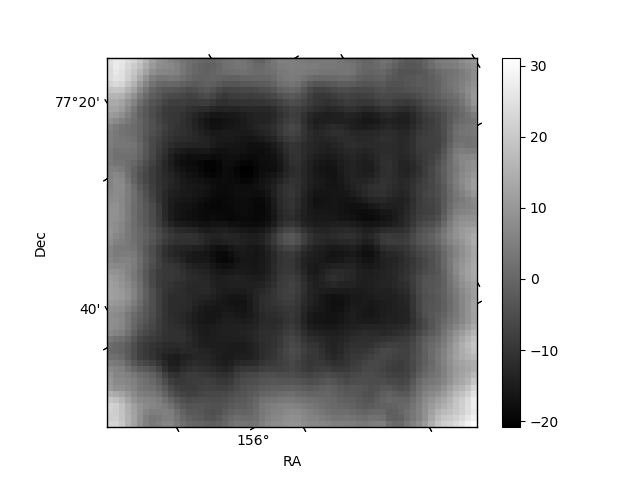
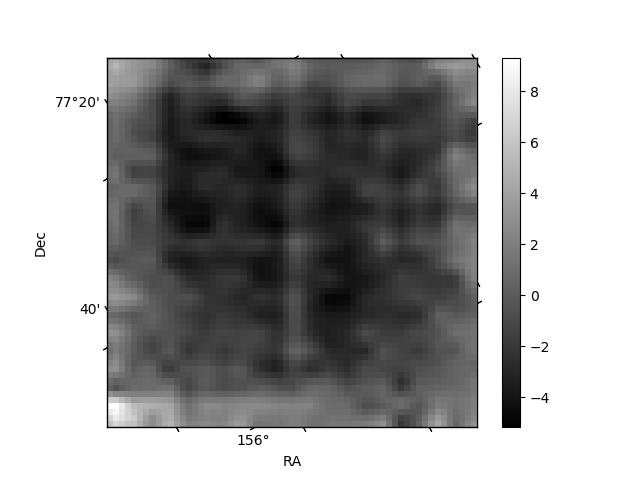
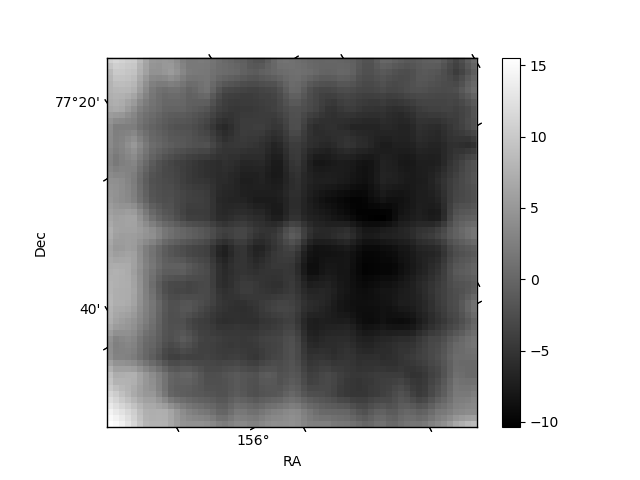
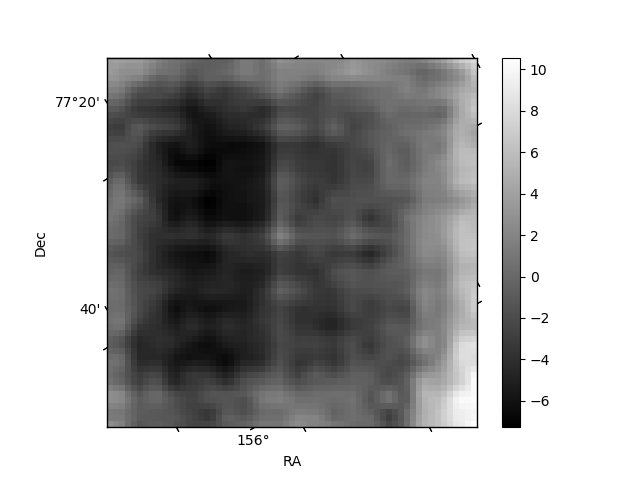
Histogram calculated using DETX and DETY for each event in the final _common_clean file
| Quadrant A | 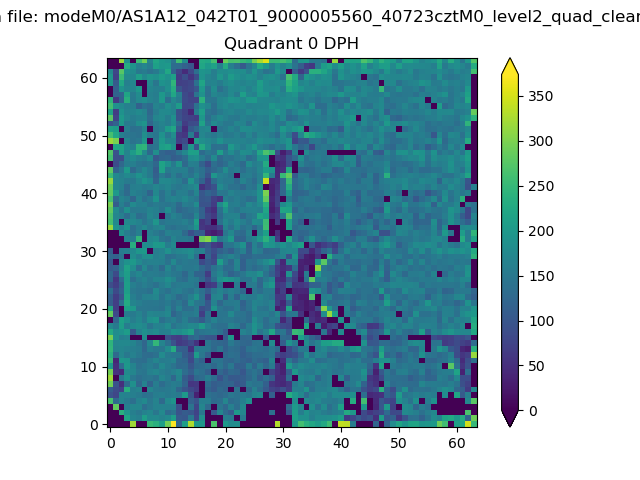 |
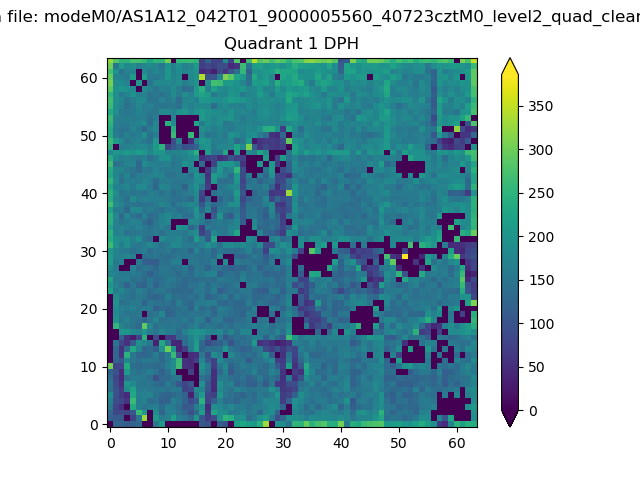 |
Quadrant B |
|---|---|---|---|
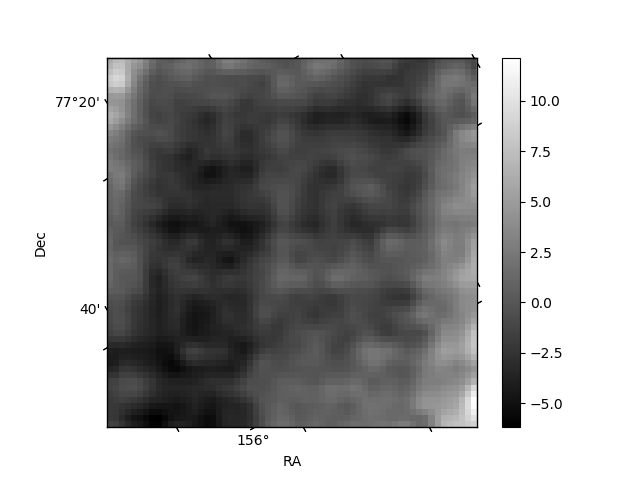
| Quadrant D | 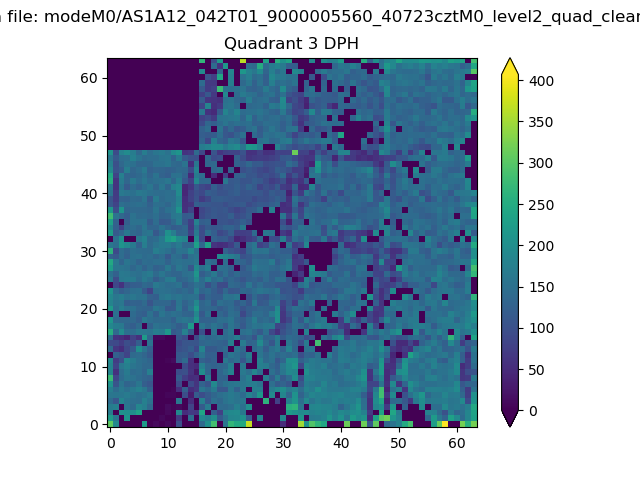 |
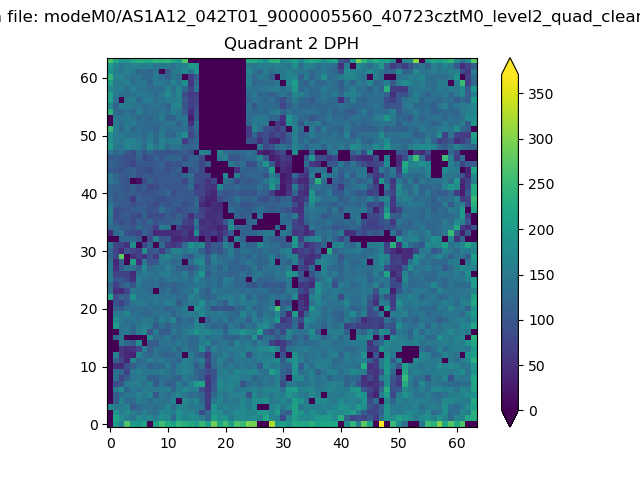 |
Quadrant C |
| Plot type | Count rate plots | Images |
|---|---|---|
| Comparison with Poisson distribution Blue bars denote a histogram of data divided into 1 sec bins. Red curve is a Poisson curve with rate = median count rate of data. |
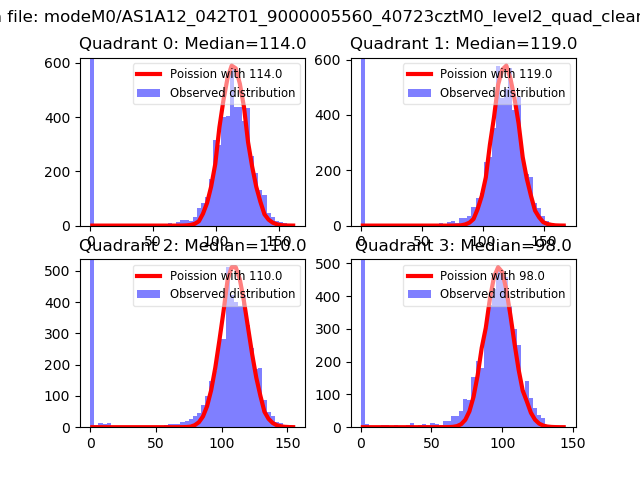 |
 |
| Quadrant-wise count rates Data is divided into 100 sec bins |
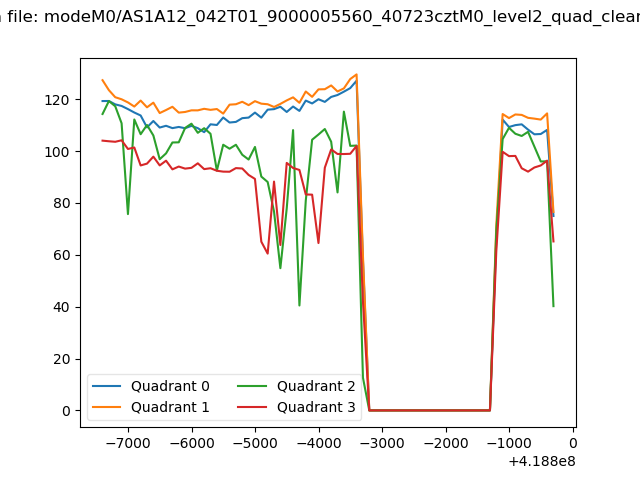 |
|
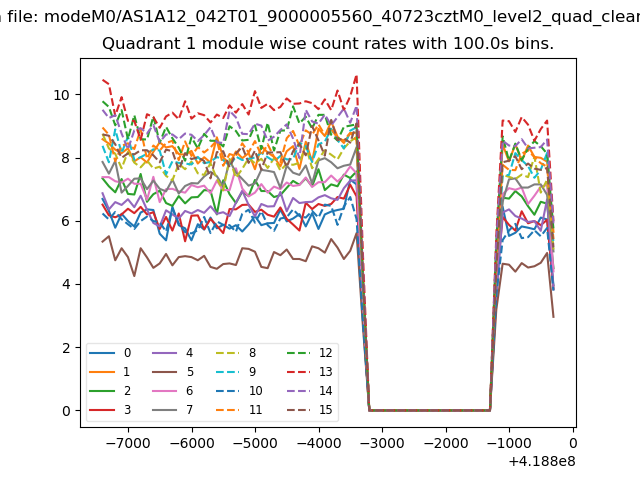
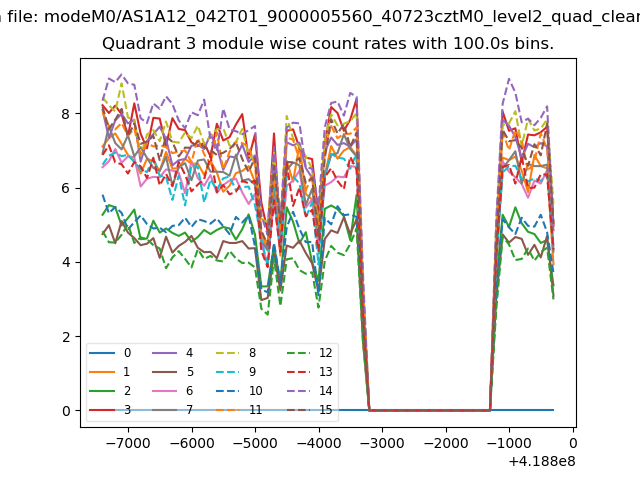
| Module-wise count rates for Quadrant A Data is divided into 100 sec bins |
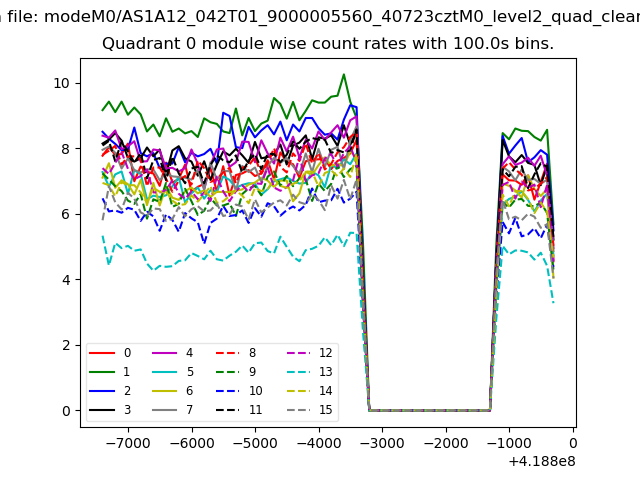 |
 |
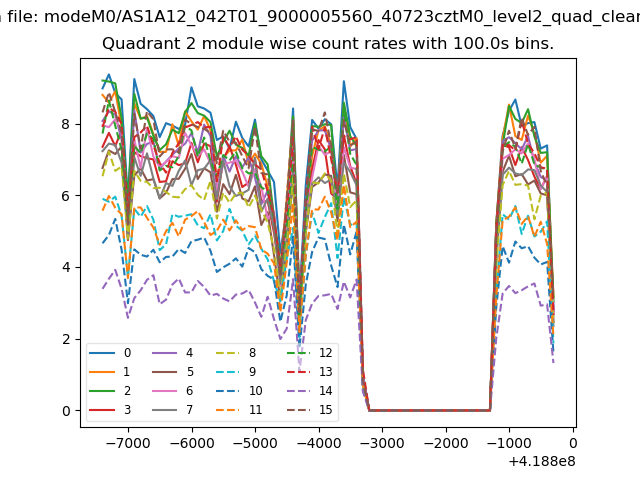
| Module-wise count rates for Quadrant B Data is divided into 100 sec bins |
 |
 |
| Module-wise count rates for Quadrant C Data is divided into 100 sec bins |
 |
 |
| Module-wise count rates for Quadrant D Data is divided into 100 sec bins |
 |
 |
| Parameter | Plot |
|---|---|
| CZT HV Monitor | 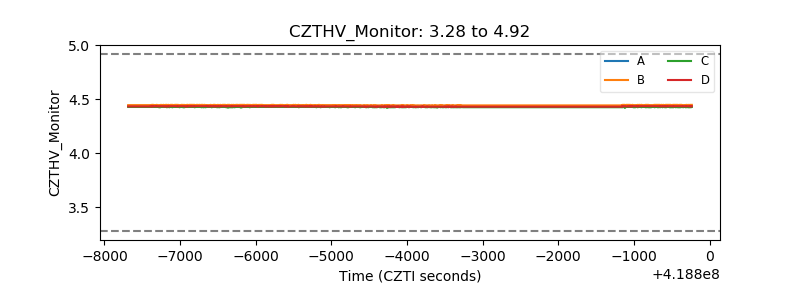 |
| D_VDD | 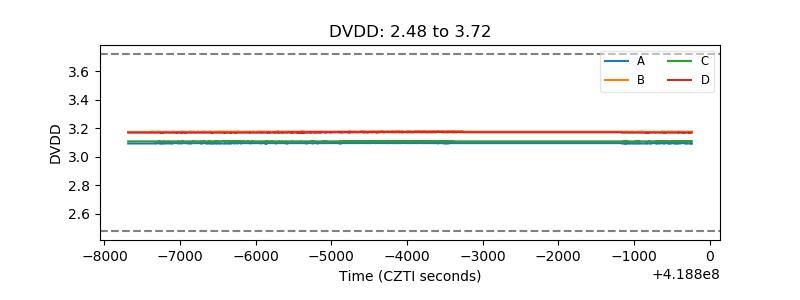 |
| Temperature 1 | 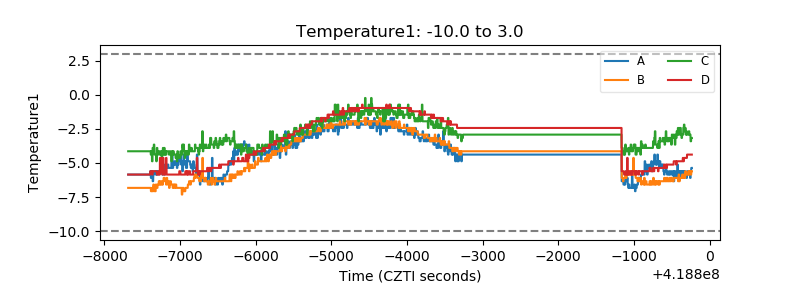 |
| Veto HV Monitor | 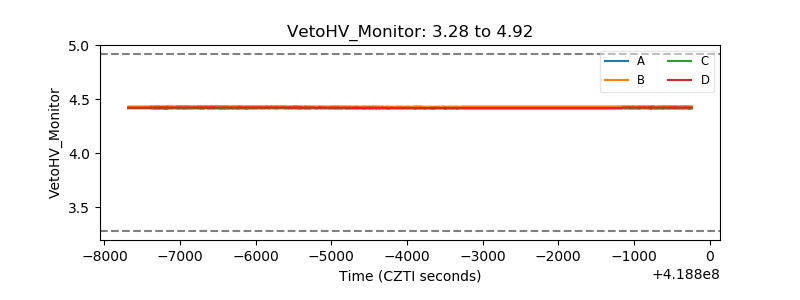 |
| Veto LLD | 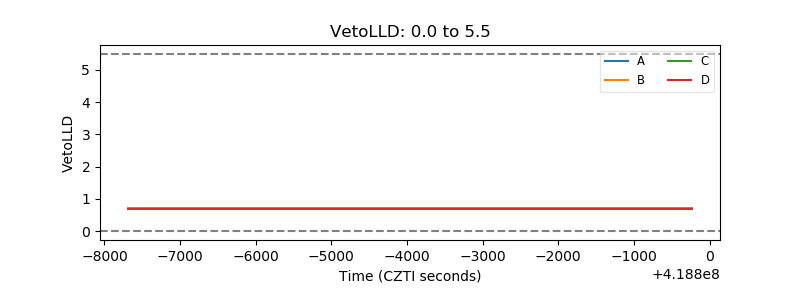 |
| Alpha Counter | 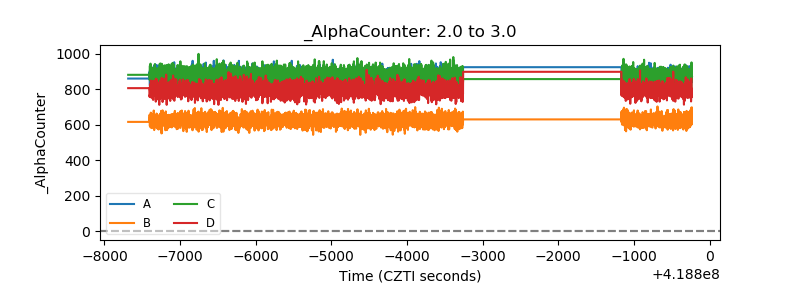 |
| _CPM_Rate | 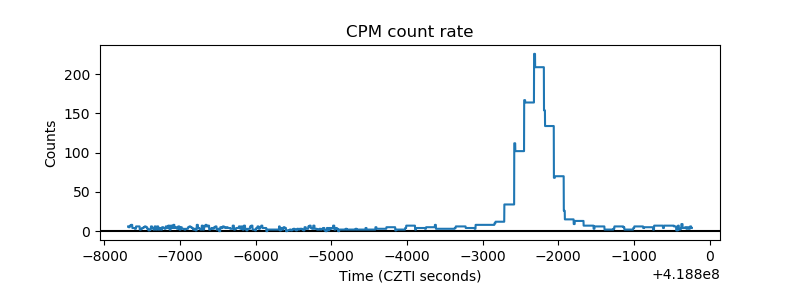 |
| CZT Counter | 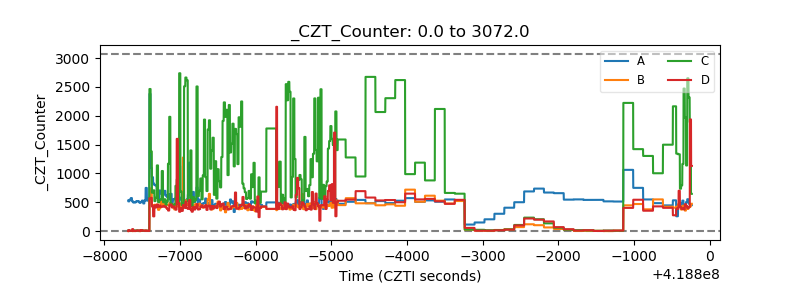 |
| +2.5 Volts monitor | 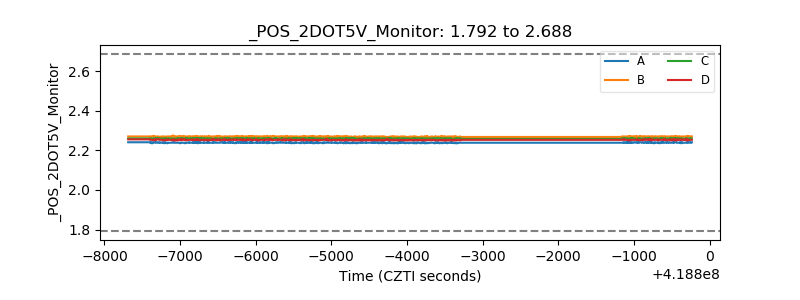 |
| +5 Volts monitor | 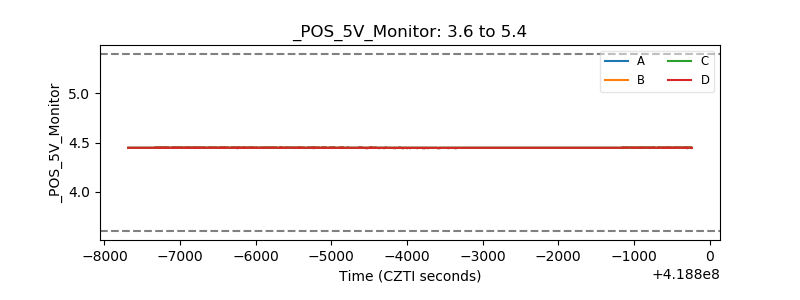 |
| _ROLL_ROT | 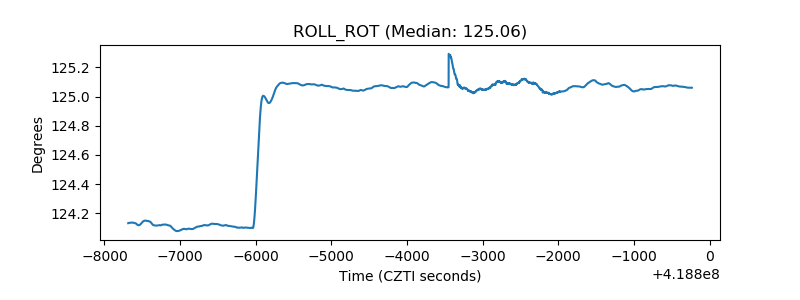 |
| _Roll_DEC | 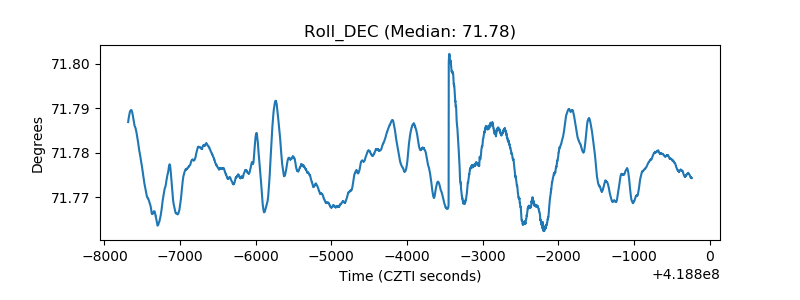 |
| _Roll_RA | 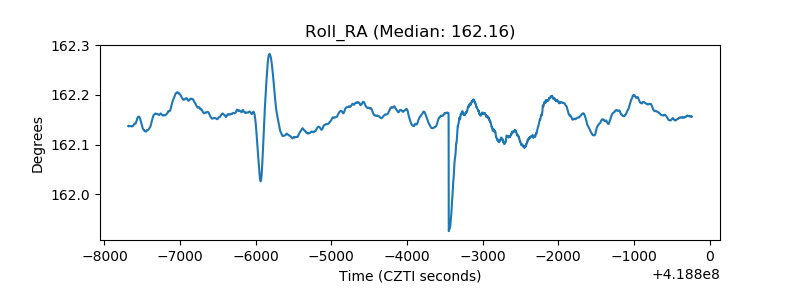 |
| Veto Counter | 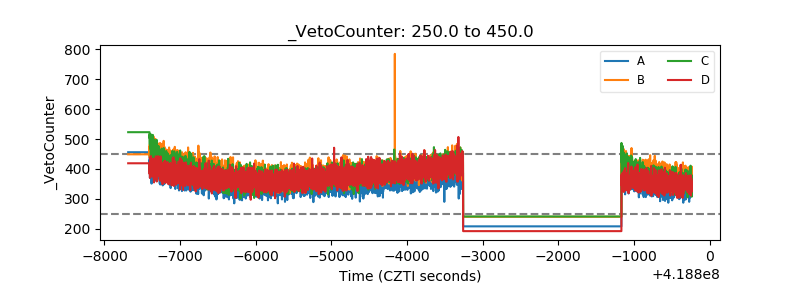 |