| Param | Original file | Final file |
|---|---|---|
| Filename | modeM0/AS1A12_042T01_9000005560_40724cztM0_level2.fits | modeM0/AS1A12_042T01_9000005560_40724cztM0_level2_quad_clean.evt |
| Size (bytes) | 412,876,800 | 81,538,560 |
| Size | 393.8 MB | 77.8 MB |
| Events in quadrant A | 2,746,493 | 576,214 |
| Events in quadrant B | 2,557,817 | 593,470 |
| Events in quadrant C | 6,984,087 | 459,309 |
| Events in quadrant D | 2,590,868 | 476,120 |
| Mode M0 | |||
|---|---|---|---|
| Quadrant | BADHDUFLAG | Total packets | Discarded packets |
| A | 0 | 11208 | 3 |
| B | 0 | 11210 | 2 |
| C | 0 | 24379 | 2 |
| D | 0 | 11343 | 2 |
| Mode M9 | |||
|---|---|---|---|
| Quadrant | BADHDUFLAG | Total packets | Discarded packets |
| A | 0 | 20 | 0 |
| B | 0 | 20 | 0 |
| C | 0 | 20 | 0 |
| D | 0 | 21 | 0 |
| Mode SS | |||
|---|---|---|---|
| Quadrant | BADHDUFLAG | Total packets | Discarded packets |
| A | 0 | 106 | 0 |
| B | 0 | 106 | 0 |
| C | 0 | 106 | 0 |
| D | 0 | 106 | 0 |
| Quadrant | Total seconds | Saturated seconds | Saturation percentage |
|---|---|---|---|
| A | 5189 | 11 | 0.211987% |
| B | 5189 | 38 | 0.732318% |
| C | 5189 | 1222 | 23.549817% |
| D | 5189 | 421 | 8.113317% |
Noise dominated data is calculated using 1-second bins in cleaned event files. If a bin has >2000 counts, and if more than 50% of those come from <1% of pixels, then it is considered to be noise-dominated and hence unusable.
| Quadrant | # 1 sec bins | Bins with >0 counts | Bins with >2000 counts | High rate bins dominated by noise | Noise dominated (total time) | Noise dominated (detector-on time) | Marked lightcurve |
|---|---|---|---|---|---|---|---|
| A | 7101 | 5190 | 4 | 4 | 0.06% | 0.08% | 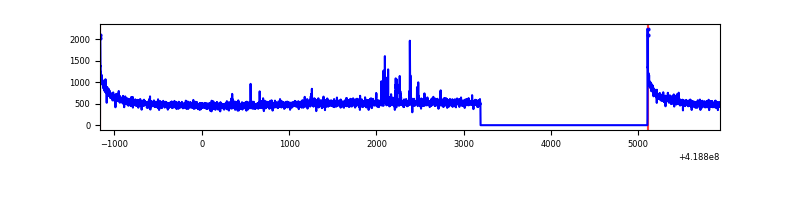 |
| B | 7101 | 5190 | 24 | 24 | 0.34% | 0.46% | 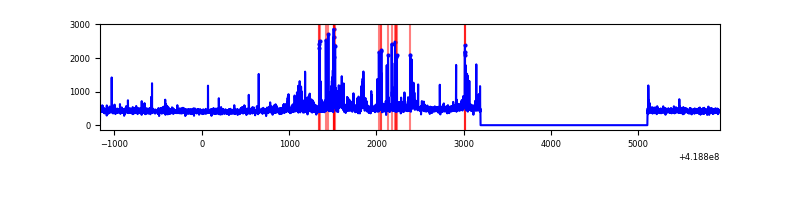 |
| C | 7101 | 5190 | 1162 | 1162 | 16.36% | 22.39% | 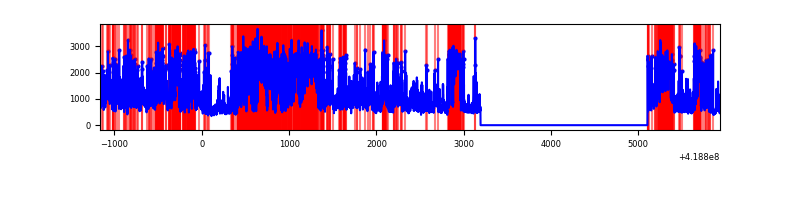 |
| D | 7100 | 5189 | 26 | 26 | 0.37% | 0.50% | 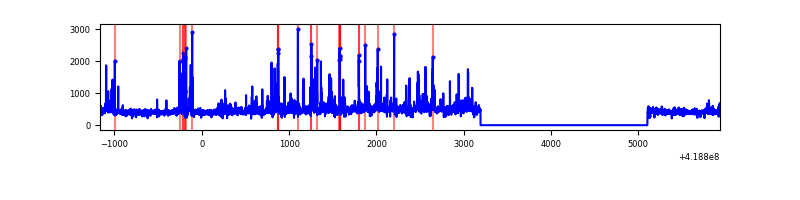 |
Top three noisy pixels from each quadrant. If the there are fewer than three noisy pixels in the level2.evt file, extra rows are filled as -1
| Pixel properties | Quadrant properties | ||||||
|---|---|---|---|---|---|---|---|
| Quadrant | DetID | PixID | Counts | Sigma | Mean | Median | Sigma |
| A | 10 | 83 | 498265 | 4314.34 | 565 | 555 | 115.4 |
| A | 6 | 10 | 32852 | 279.96 | 565 | 555 | 115.4 |
| A | 12 | 189 | 26459 | 224.55 | 565 | 555 | 115.4 |
| B | 0 | 229 | 124775 | 1153.78 | 562 | 547 | 107.7 |
| B | 15 | 85 | 70814 | 652.61 | 562 | 547 | 107.7 |
| B | 0 | 190 | 52144 | 479.21 | 562 | 547 | 107.7 |
| C | 9 | 187 | 4649247 | 40446.12 | 498 | 501 | 114.9 |
| C | 15 | 214 | 208108 | 1806.27 | 498 | 501 | 114.9 |
| C | 14 | 254 | 154694 | 1341.55 | 498 | 501 | 114.9 |
| D | 12 | 191 | 158310 | 1233.45 | 520 | 505 | 127.9 |
| D | 1 | 47 | 141475 | 1101.86 | 520 | 505 | 127.9 |
| D | 2 | 153 | 61371 | 475.75 | 520 | 505 | 127.9 |
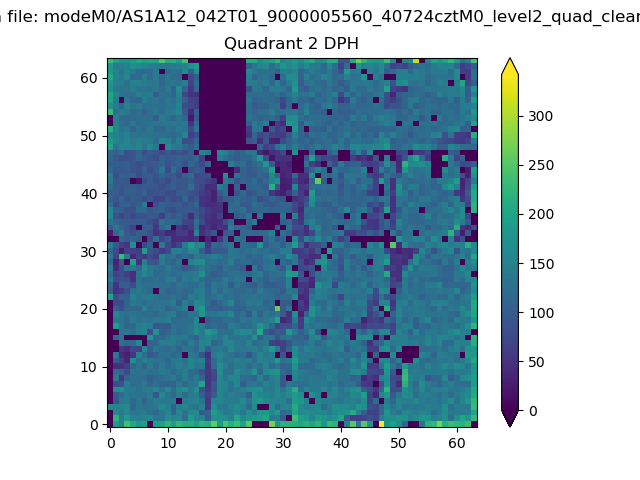
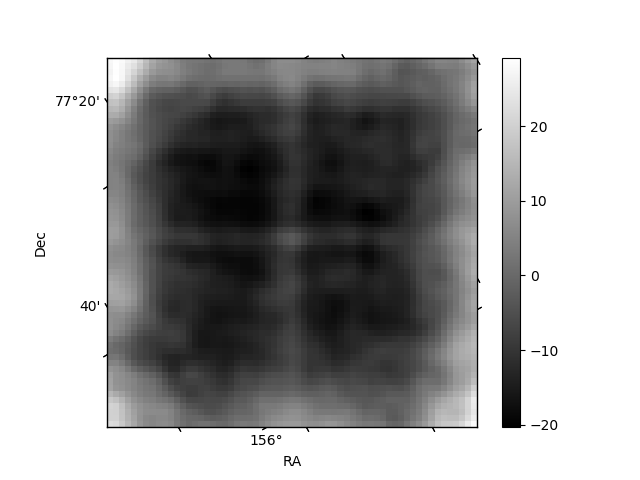
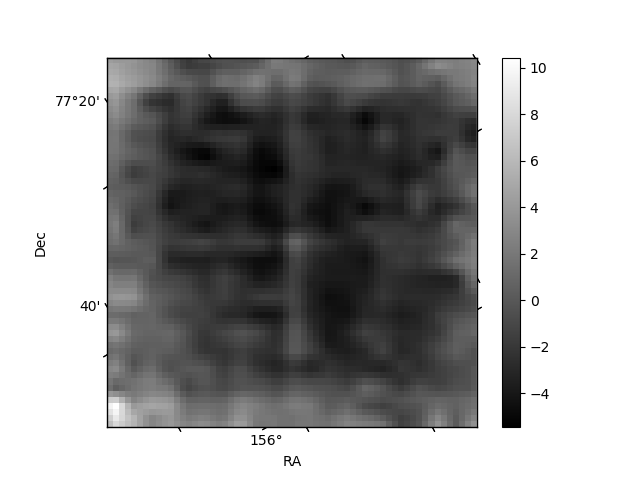
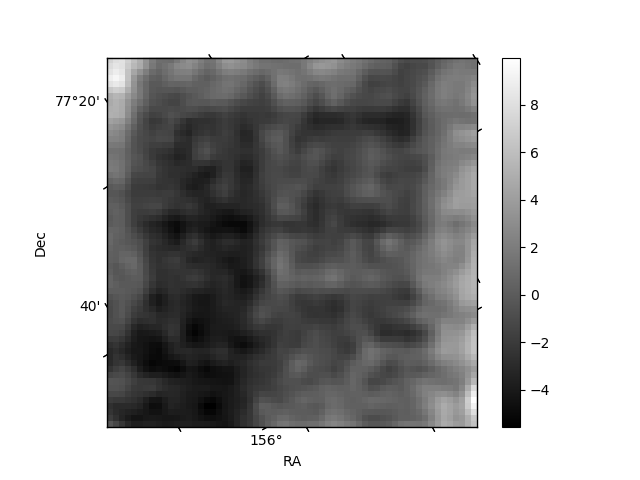
Histogram calculated using DETX and DETY for each event in the final _common_clean file
| Quadrant A | 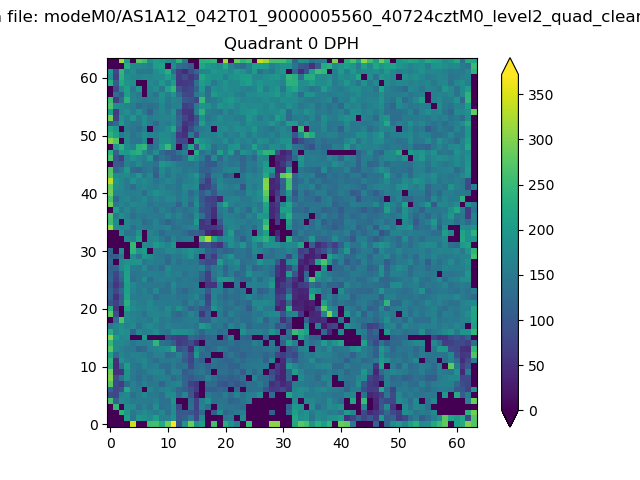 |
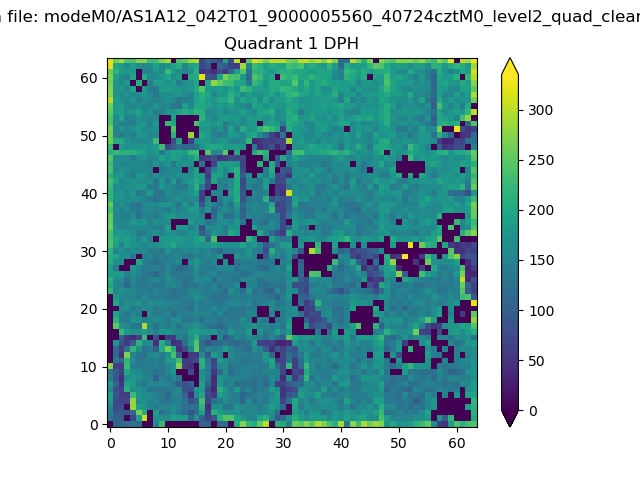 |
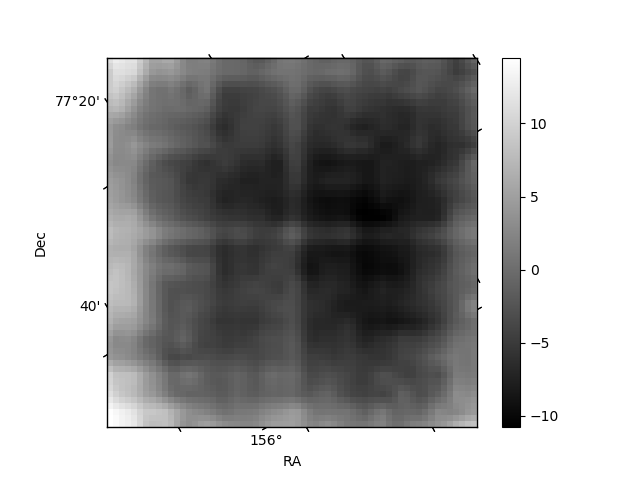
Quadrant B |
|---|---|---|---|
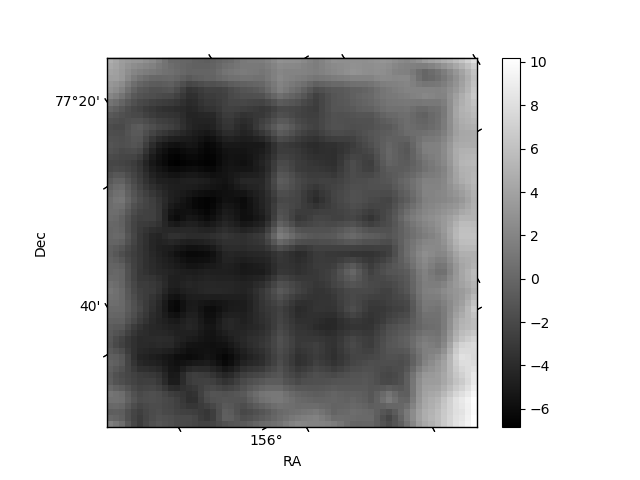
| Quadrant D | 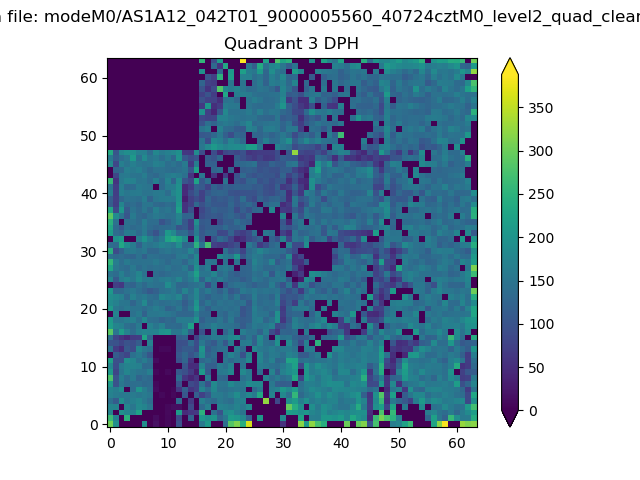 |
 |
Quadrant C |
| Plot type | Count rate plots | Images |
|---|---|---|
| Comparison with Poisson distribution Blue bars denote a histogram of data divided into 1 sec bins. Red curve is a Poisson curve with rate = median count rate of data. |
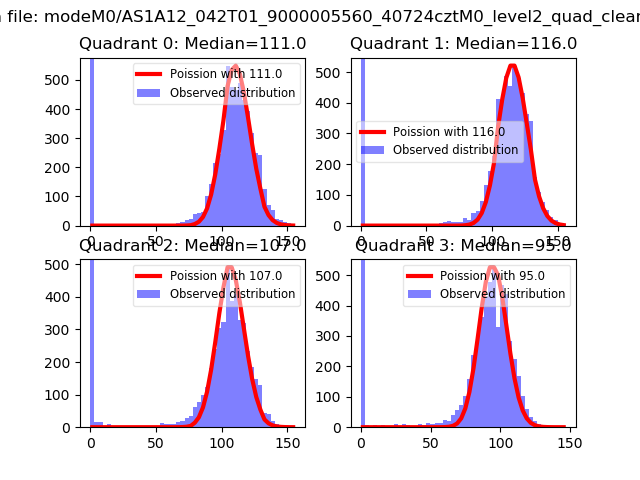 |
 |
| Quadrant-wise count rates Data is divided into 100 sec bins |
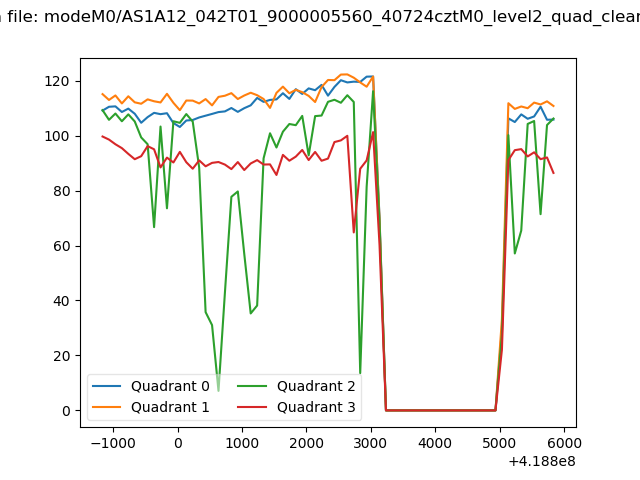 |
|
| Module-wise count rates for Quadrant A Data is divided into 100 sec bins |
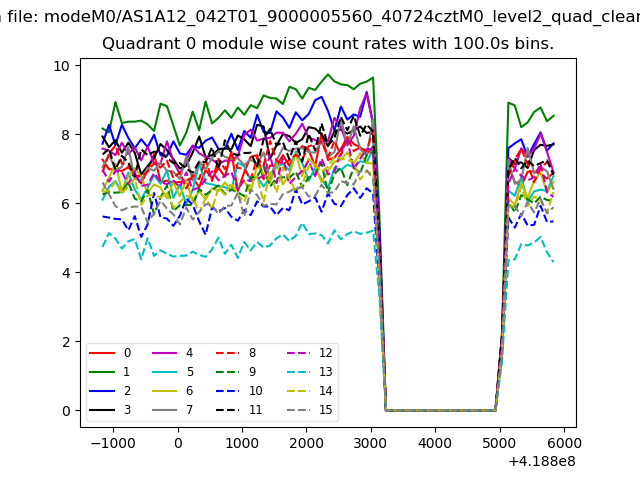 |
 |
| Module-wise count rates for Quadrant B Data is divided into 100 sec bins |
 |
 |
| Module-wise count rates for Quadrant C Data is divided into 100 sec bins |
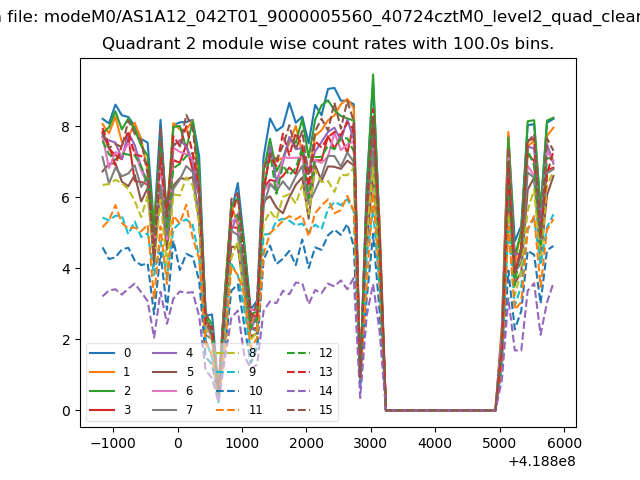 |
 |
| Module-wise count rates for Quadrant D Data is divided into 100 sec bins |
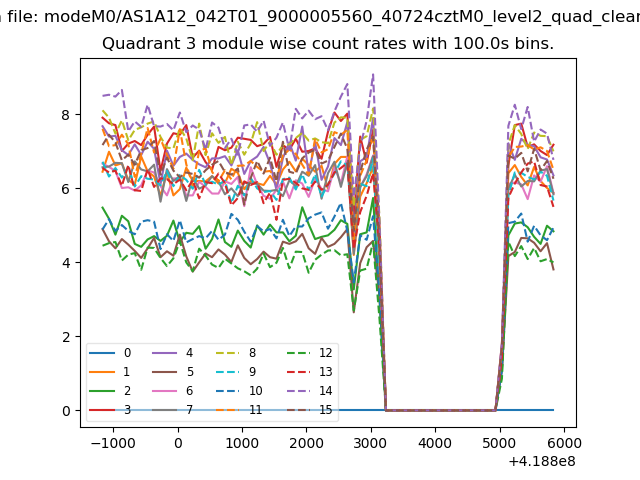 |
 |
| Parameter | Plot |
|---|---|
| CZT HV Monitor | 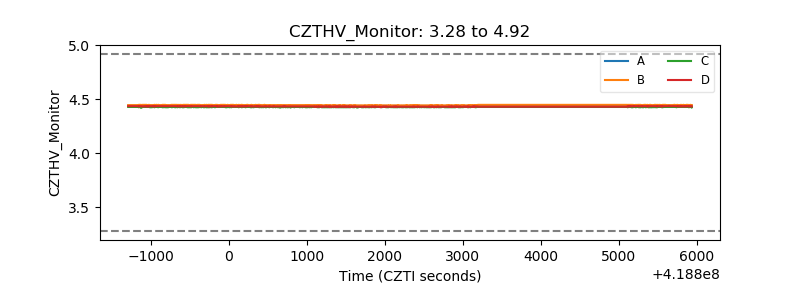 |
| D_VDD | 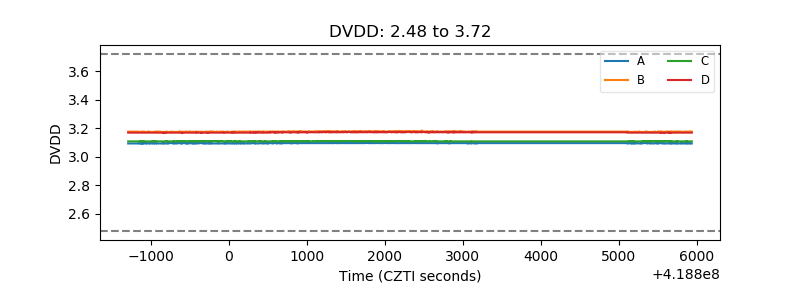 |
| Temperature 1 | 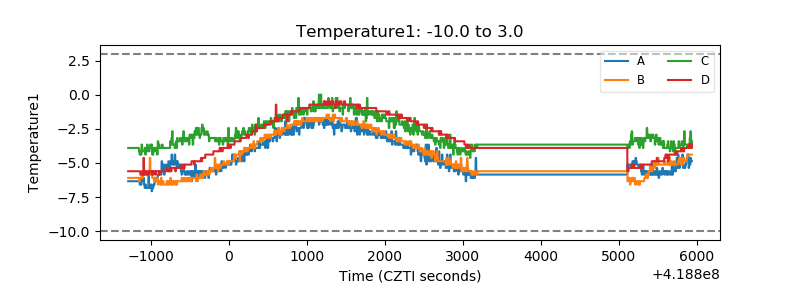 |
| Veto HV Monitor | 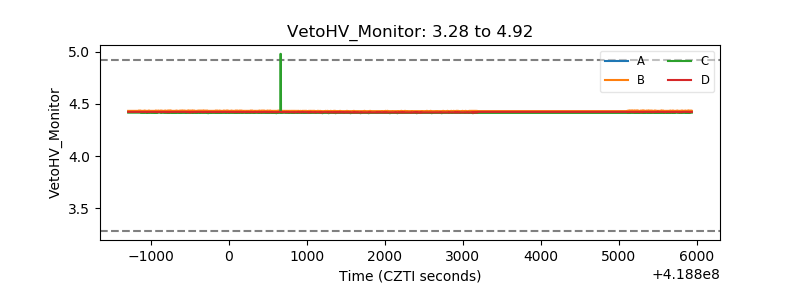 |
| Veto LLD | 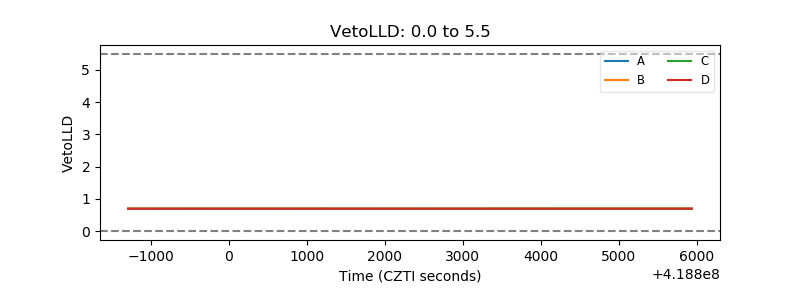 |
| Alpha Counter | 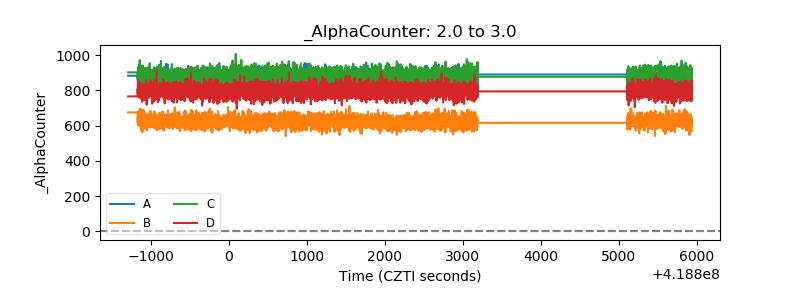 |
| _CPM_Rate | 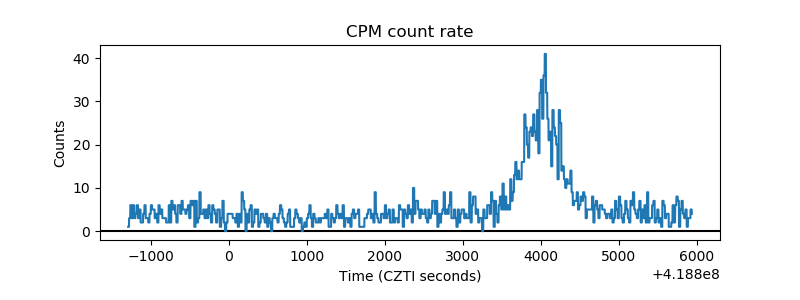 |
| CZT Counter | 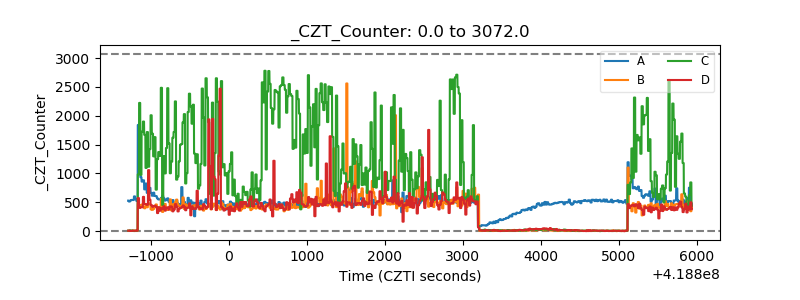 |
| +2.5 Volts monitor | 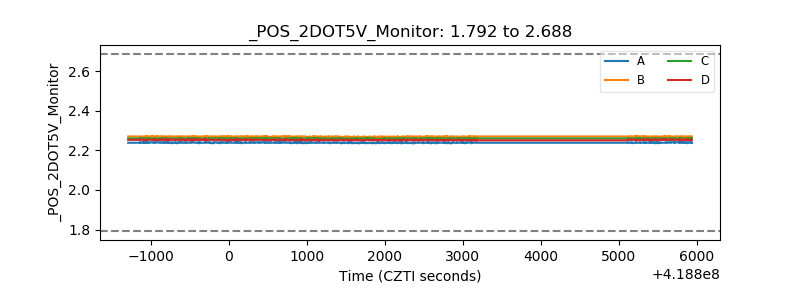 |
| +5 Volts monitor | 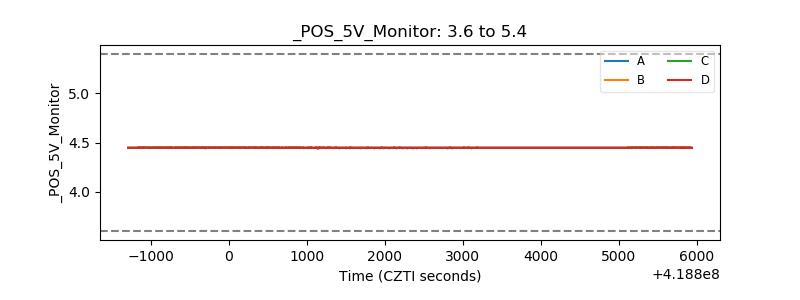 |
| _ROLL_ROT | 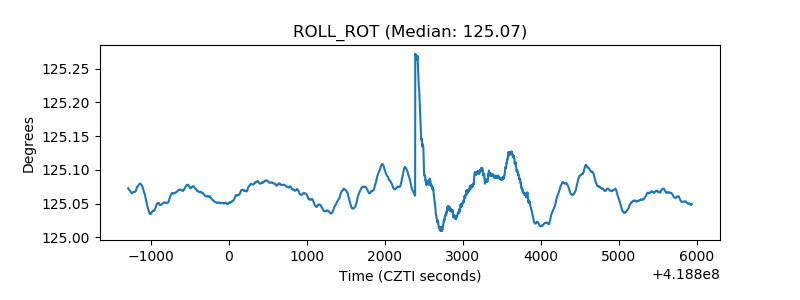 |
| _Roll_DEC | 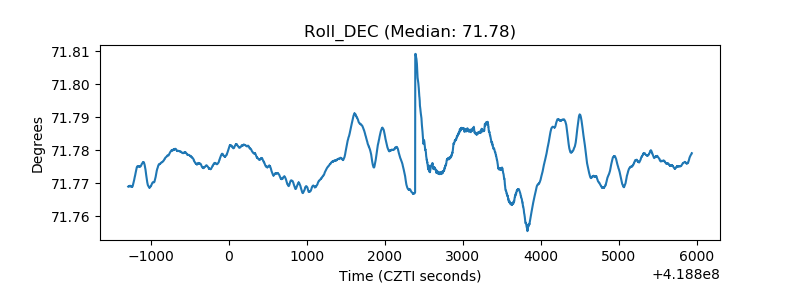 |
| _Roll_RA | 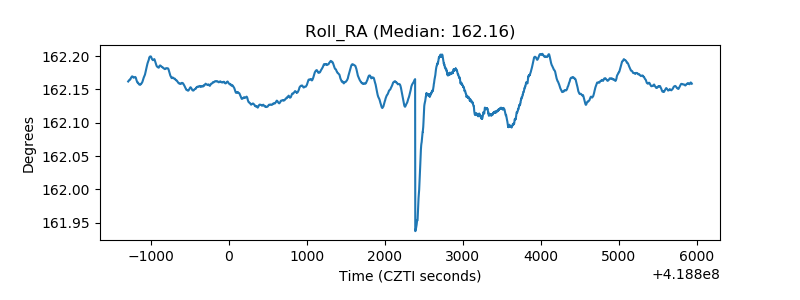 |
| Veto Counter | 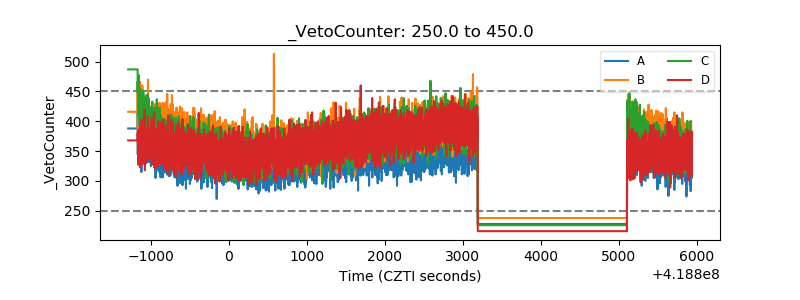 |