| Param | Original file | Final file |
|---|---|---|
| Filename | modeM0/AS1A12_042T01_9000005560_40725cztM0_level2.fits | modeM0/AS1A12_042T01_9000005560_40725cztM0_level2_quad_clean.evt |
| Size (bytes) | 407,053,440 | 83,934,720 |
| Size | 388.2 MB | 80.0 MB |
| Events in quadrant A | 2,966,804 | 609,235 |
| Events in quadrant B | 2,754,163 | 626,571 |
| Events in quadrant C | 5,548,676 | 552,458 |
| Events in quadrant D | 3,364,975 | 364,584 |
| Mode M0 | |||
|---|---|---|---|
| Quadrant | BADHDUFLAG | Total packets | Discarded packets |
| A | 0 | 12004 | 3 |
| B | 0 | 11976 | 2 |
| C | 0 | 20341 | 2 |
| D | 0 | 14152 | 2 |
| Mode M9 | |||
|---|---|---|---|
| Quadrant | BADHDUFLAG | Total packets | Discarded packets |
| A | 0 | 21 | 0 |
| B | 0 | 21 | 0 |
| C | 0 | 21 | 0 |
| D | 0 | 22 | 0 |
| Mode SS | |||
|---|---|---|---|
| Quadrant | BADHDUFLAG | Total packets | Discarded packets |
| A | 0 | 114 | 0 |
| B | 0 | 114 | 0 |
| C | 0 | 114 | 0 |
| D | 0 | 114 | 0 |
| Quadrant | Total seconds | Saturated seconds | Saturation percentage |
|---|---|---|---|
| A | 5546 | 20 | 0.360620% |
| B | 5546 | 47 | 0.847458% |
| C | 5546 | 529 | 9.538406% |
| D | 5546 | 1970 | 35.521096% |
Noise dominated data is calculated using 1-second bins in cleaned event files. If a bin has >2000 counts, and if more than 50% of those come from <1% of pixels, then it is considered to be noise-dominated and hence unusable.
| Quadrant | # 1 sec bins | Bins with >0 counts | Bins with >2000 counts | High rate bins dominated by noise | Noise dominated (total time) | Noise dominated (detector-on time) | Marked lightcurve |
|---|---|---|---|---|---|---|---|
| A | 7129 | 5547 | 13 | 13 | 0.18% | 0.23% | 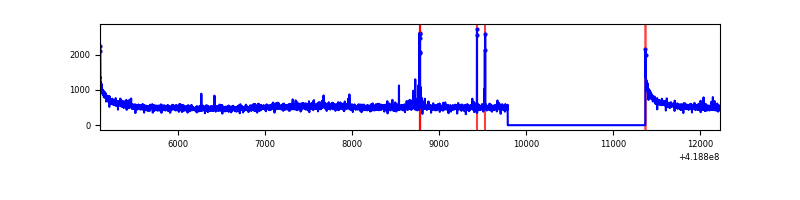 |
| B | 7129 | 5547 | 34 | 34 | 0.48% | 0.61% | 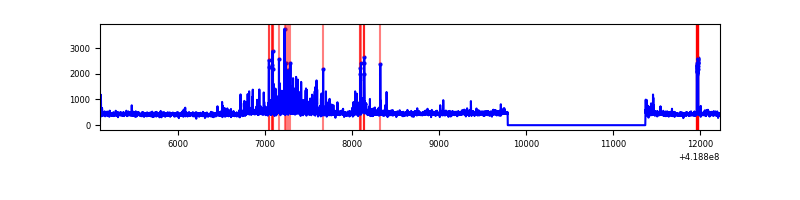 |
| C | 7129 | 5547 | 502 | 502 | 7.04% | 9.05% | 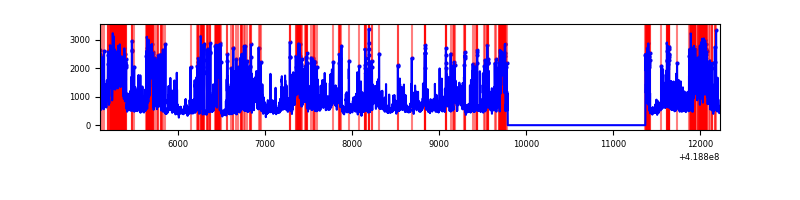 |
| D | 7129 | 5547 | 226 | 226 | 3.17% | 4.07% | 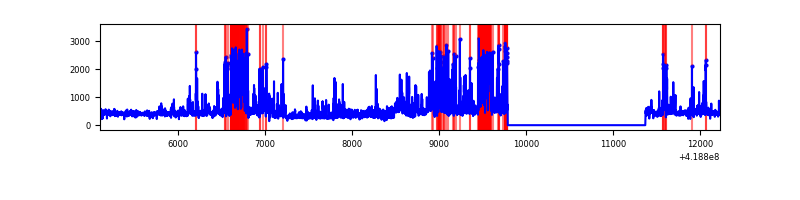 |
Top three noisy pixels from each quadrant. If the there are fewer than three noisy pixels in the level2.evt file, extra rows are filled as -1
| Pixel properties | Quadrant properties | ||||||
|---|---|---|---|---|---|---|---|
| Quadrant | DetID | PixID | Counts | Sigma | Mean | Median | Sigma |
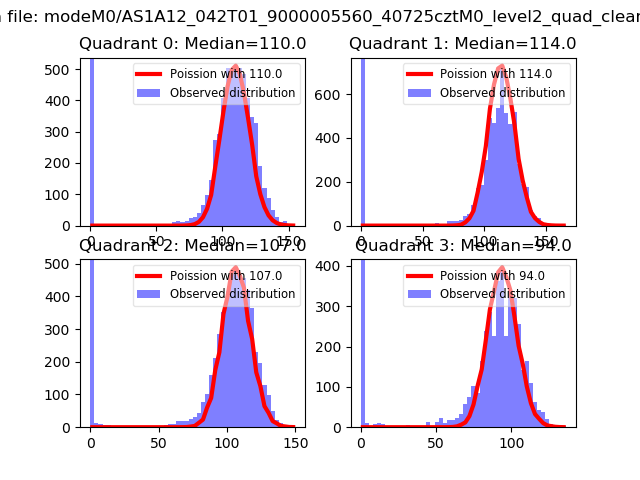
| A | 10 | 83 | 523327 | 4210.46 | 605 | 591 | 124.2 |
| A | 10 | 255 | 40489 | 321.36 | 605 | 591 | 124.2 |
| A | 12 | 189 | 34323 | 271.7 | 605 | 591 | 124.2 |
| B | 0 | 190 | 160350 | 1378.09 | 602 | 584 | 115.9 |
| B | 0 | 229 | 83661 | 716.59 | 602 | 584 | 115.9 |
| B | 5 | 255 | 49208 | 419.41 | 602 | 584 | 115.9 |
| C | 9 | 187 | 2876725 | 21783.73 | 570 | 571 | 132.0 |
| C | 15 | 214 | 233628 | 1765.15 | 570 | 571 | 132.0 |
| C | 14 | 254 | 148623 | 1121.33 | 570 | 571 | 132.0 |
| D | 1 | 47 | 563675 | 5016.27 | 453 | 439 | 112.3 |
| D | 12 | 191 | 324880 | 2889.52 | 453 | 439 | 112.3 |
| D | 2 | 249 | 296625 | 2637.88 | 453 | 439 | 112.3 |
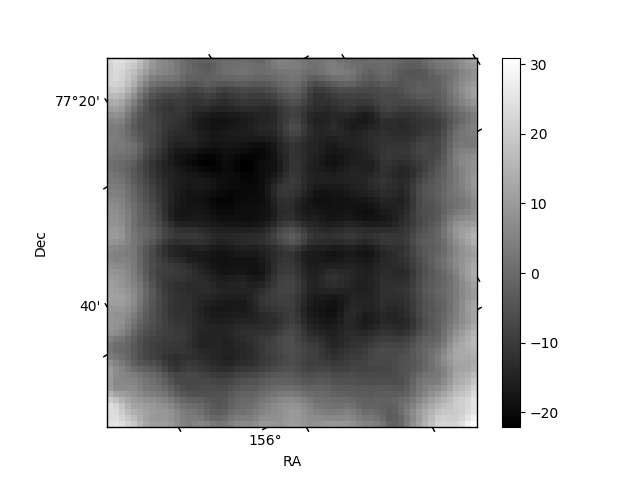
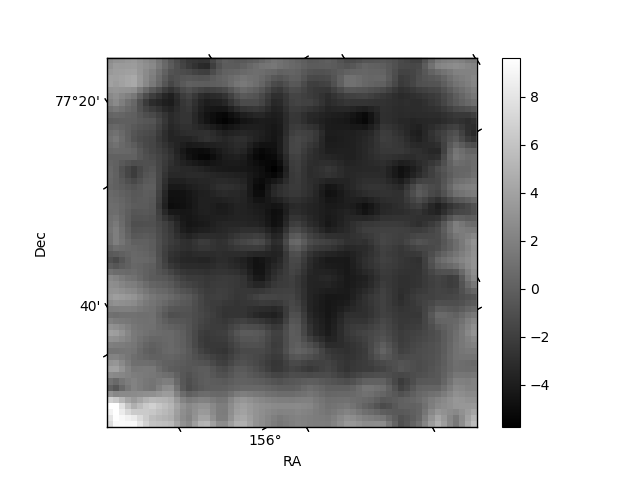
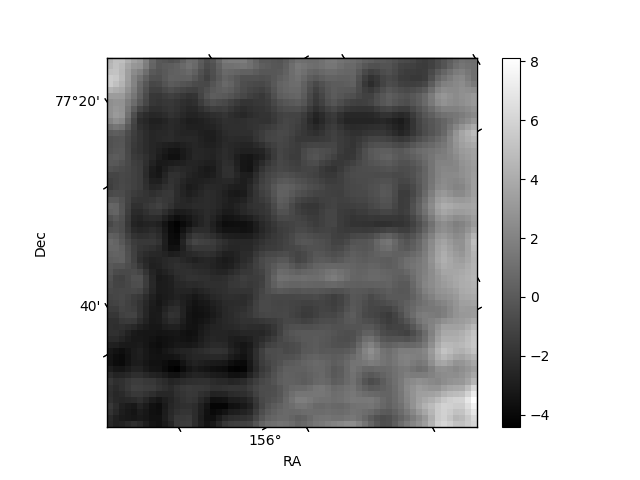
Histogram calculated using DETX and DETY for each event in the final _common_clean file
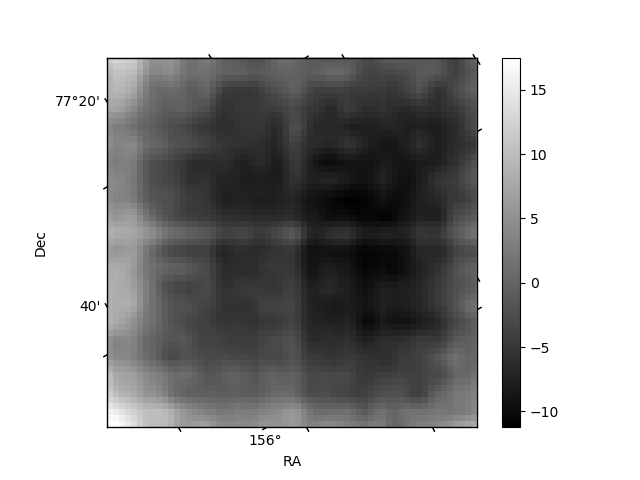
| Quadrant A | 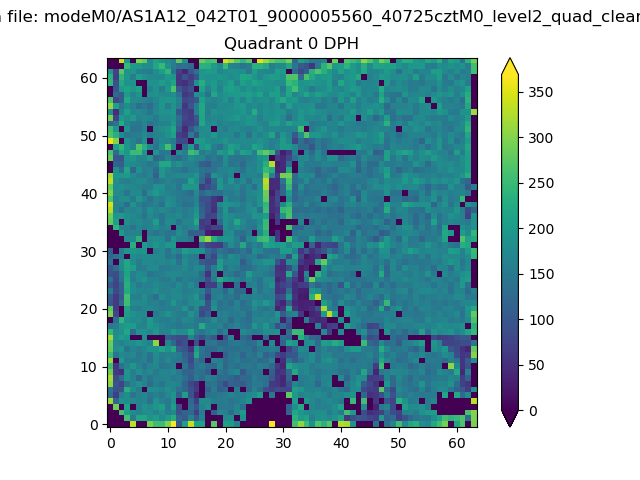 |
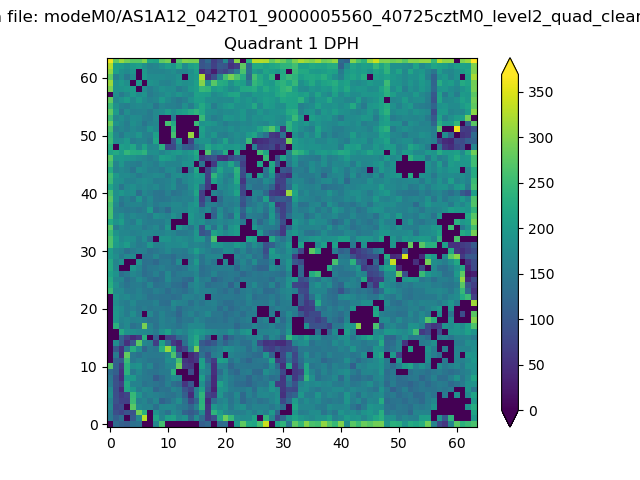 |
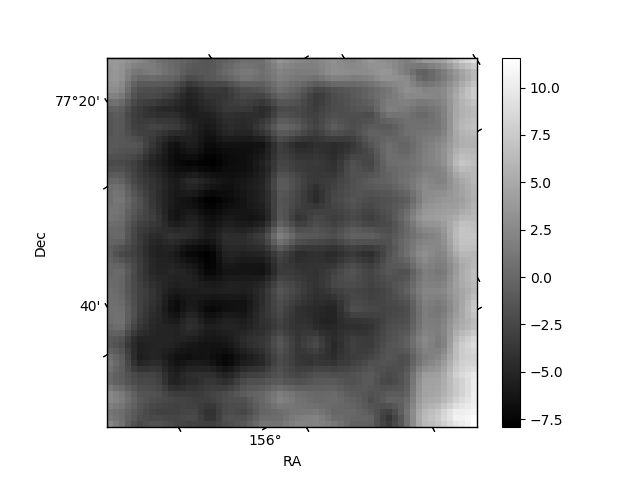
Quadrant B |
|---|---|---|---|
| Quadrant D | 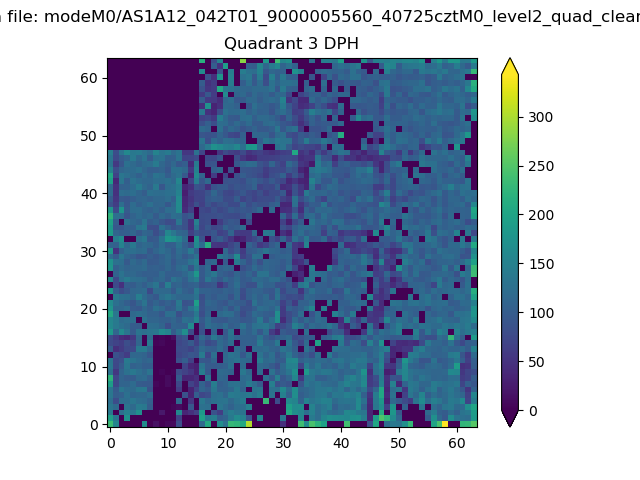 |
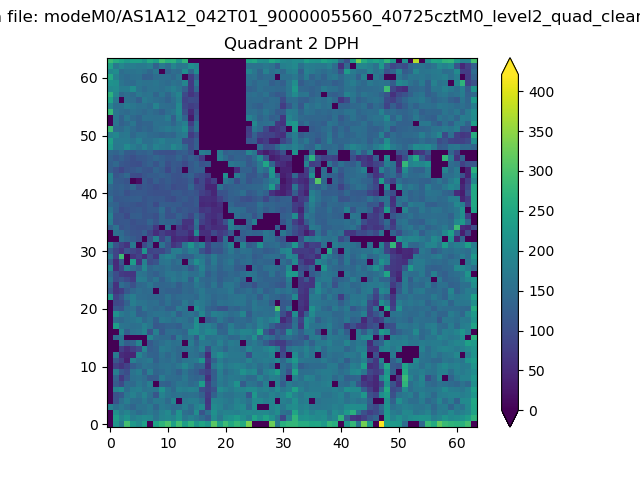 |
Quadrant C |
| Plot type | Count rate plots | Images |
|---|---|---|
| Comparison with Poisson distribution Blue bars denote a histogram of data divided into 1 sec bins. Red curve is a Poisson curve with rate = median count rate of data. |
 |
 |
| Quadrant-wise count rates Data is divided into 100 sec bins |
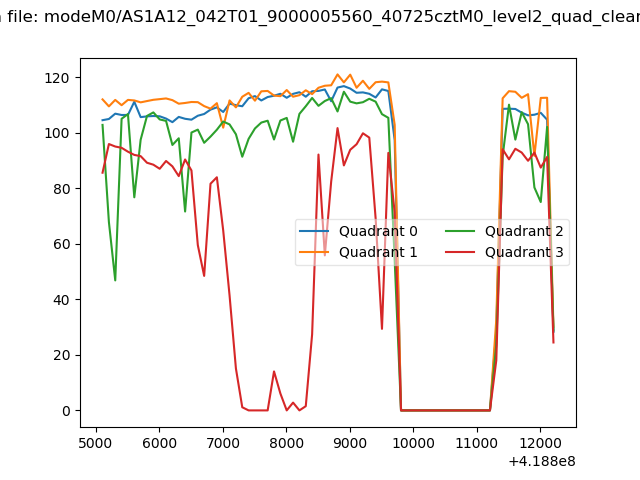 |
|
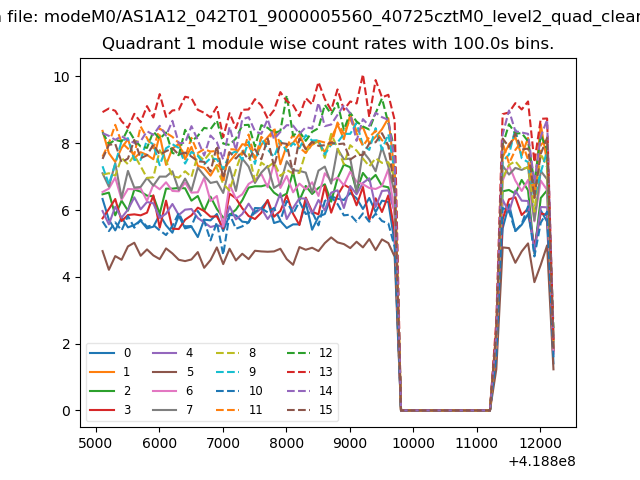
| Module-wise count rates for Quadrant A Data is divided into 100 sec bins |
 |
 |
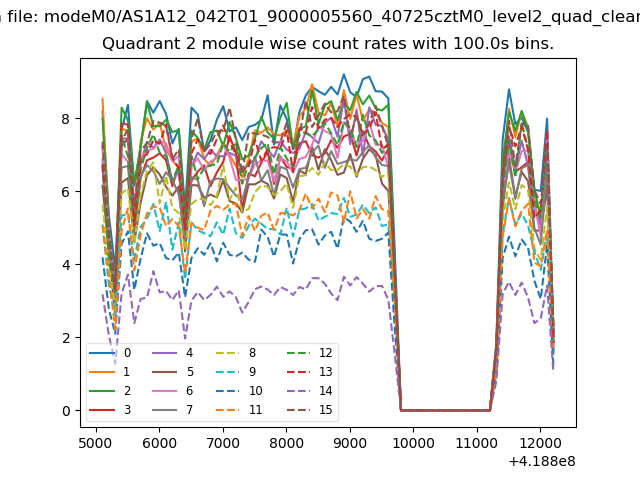
| Module-wise count rates for Quadrant B Data is divided into 100 sec bins |
 |
 |
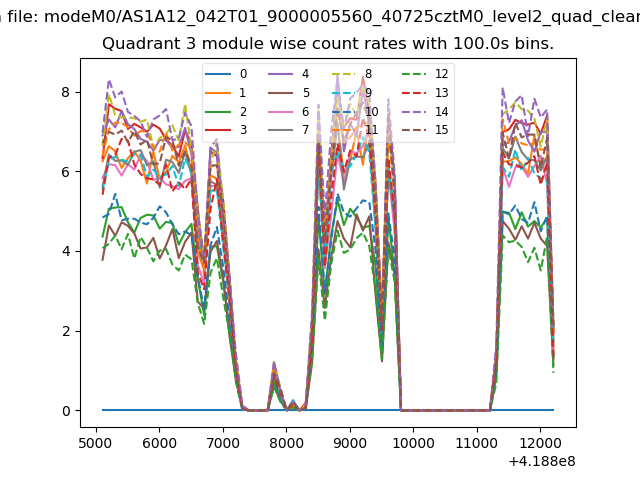
| Module-wise count rates for Quadrant C Data is divided into 100 sec bins |
 |
 |
| Module-wise count rates for Quadrant D Data is divided into 100 sec bins |
 |
 |
| Parameter | Plot |
|---|---|
| CZT HV Monitor |  |
| D_VDD | 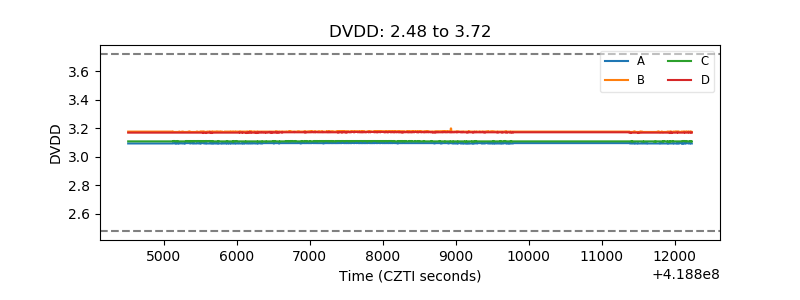 |
| Temperature 1 | 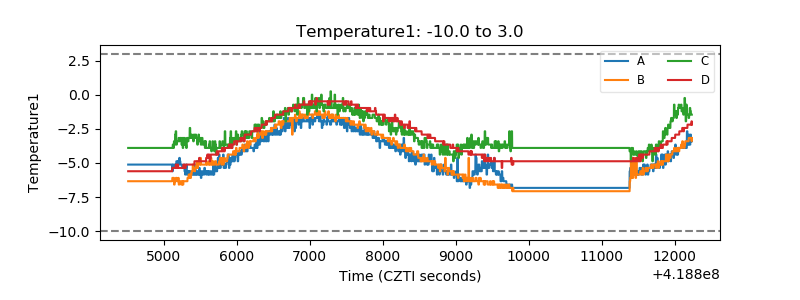 |
| Veto HV Monitor | 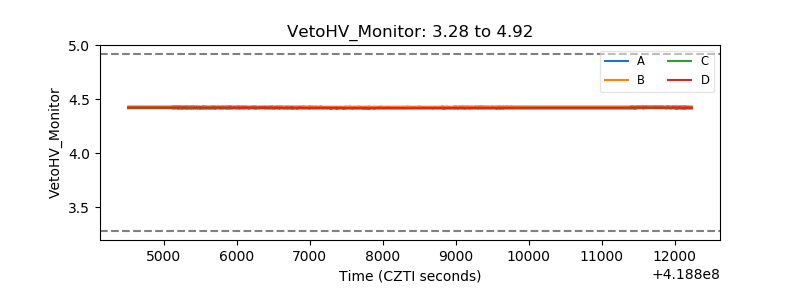 |
| Veto LLD | 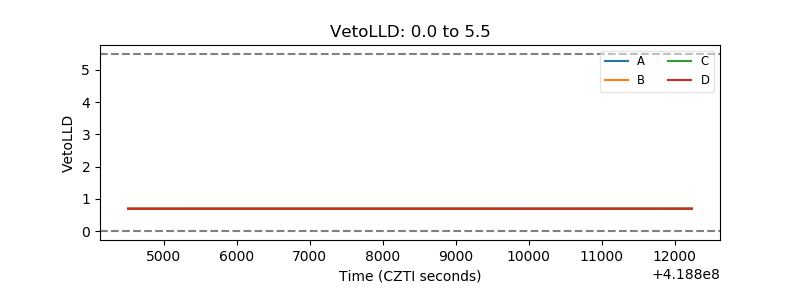 |
| Alpha Counter | 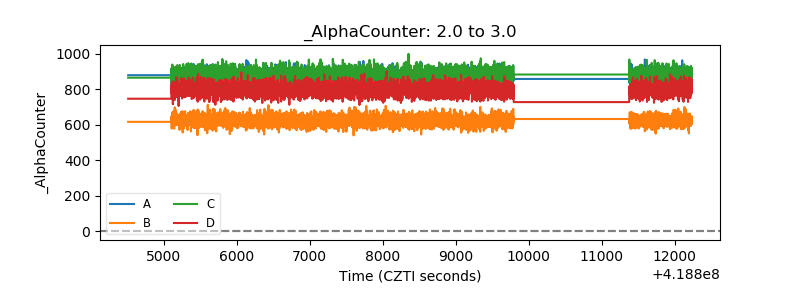 |
| _CPM_Rate | 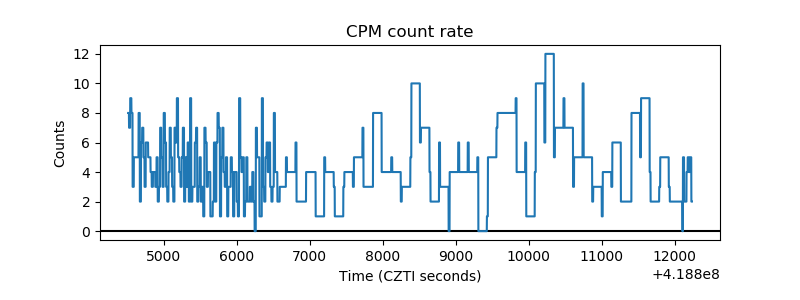 |
| CZT Counter | 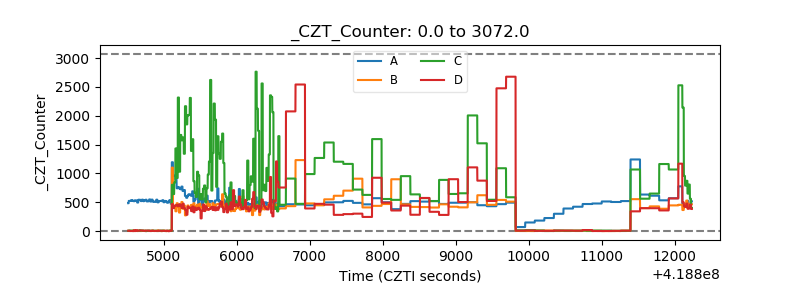 |
| +2.5 Volts monitor | 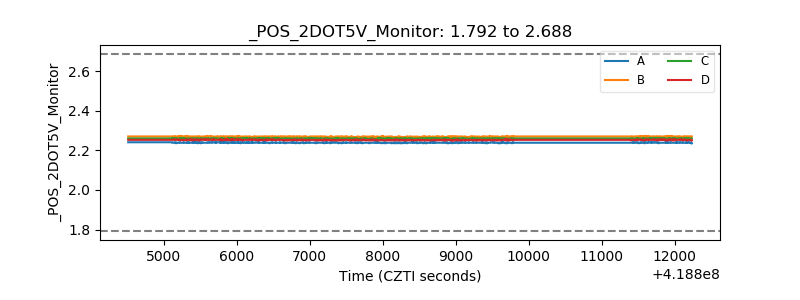 |
| +5 Volts monitor | 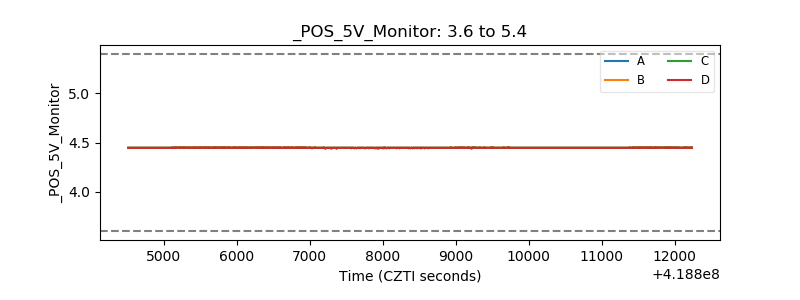 |
| _ROLL_ROT | 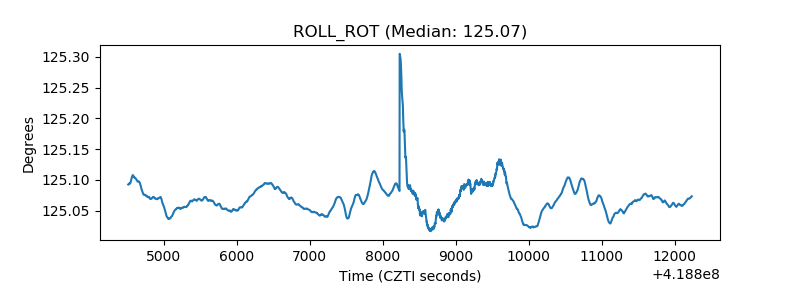 |
| _Roll_DEC | 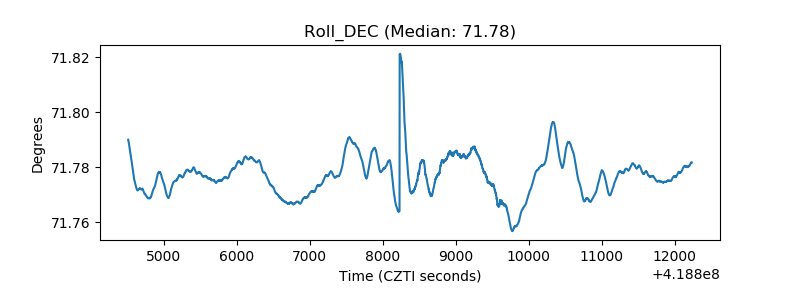 |
| _Roll_RA | 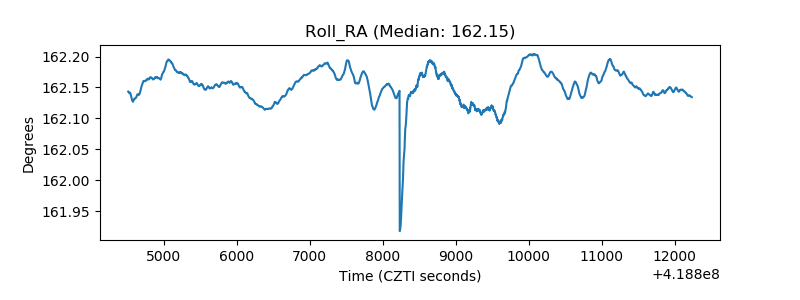 |
| Veto Counter | 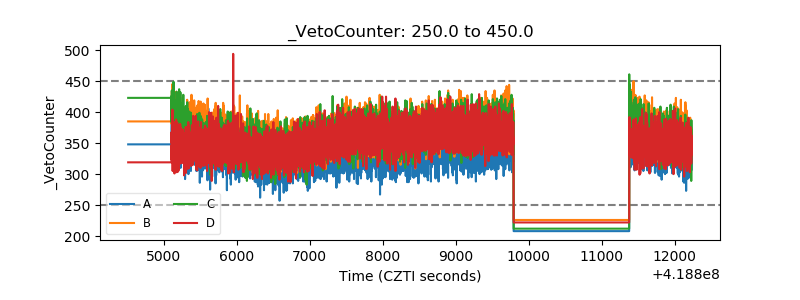 |