| Param | Original file | Final file |
|---|---|---|
| Filename | modeM0/AS1A12_042T01_9000005560_40727cztM0_level2.fits | modeM0/AS1A12_042T01_9000005560_40727cztM0_level2_quad_clean.evt |
| Size (bytes) | 291,654,720 | 49,184,640 |
| Size | 278.1 MB | 46.9 MB |
| Events in quadrant A | 1,738,865 | 361,933 |
| Events in quadrant B | 1,868,168 | 367,681 |
| Events in quadrant C | 4,663,259 | 288,951 |
| Events in quadrant D | 2,265,316 | 234,552 |
| Mode M0 | |||
|---|---|---|---|
| Quadrant | BADHDUFLAG | Total packets | Discarded packets |
| A | 0 | 7105 | 4 |
| B | 0 | 7797 | 1 |
| C | 0 | 16185 | 8 |
| D | 0 | 8984 | 1 |
| Mode M9 | |||
|---|---|---|---|
| Quadrant | BADHDUFLAG | Total packets | Discarded packets |
| A | 0 | 5 | 0 |
| B | 0 | 5 | 0 |
| C | 0 | 5 | 0 |
| D | 0 | 6 | 0 |
| Mode SS | |||
|---|---|---|---|
| Quadrant | BADHDUFLAG | Total packets | Discarded packets |
| A | 0 | 66 | 0 |
| B | 0 | 66 | 0 |
| C | 0 | 66 | 0 |
| D | 0 | 66 | 0 |
| Quadrant | Total seconds | Saturated seconds | Saturation percentage |
|---|---|---|---|
| A | 3322 | 5 | 0.150512% |
| B | 3324 | 40 | 1.203369% |
| C | 3322 | 805 | 24.232390% |
| D | 3324 | 1035 | 31.137184% |
Noise dominated data is calculated using 1-second bins in cleaned event files. If a bin has >2000 counts, and if more than 50% of those come from <1% of pixels, then it is considered to be noise-dominated and hence unusable.
| Quadrant | # 1 sec bins | Bins with >0 counts | Bins with >2000 counts | High rate bins dominated by noise | Noise dominated (total time) | Noise dominated (detector-on time) | Marked lightcurve |
|---|---|---|---|---|---|---|---|
| A | 3324 | 3323 | 2 | 2 | 0.06% | 0.06% |  |
| B | 3324 | 3324 | 28 | 28 | 0.84% | 0.84% | 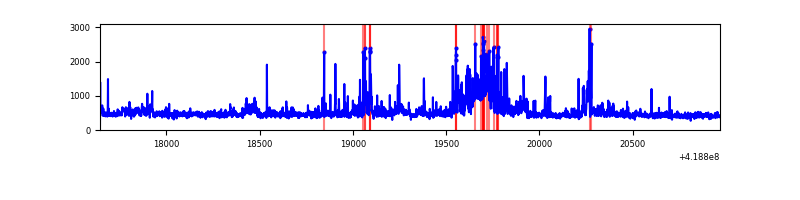 |
| C | 3324 | 3323 | 741 | 741 | 22.29% | 22.30% | 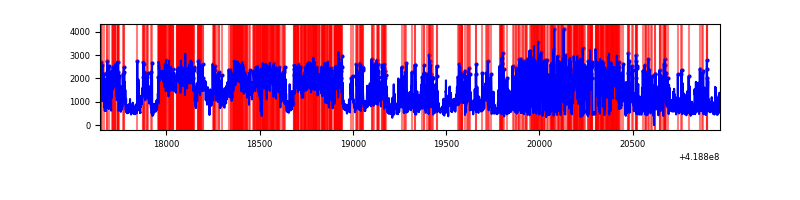 |
| D | 3324 | 3324 | 117 | 117 | 3.52% | 3.52% | 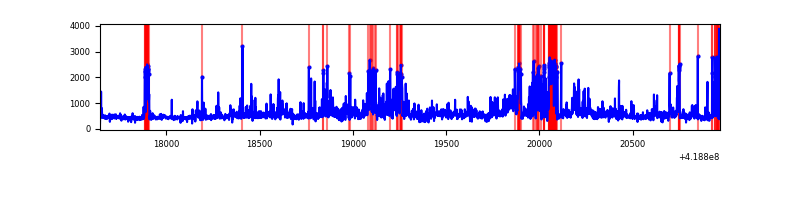 |
Top three noisy pixels from each quadrant. If the there are fewer than three noisy pixels in the level2.evt file, extra rows are filled as -1
| Pixel properties | Quadrant properties | ||||||
|---|---|---|---|---|---|---|---|
| Quadrant | DetID | PixID | Counts | Sigma | Mean | Median | Sigma |
| A | 10 | 83 | 307925 | 4103.82 | 358 | 350 | 74.9 |
| A | 6 | 10 | 16527 | 215.84 | 358 | 350 | 74.9 |
| A | 13 | 248 | 16017 | 209.04 | 358 | 350 | 74.9 |
| B | 4 | 170 | 201678 | 2918.87 | 354 | 345 | 69.0 |
| B | 15 | 85 | 94971 | 1371.86 | 354 | 345 | 69.0 |
| B | 0 | 229 | 63863 | 920.87 | 354 | 345 | 69.0 |
| C | 9 | 187 | 3229512 | 42376.23 | 324 | 324 | 76.2 |
| C | 15 | 214 | 135115 | 1768.85 | 324 | 324 | 76.2 |
| C | 5 | 10 | 18963 | 244.6 | 324 | 324 | 76.2 |
| D | 13 | 249 | 294981 | 3876.16 | 304 | 295 | 76.0 |
| D | 12 | 191 | 175736 | 2307.67 | 304 | 295 | 76.0 |
| D | 1 | 47 | 129141 | 1694.78 | 304 | 295 | 76.0 |
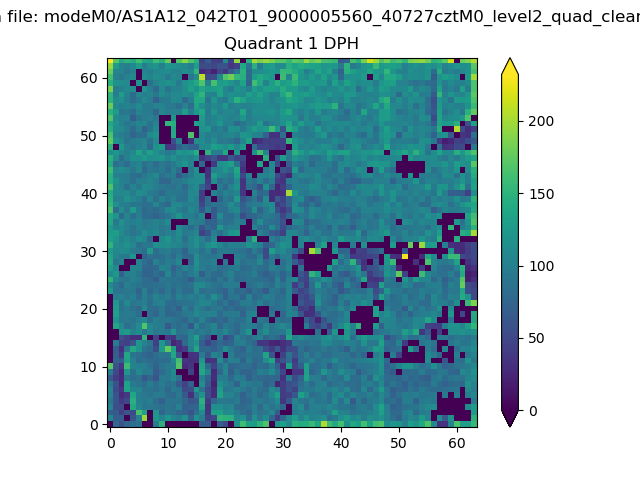
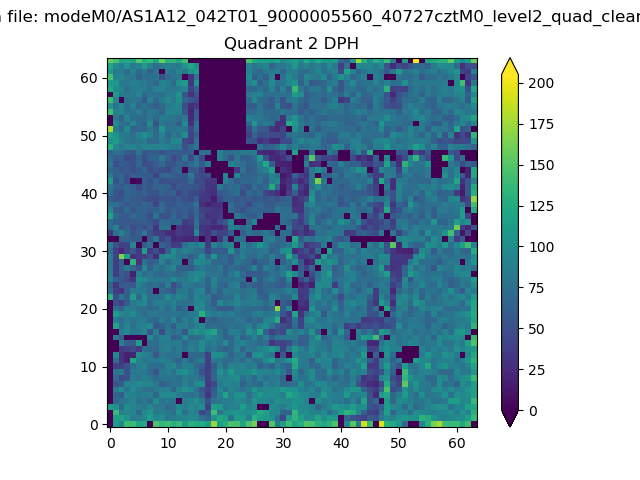
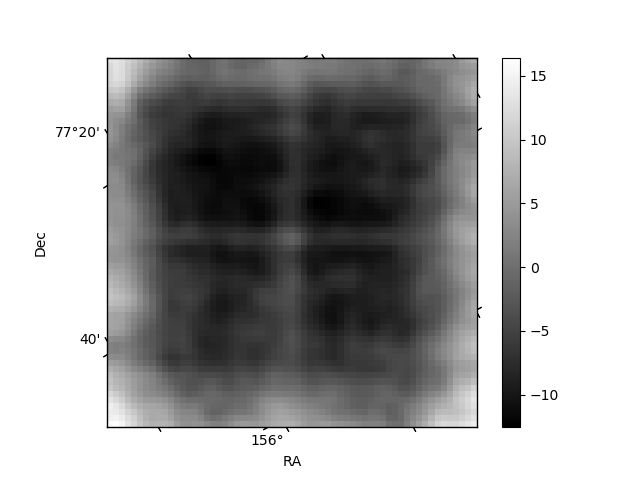
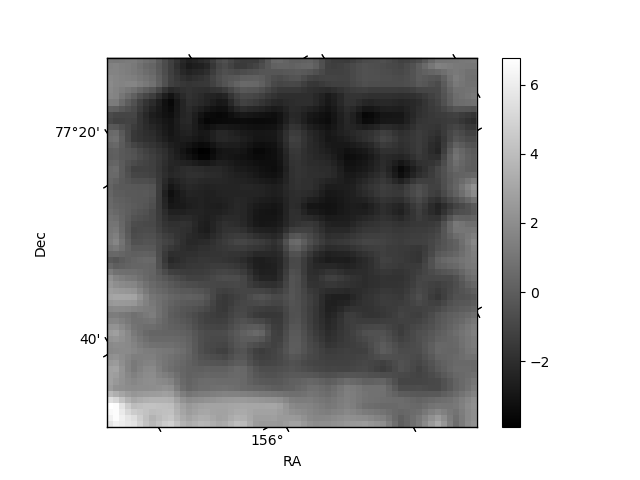
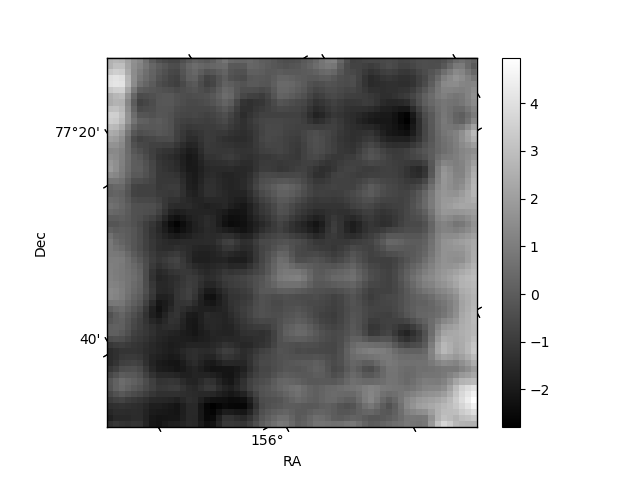
Histogram calculated using DETX and DETY for each event in the final _common_clean file
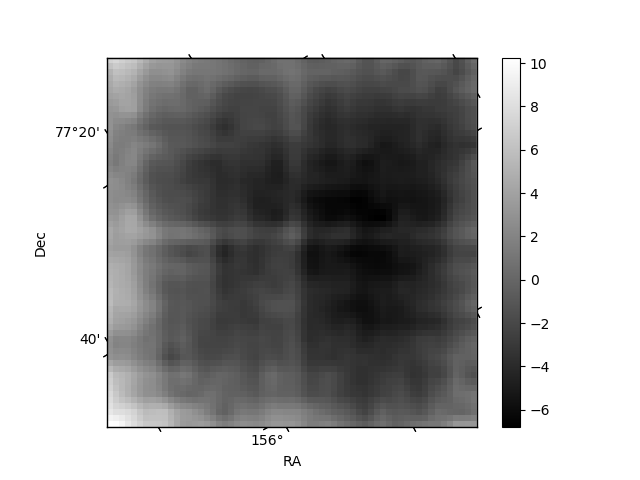
| Quadrant A | 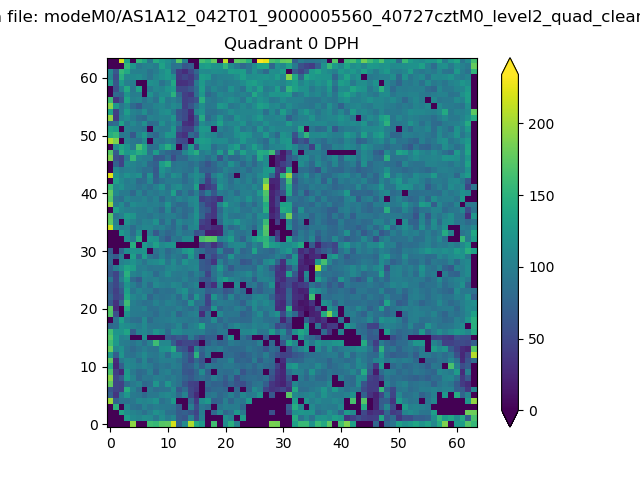 |
 |
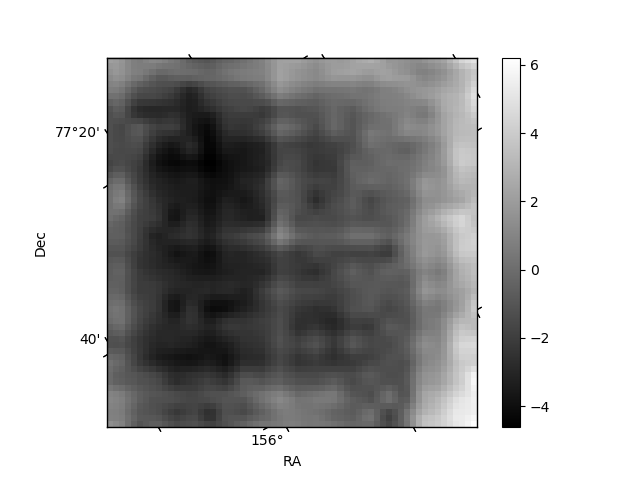
Quadrant B |
|---|---|---|---|
| Quadrant D | 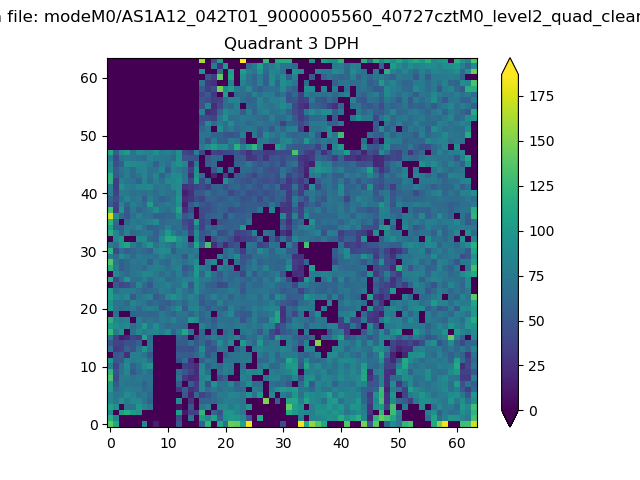 |
 |
Quadrant C |
| Plot type | Count rate plots | Images |
|---|---|---|
| Comparison with Poisson distribution Blue bars denote a histogram of data divided into 1 sec bins. Red curve is a Poisson curve with rate = median count rate of data. |
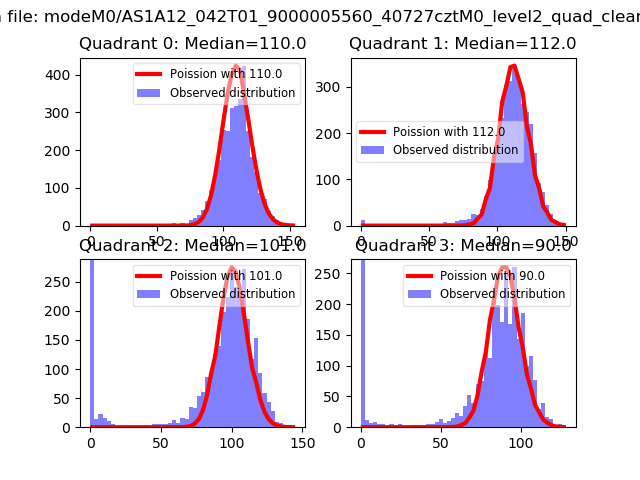 |
 |
| Quadrant-wise count rates Data is divided into 100 sec bins |
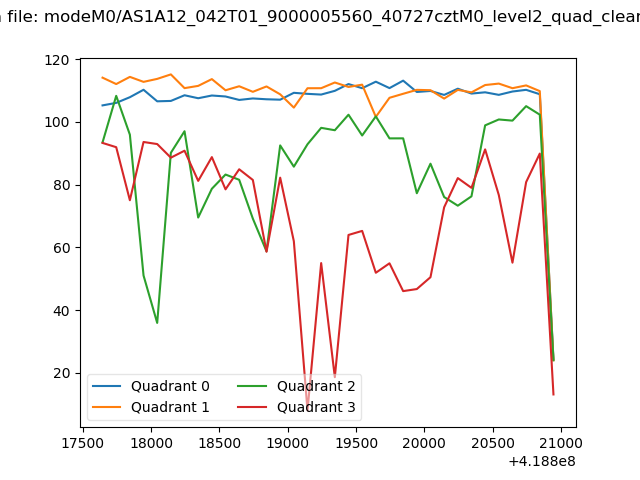 |
|
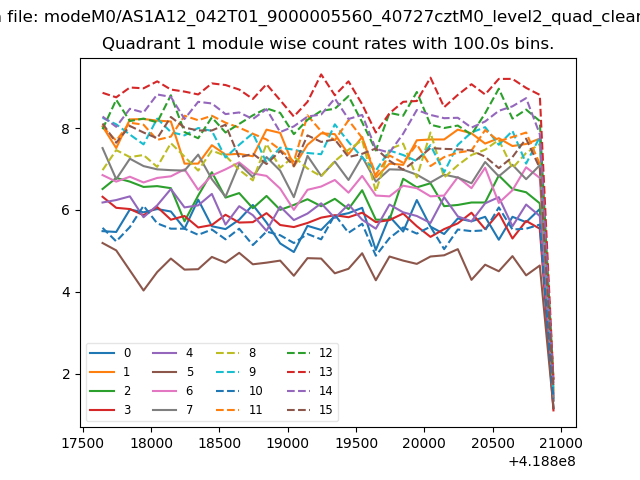
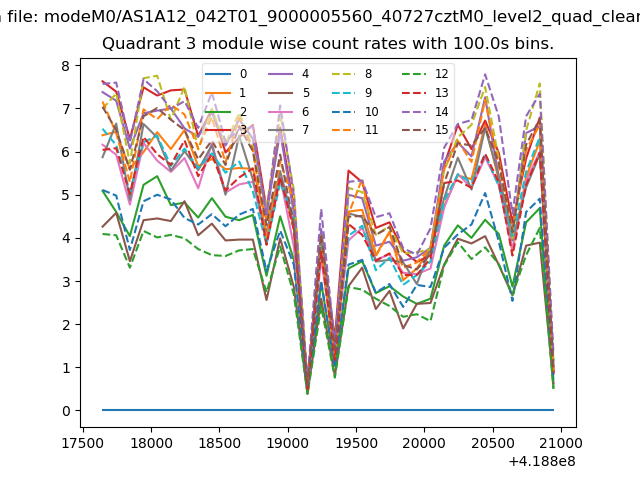
| Module-wise count rates for Quadrant A Data is divided into 100 sec bins |
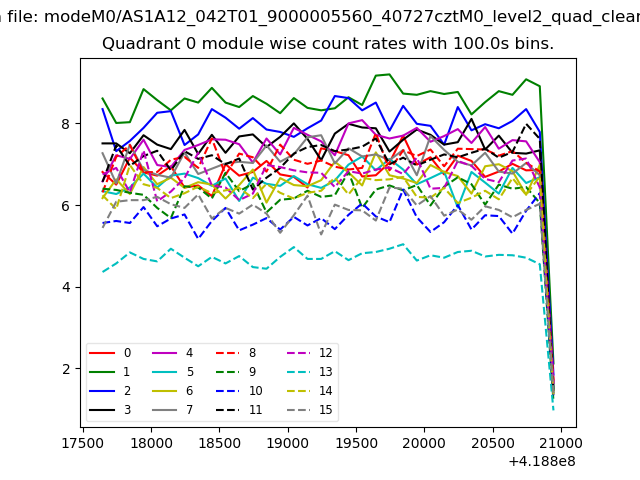 |
 |
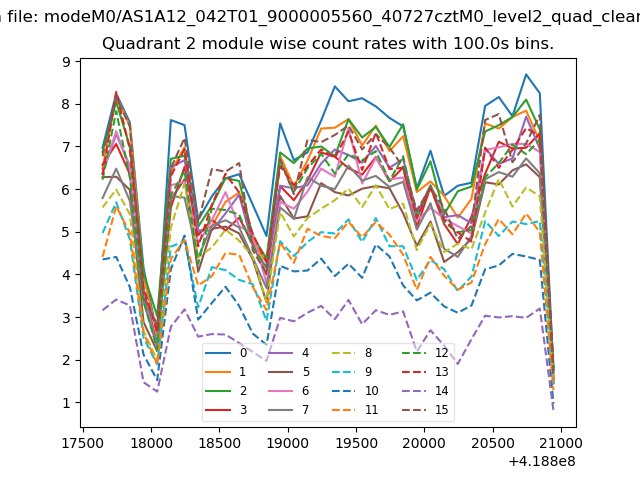
| Module-wise count rates for Quadrant B Data is divided into 100 sec bins |
 |
 |
| Module-wise count rates for Quadrant C Data is divided into 100 sec bins |
 |
 |
| Module-wise count rates for Quadrant D Data is divided into 100 sec bins |
 |
 |
| Parameter | Plot |
|---|---|
| CZT HV Monitor | 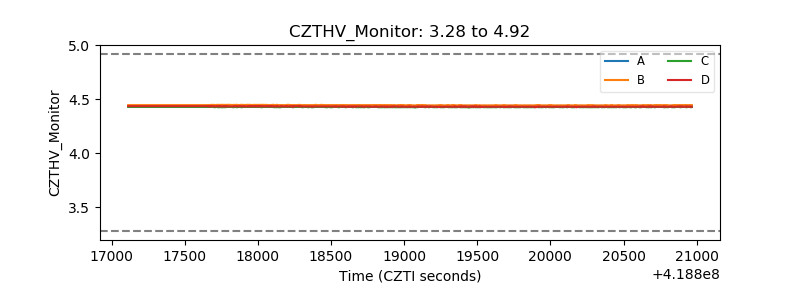 |
| D_VDD | 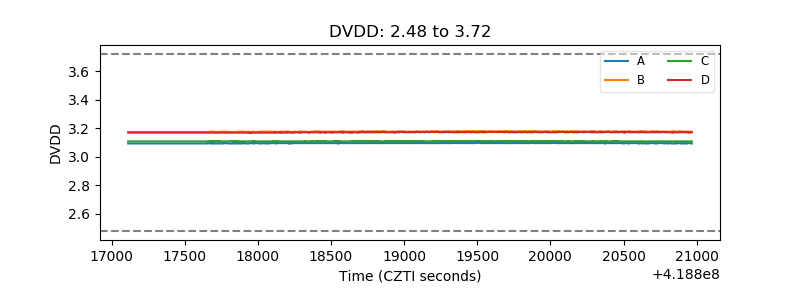 |
| Temperature 1 | 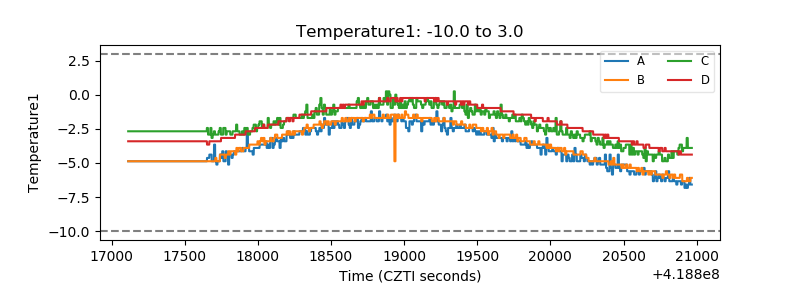 |
| Veto HV Monitor | 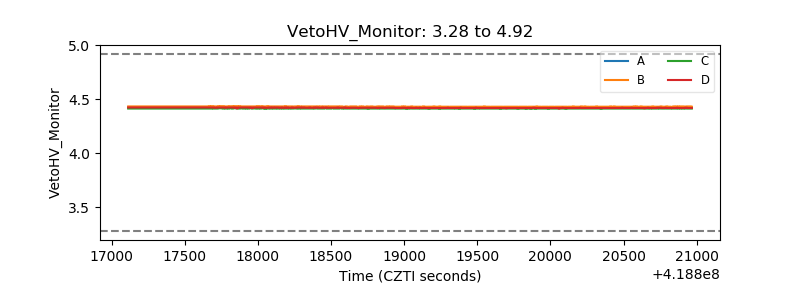 |
| Veto LLD | 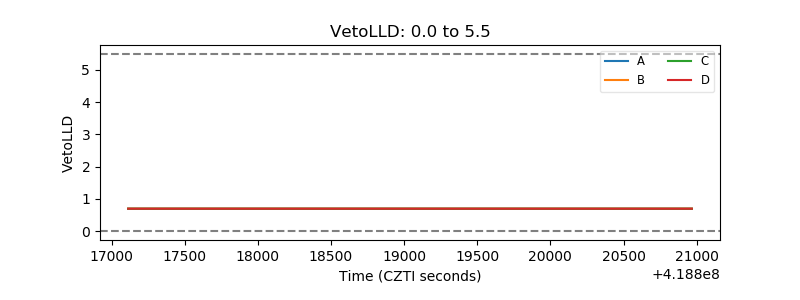 |
| Alpha Counter |  |
| _CPM_Rate | 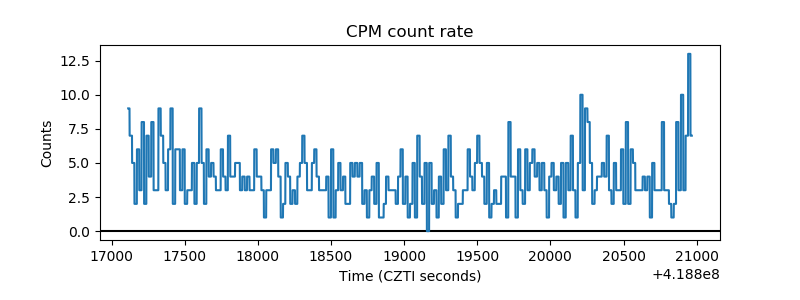 |
| CZT Counter | 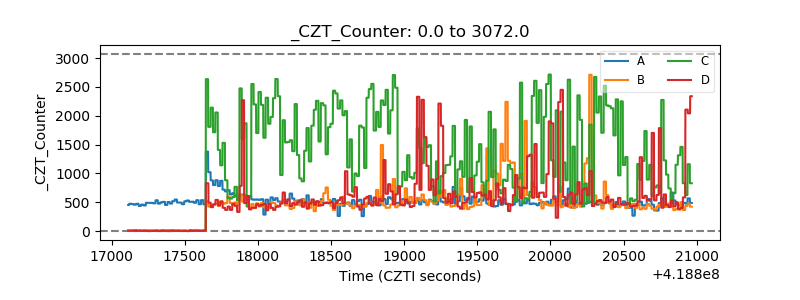 |
| +2.5 Volts monitor |  |
| +5 Volts monitor | 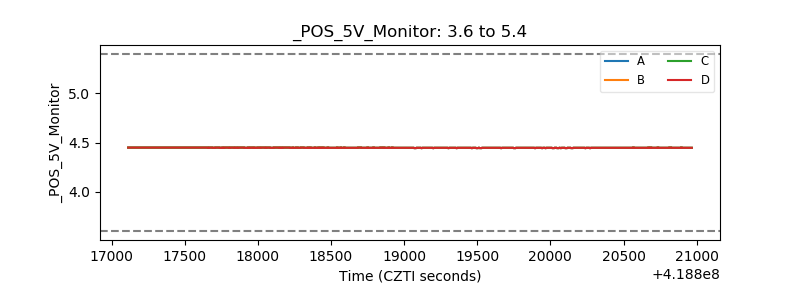 |
| _ROLL_ROT | 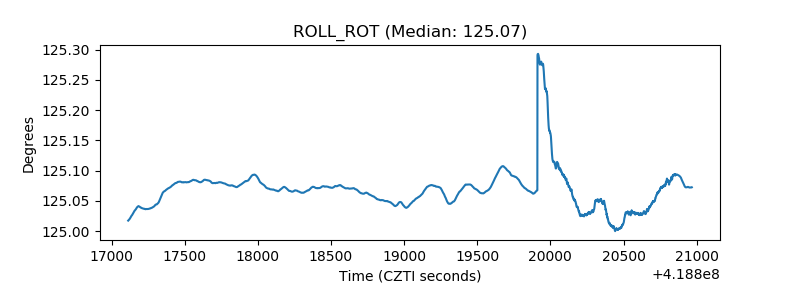 |
| _Roll_DEC | 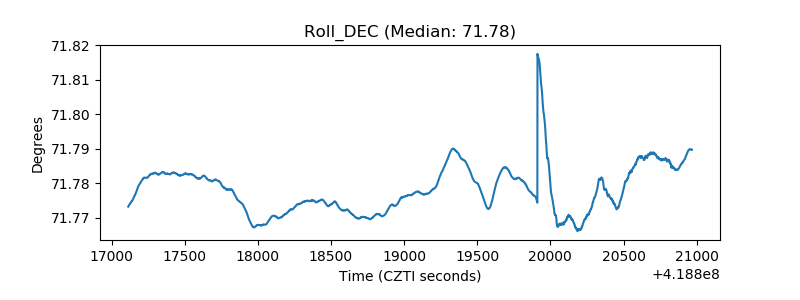 |
| _Roll_RA | 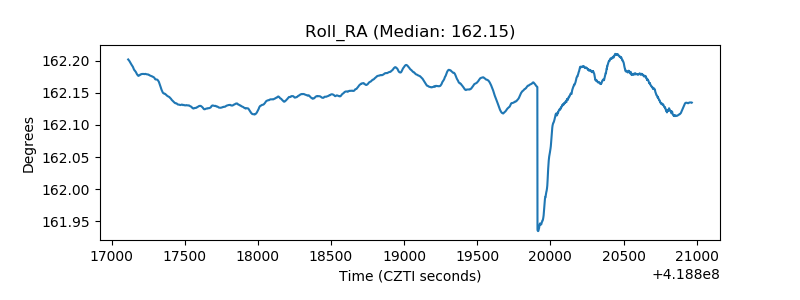 |
| Veto Counter | 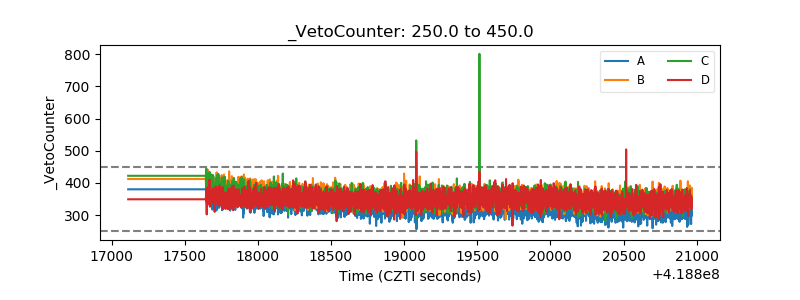 |