| Param | Original file | Final file |
|---|---|---|
| Filename | modeM0/AS1A12_066T01_9000005562_40727cztM0_level2.fits | modeM0/AS1A12_066T01_9000005562_40727cztM0_level2_quad_clean.evt |
| Size (bytes) | 95,967,360 | 20,047,680 |
| Size | 91.5 MB | 19.1 MB |
| Events in quadrant A | 721,079 | 135,898 |
| Events in quadrant B | 673,093 | 138,223 |
| Events in quadrant C | 1,385,927 | 123,936 |
| Events in quadrant D | 670,253 | 113,681 |
| Mode M0 | |||
|---|---|---|---|
| Quadrant | BADHDUFLAG | Total packets | Discarded packets |
| A | 0 | 2897 | 2 |
| B | 0 | 2852 | 1 |
| C | 0 | 4984 | 1 |
| D | 0 | 2831 | 1 |
| Mode M9 | |||
|---|---|---|---|
| Quadrant | BADHDUFLAG | Total packets | Discarded packets |
| A | 0 | 14 | 0 |
| B | 0 | 14 | 0 |
| C | 0 | 14 | 0 |
| D | 0 | 14 | 0 |
| Mode SS | |||
|---|---|---|---|
| Quadrant | BADHDUFLAG | Total packets | Discarded packets |
| A | 0 | 26 | 0 |
| B | 0 | 26 | 0 |
| C | 0 | 26 | 0 |
| D | 0 | 26 | 0 |
| Quadrant | Total seconds | Saturated seconds | Saturation percentage |
|---|---|---|---|
| A | 1273 | 3 | 0.235664% |
| B | 1273 | 27 | 2.120974% |
| C | 1273 | 162 | 12.725844% |
| D | 1273 | 140 | 10.997643% |
Noise dominated data is calculated using 1-second bins in cleaned event files. If a bin has >2000 counts, and if more than 50% of those come from <1% of pixels, then it is considered to be noise-dominated and hence unusable.
| Quadrant | # 1 sec bins | Bins with >0 counts | Bins with >2000 counts | High rate bins dominated by noise | Noise dominated (total time) | Noise dominated (detector-on time) | Marked lightcurve |
|---|---|---|---|---|---|---|---|
| A | 2586 | 1274 | 2 | 2 | 0.08% | 0.16% | 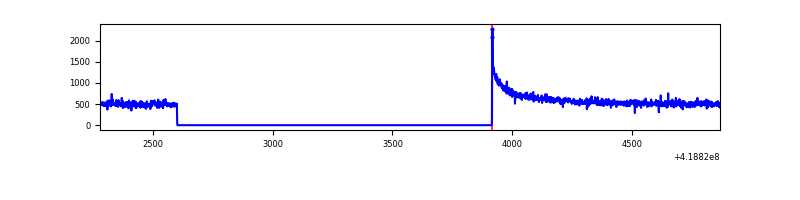 |
| B | 2586 | 1274 | 21 | 21 | 0.81% | 1.65% | 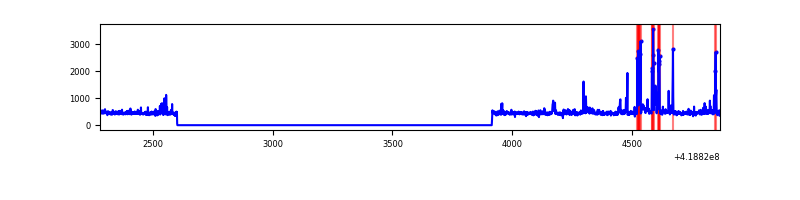 |
| C | 2586 | 1274 | 154 | 154 | 5.96% | 12.09% | 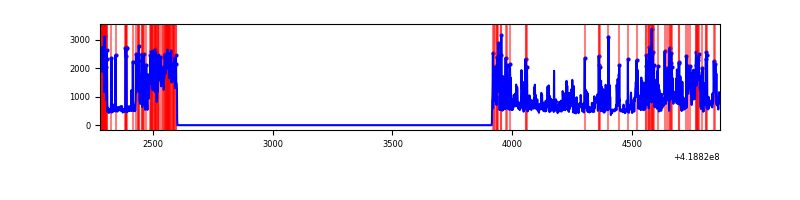 |
| D | 2586 | 1274 | 3 | 3 | 0.12% | 0.24% | 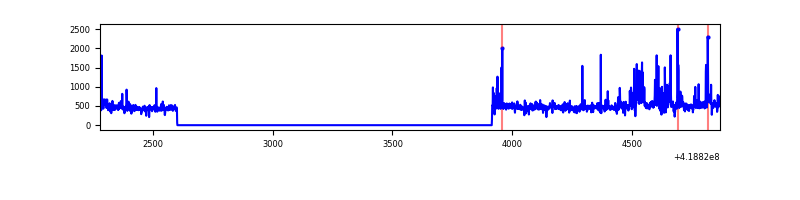 |
Top three noisy pixels from each quadrant. If the there are fewer than three noisy pixels in the level2.evt file, extra rows are filled as -1
| Pixel properties | Quadrant properties | ||||||
|---|---|---|---|---|---|---|---|
| Quadrant | DetID | PixID | Counts | Sigma | Mean | Median | Sigma |
| A | 10 | 83 | 166330 | 5417.41 | 141 | 138 | 30.7 |
| A | 12 | 189 | 3903 | 122.73 | 141 | 138 | 30.7 |
| A | 13 | 254 | 1849 | 55.77 | 141 | 138 | 30.7 |
| B | 0 | 229 | 79446 | 2756.65 | 138 | 135 | 28.8 |
| B | 0 | 190 | 15825 | 545.34 | 138 | 135 | 28.8 |
| B | 5 | 255 | 15164 | 522.37 | 138 | 135 | 28.8 |
| C | 9 | 187 | 793153 | 23987.69 | 133 | 134 | 33.1 |
| C | 15 | 214 | 57137 | 1724.26 | 133 | 134 | 33.1 |
| C | 14 | 254 | 9204 | 274.35 | 133 | 134 | 33.1 |
| D | 12 | 191 | 44921 | 1318.02 | 132 | 128 | 34.0 |
| D | 2 | 250 | 39481 | 1157.95 | 132 | 128 | 34.0 |
| D | 1 | 47 | 24240 | 709.49 | 132 | 128 | 34.0 |
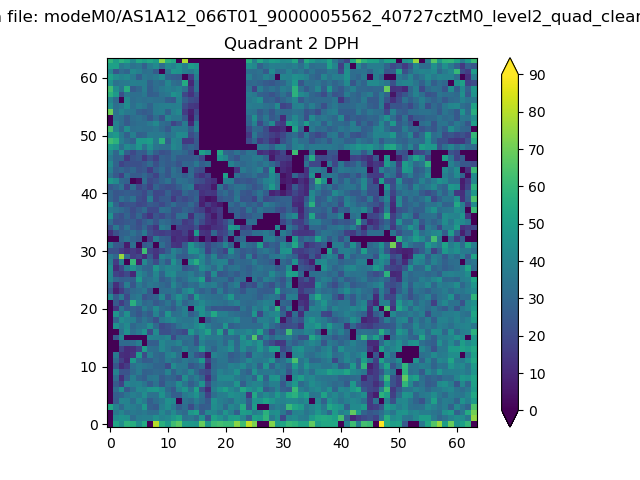
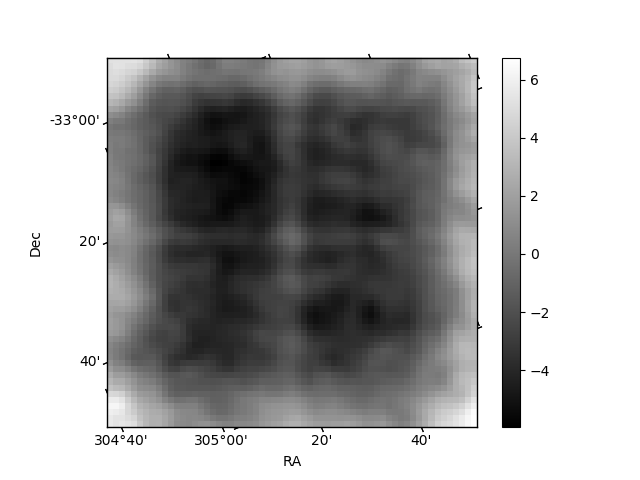
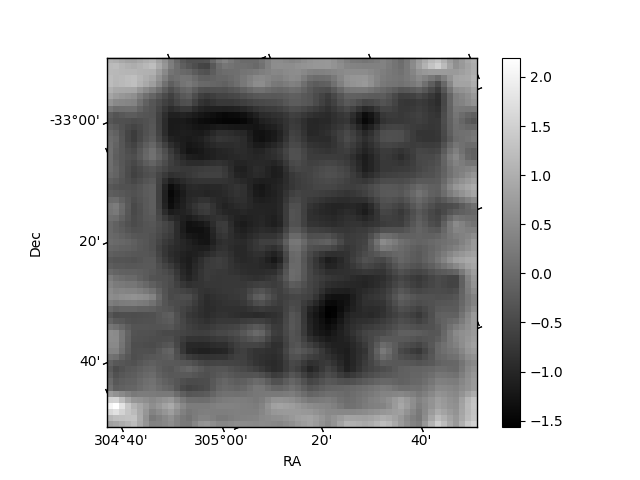
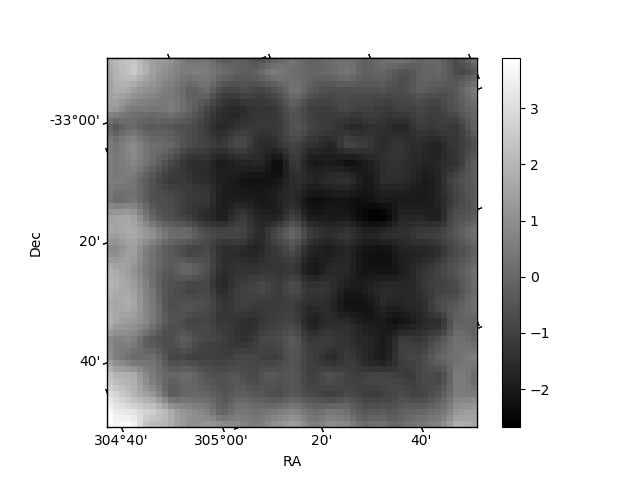
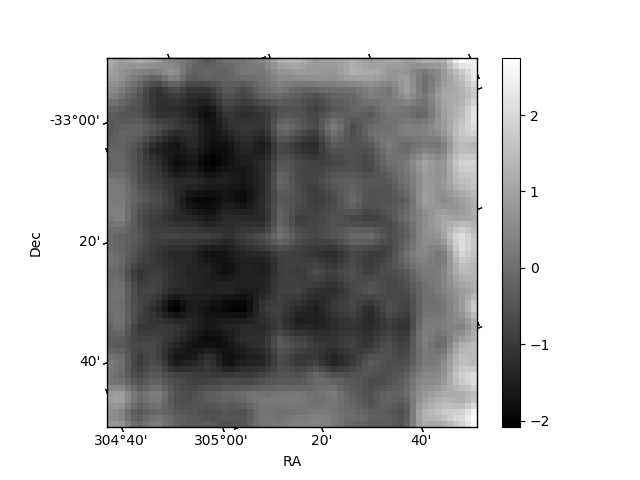
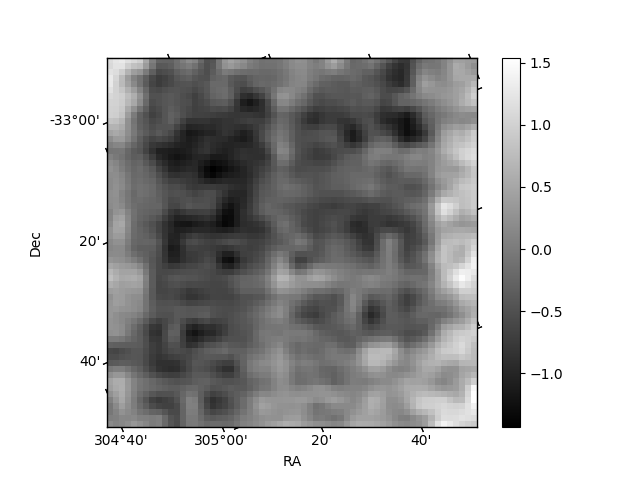
Histogram calculated using DETX and DETY for each event in the final _common_clean file
| Quadrant A | 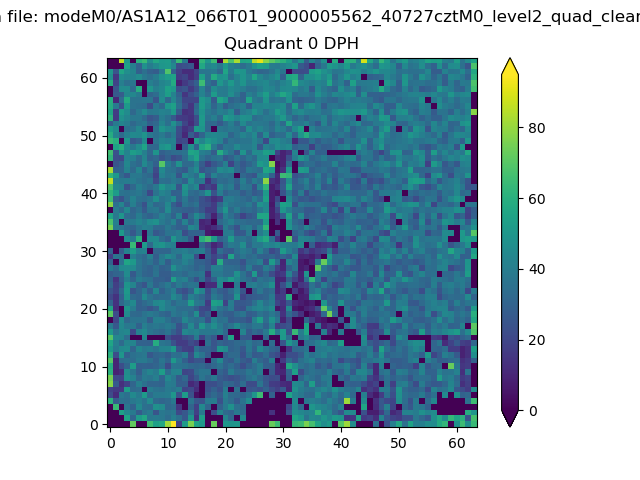 |
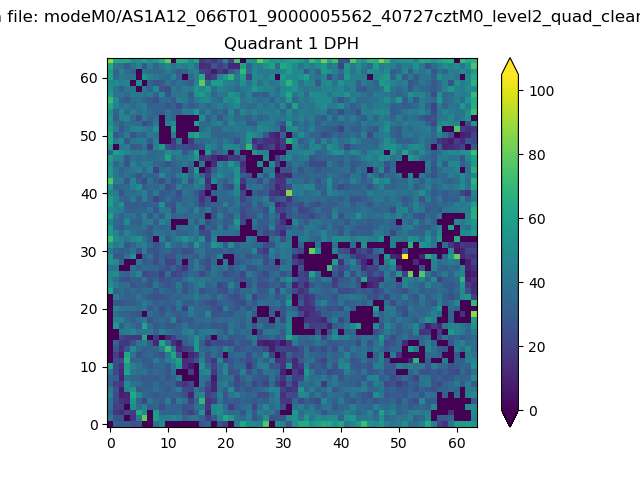 |
Quadrant B |
|---|---|---|---|
| Quadrant D | 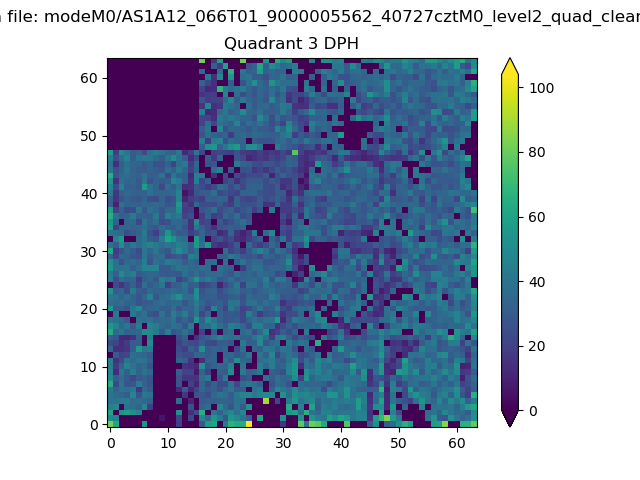 |
 |
Quadrant C |
| Plot type | Count rate plots | Images |
|---|---|---|
| Comparison with Poisson distribution Blue bars denote a histogram of data divided into 1 sec bins. Red curve is a Poisson curve with rate = median count rate of data. |
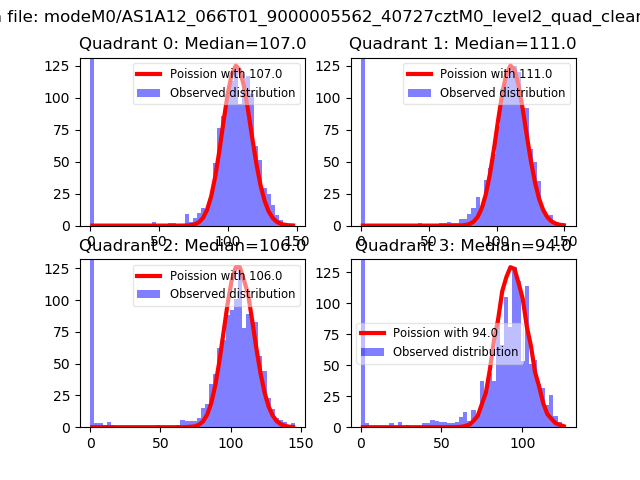 |
 |
| Quadrant-wise count rates Data is divided into 100 sec bins |
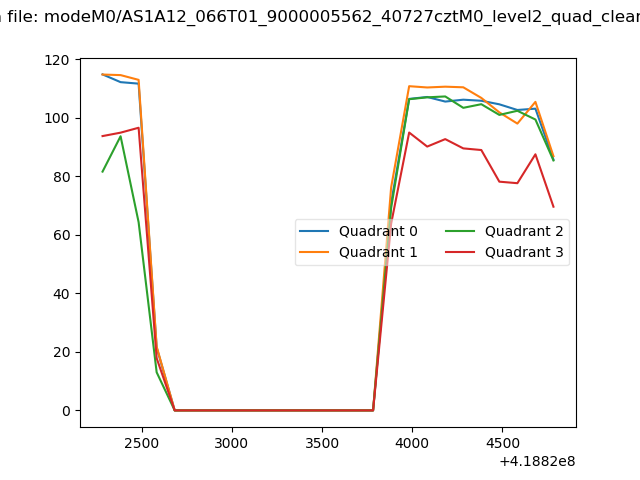 |
|
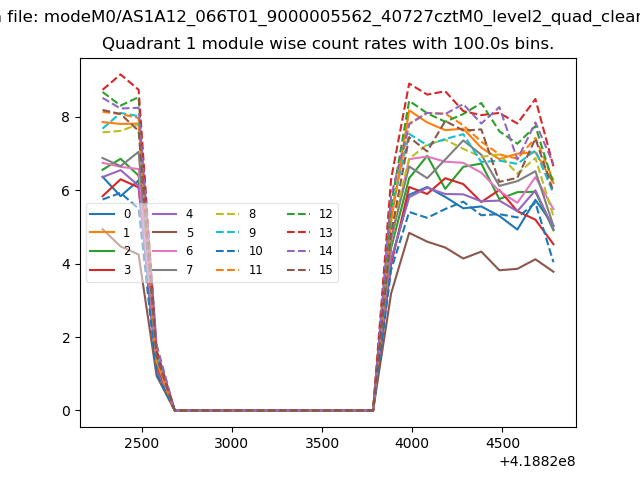
| Module-wise count rates for Quadrant A Data is divided into 100 sec bins |
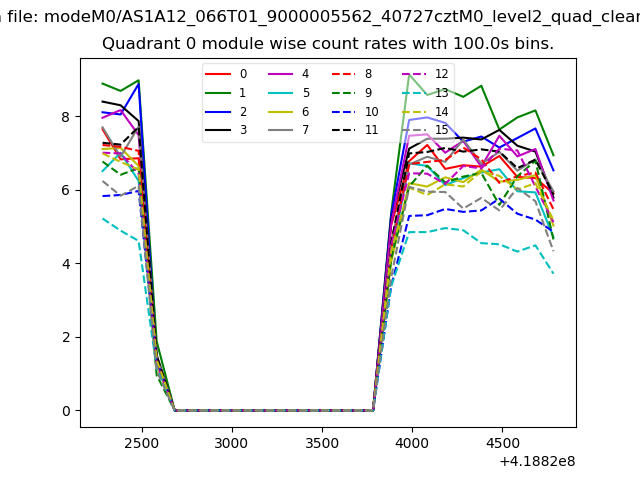 |
 |
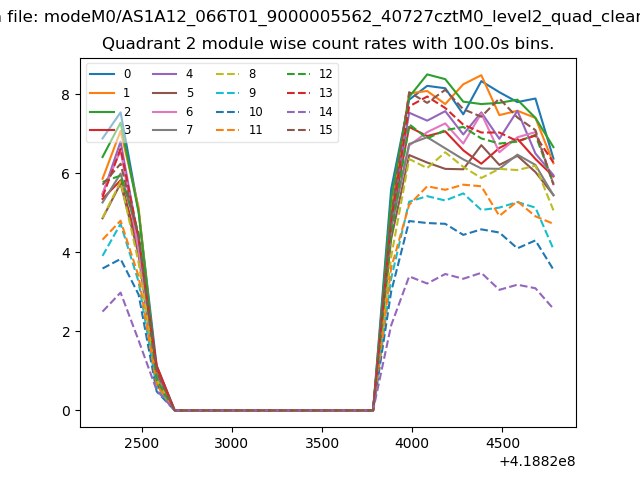
| Module-wise count rates for Quadrant B Data is divided into 100 sec bins |
 |
 |
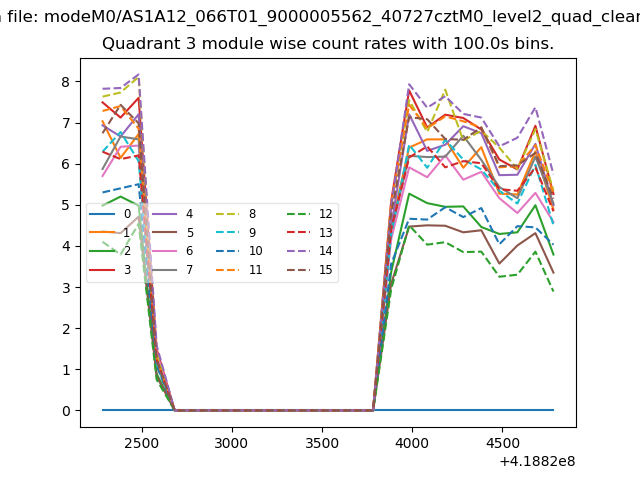
| Module-wise count rates for Quadrant C Data is divided into 100 sec bins |
 |
 |
| Module-wise count rates for Quadrant D Data is divided into 100 sec bins |
 |
 |
| Parameter | Plot |
|---|---|
| CZT HV Monitor | 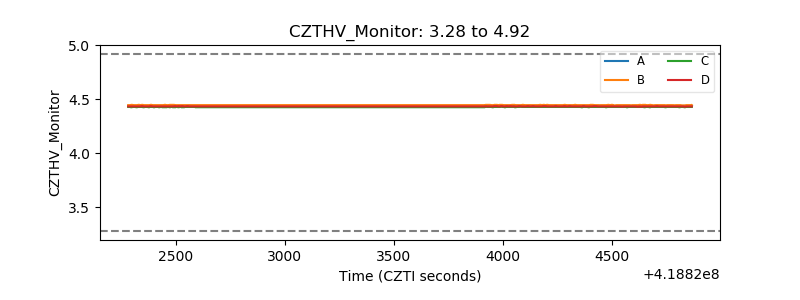 |
| D_VDD | 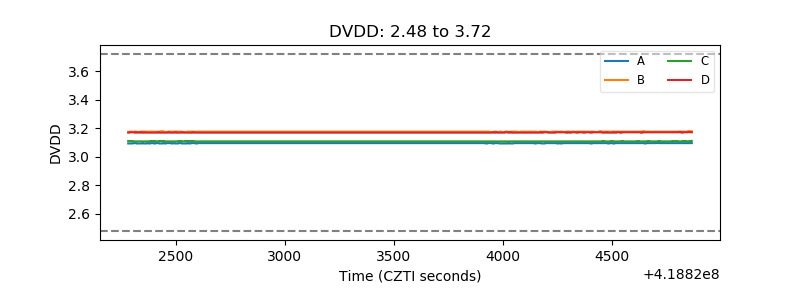 |
| Temperature 1 | 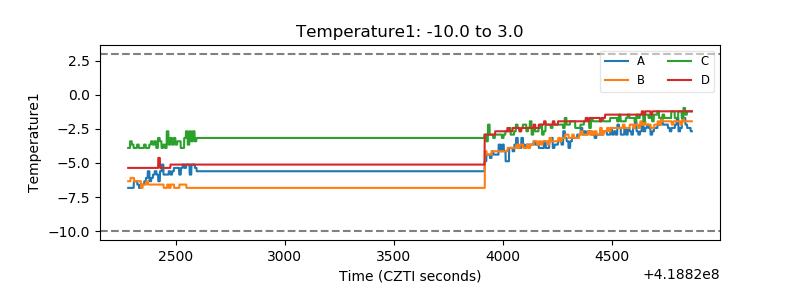 |
| Veto HV Monitor | 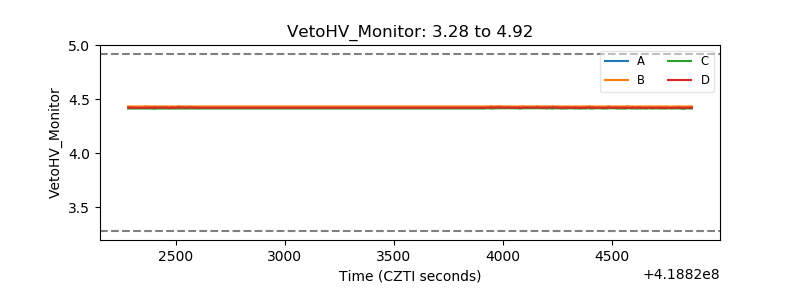 |
| Veto LLD | 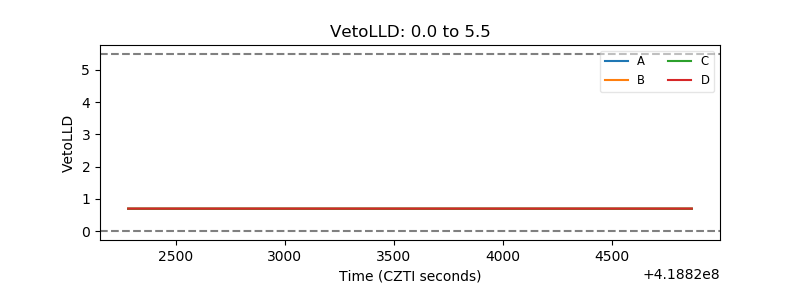 |
| Alpha Counter | 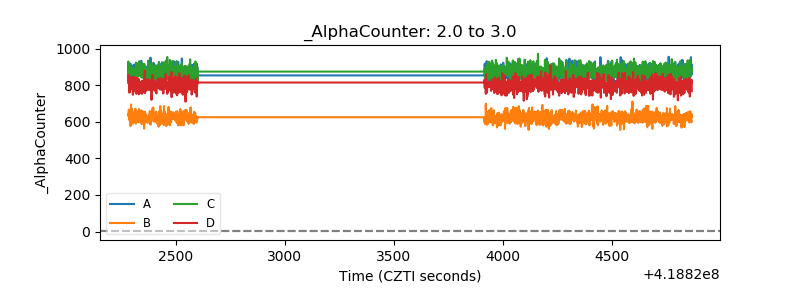 |
| _CPM_Rate | 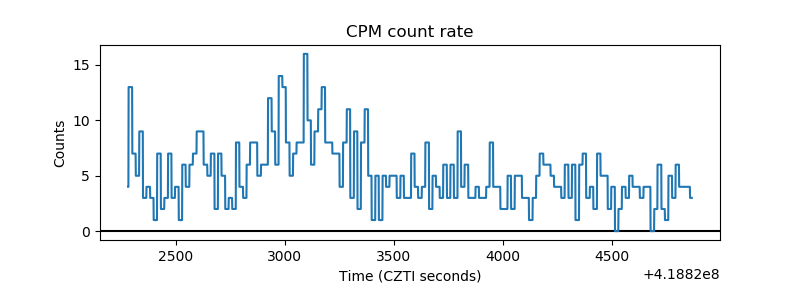 |
| CZT Counter | 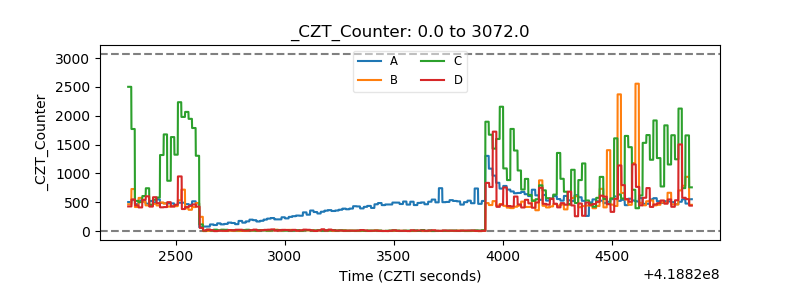 |
| +2.5 Volts monitor | 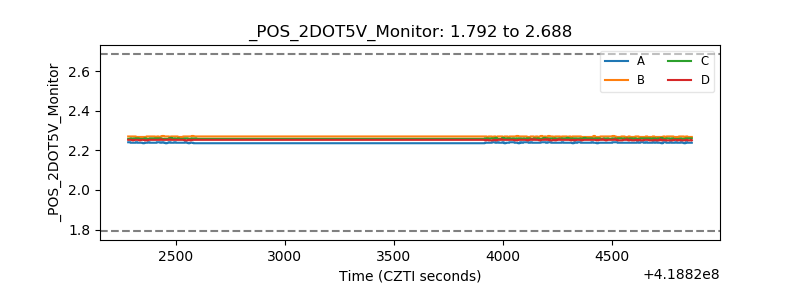 |
| +5 Volts monitor |  |
| _ROLL_ROT | 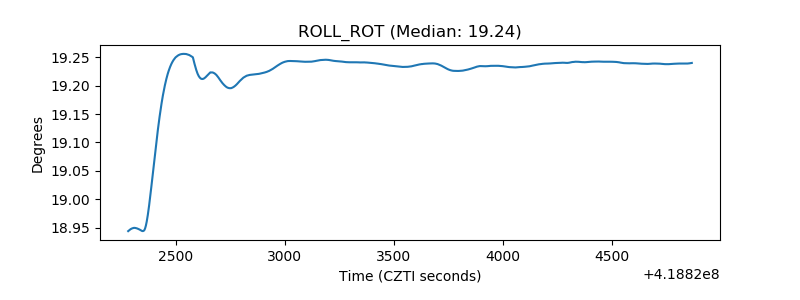 |
| _Roll_DEC | 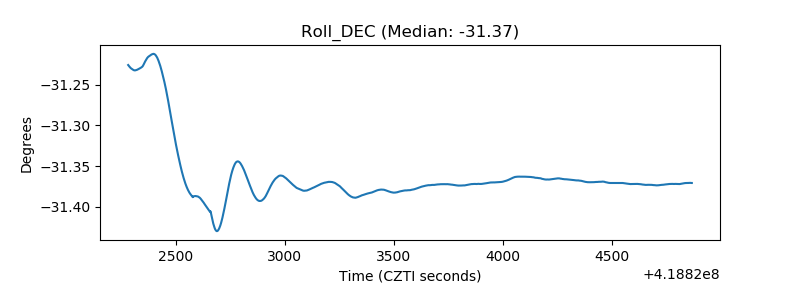 |
| _Roll_RA | 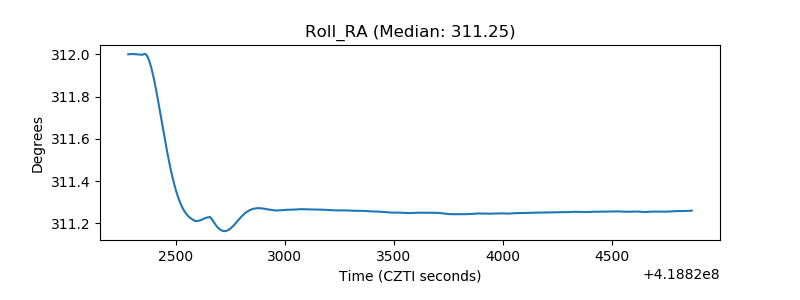 |
| Veto Counter | 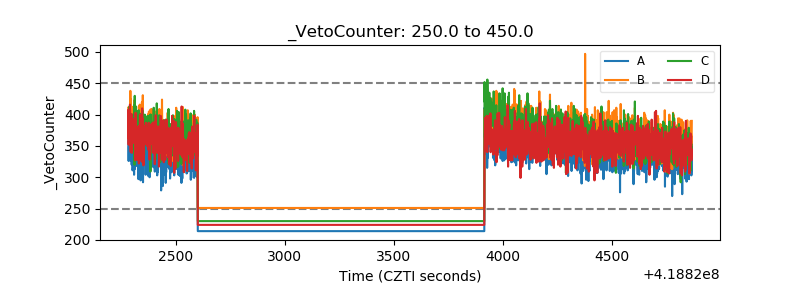 |