| Param | Original file | Final file |
|---|---|---|
| Filename | modeM0/AS1A12_066T01_9000005562_40729cztM0_level2.fits | modeM0/AS1A12_066T01_9000005562_40729cztM0_level2_quad_clean.evt |
| Size (bytes) | 799,119,360 | 150,952,320 |
| Size | 762.1 MB | 144.0 MB |
| Events in quadrant A | 5,347,288 | 1,092,778 |
| Events in quadrant B | 6,392,365 | 1,056,279 |
| Events in quadrant C | 11,504,076 | 899,275 |
| Events in quadrant D | 5,553,031 | 822,053 |
| Mode M0 | |||
|---|---|---|---|
| Quadrant | BADHDUFLAG | Total packets | Discarded packets |
| A | 0 | 21703 | 4 |
| B | 0 | 25810 | 3 |
| C | 0 | 41003 | 3 |
| D | 0 | 23148 | 3 |
| Mode M9 | |||
|---|---|---|---|
| Quadrant | BADHDUFLAG | Total packets | Discarded packets |
| A | 0 | 31 | 0 |
| B | 0 | 31 | 0 |
| C | 0 | 31 | 0 |
| D | 0 | 32 | 0 |
| Mode SS | |||
|---|---|---|---|
| Quadrant | BADHDUFLAG | Total packets | Discarded packets |
| A | 0 | 204 | 0 |
| B | 0 | 204 | 0 |
| C | 0 | 204 | 0 |
| D | 0 | 204 | 0 |
| Quadrant | Total seconds | Saturated seconds | Saturation percentage |
|---|---|---|---|
| A | 10098 | 18 | 0.178253% |
| B | 10098 | 537 | 5.317885% |
| C | 10098 | 1906 | 18.875025% |
| D | 10098 | 1811 | 17.934244% |
Noise dominated data is calculated using 1-second bins in cleaned event files. If a bin has >2000 counts, and if more than 50% of those come from <1% of pixels, then it is considered to be noise-dominated and hence unusable.
| Quadrant | # 1 sec bins | Bins with >0 counts | Bins with >2000 counts | High rate bins dominated by noise | Noise dominated (total time) | Noise dominated (detector-on time) | Marked lightcurve |
|---|---|---|---|---|---|---|---|
| A | 12845 | 10100 | 6 | 6 | 0.05% | 0.06% | 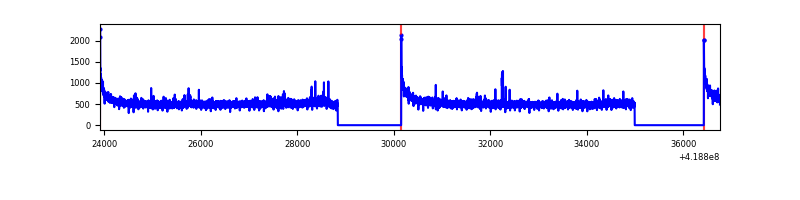 |
| B | 12845 | 10100 | 455 | 455 | 3.54% | 4.50% | 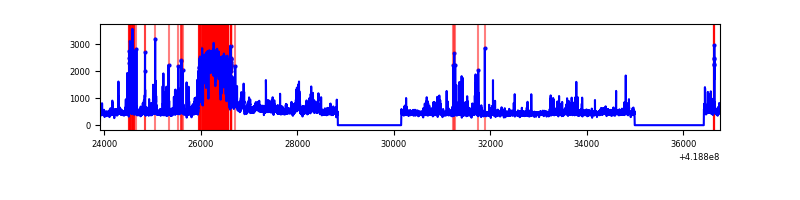 |
| C | 12845 | 10099 | 1826 | 1826 | 14.22% | 18.08% | 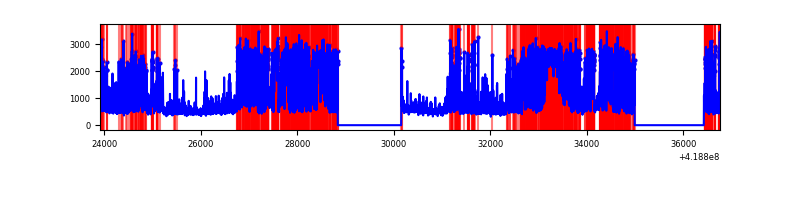 |
| D | 12845 | 10098 | 99 | 99 | 0.77% | 0.98% | 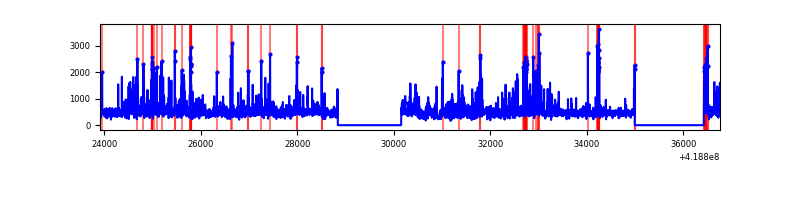 |
Top three noisy pixels from each quadrant. If the there are fewer than three noisy pixels in the level2.evt file, extra rows are filled as -1
| Pixel properties | Quadrant properties | ||||||
|---|---|---|---|---|---|---|---|
| Quadrant | DetID | PixID | Counts | Sigma | Mean | Median | Sigma |
| A | 10 | 83 | 883664 | 3828.92 | 1124 | 1100 | 230.5 |
| A | 12 | 189 | 71714 | 306.35 | 1124 | 1100 | 230.5 |
| A | 10 | 255 | 25997 | 108.01 | 1124 | 1100 | 230.5 |
| B | 4 | 170 | 1523755 | 7286.47 | 1092 | 1063 | 209.0 |
| B | 0 | 229 | 247677 | 1180.11 | 1092 | 1063 | 209.0 |
| B | 0 | 190 | 209587 | 997.84 | 1092 | 1063 | 209.0 |
| C | 9 | 187 | 6985020 | 29763.46 | 1007 | 1012 | 234.7 |
| C | 15 | 214 | 401490 | 1706.7 | 1007 | 1012 | 234.7 |
| C | 14 | 254 | 133302 | 563.77 | 1007 | 1012 | 234.7 |
| D | 12 | 191 | 443571 | 1805.99 | 998 | 970 | 245.1 |
| D | 2 | 249 | 315154 | 1282.0 | 998 | 970 | 245.1 |
| D | 1 | 47 | 272537 | 1108.1 | 998 | 970 | 245.1 |
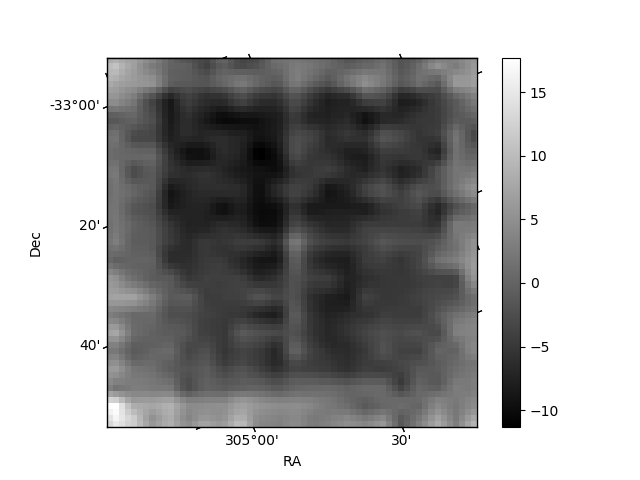
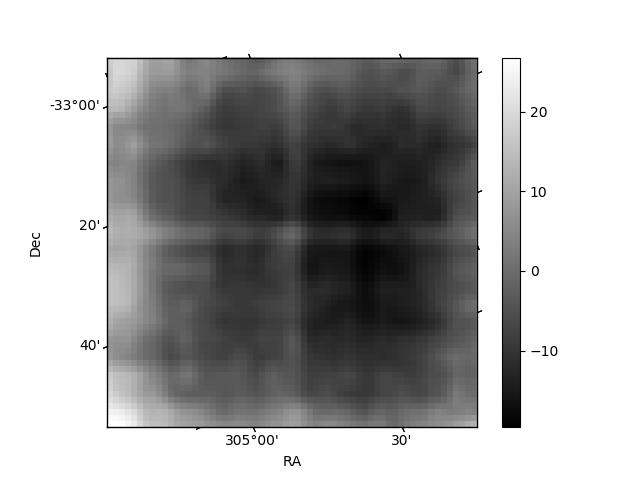
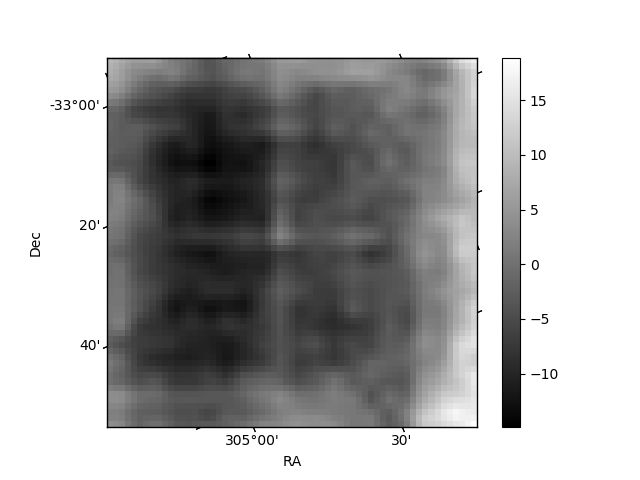
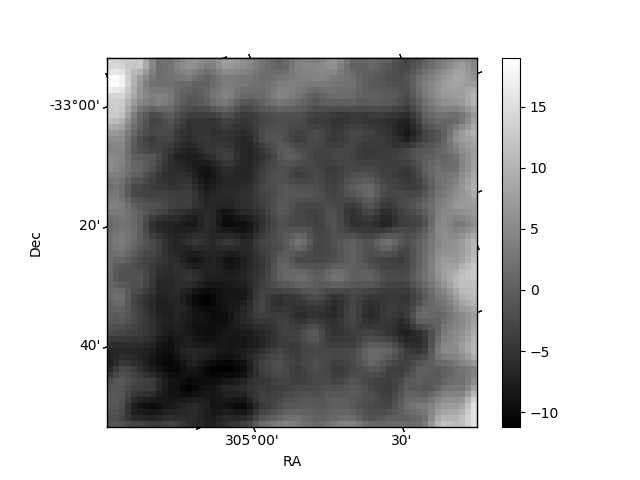
Histogram calculated using DETX and DETY for each event in the final _common_clean file
| Quadrant A | 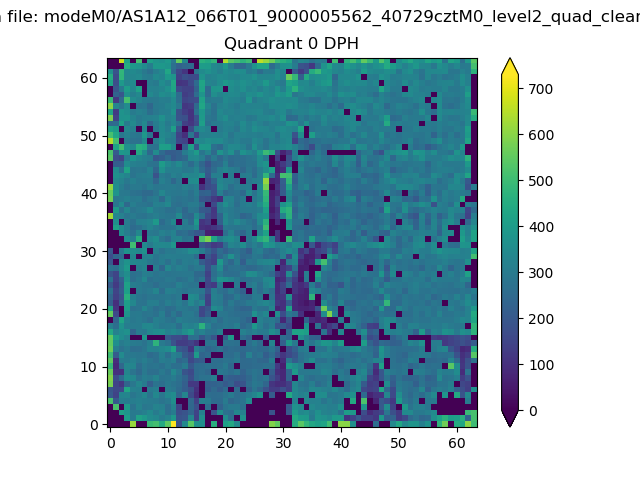 |
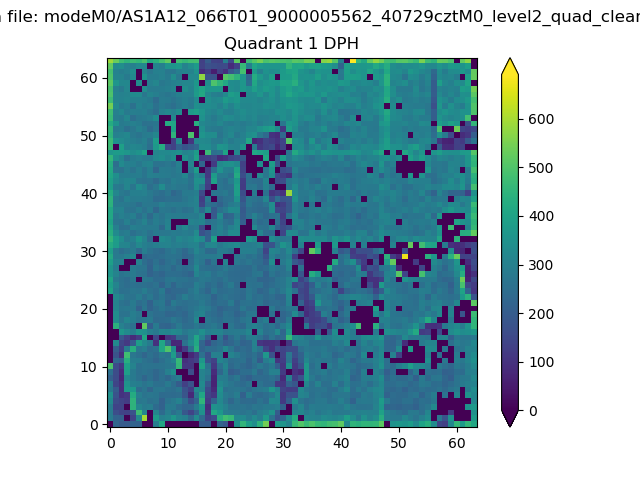 |
Quadrant B |
|---|---|---|---|
| Quadrant D | 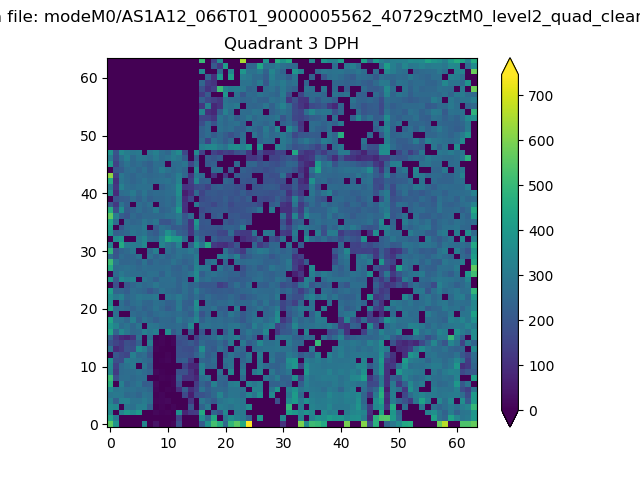 |
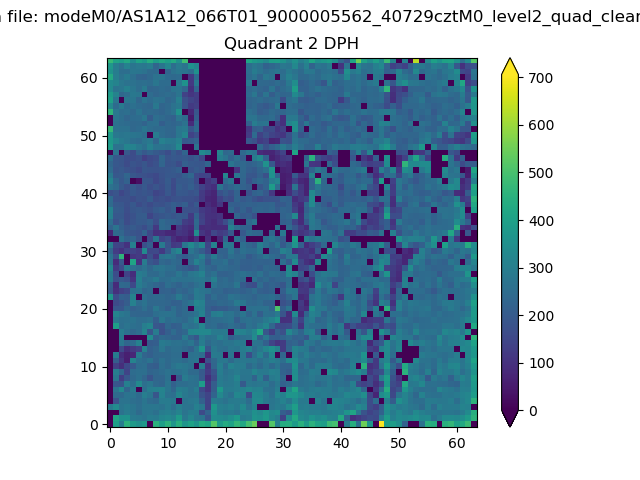 |
Quadrant C |
| Plot type | Count rate plots | Images |
|---|---|---|
| Comparison with Poisson distribution Blue bars denote a histogram of data divided into 1 sec bins. Red curve is a Poisson curve with rate = median count rate of data. |
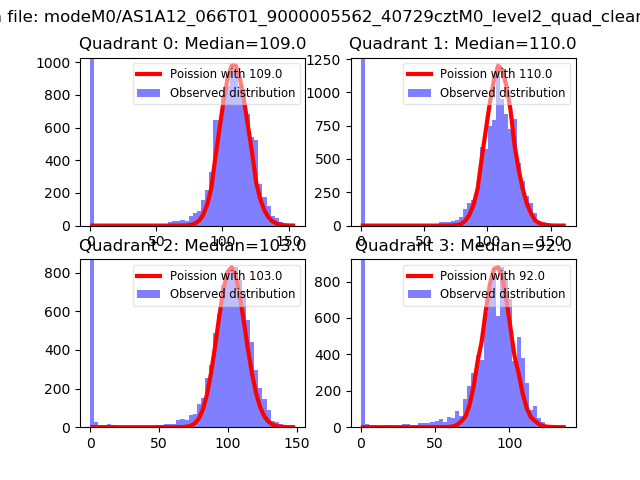 |
 |
| Quadrant-wise count rates Data is divided into 100 sec bins |
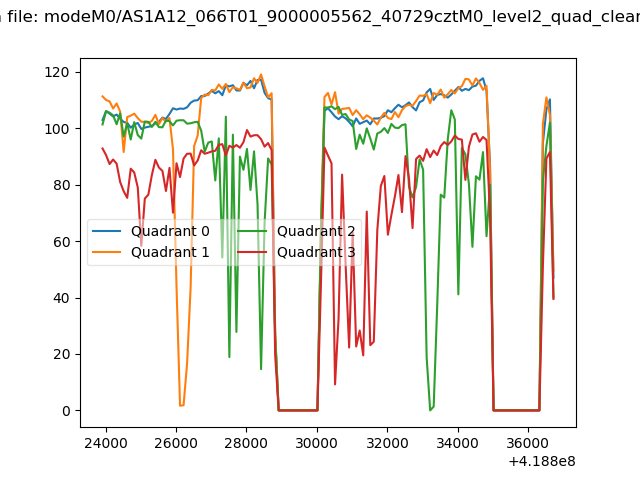 |
|
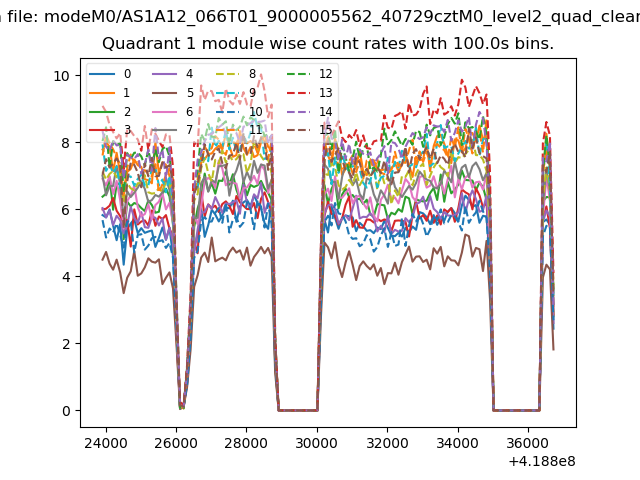
| Module-wise count rates for Quadrant A Data is divided into 100 sec bins |
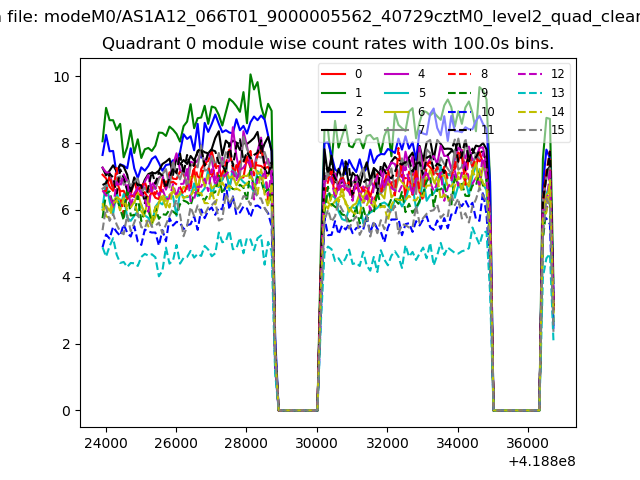 |
 |
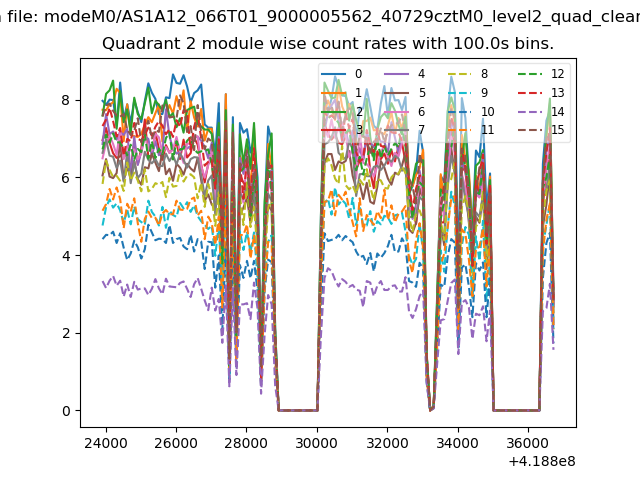
| Module-wise count rates for Quadrant B Data is divided into 100 sec bins |
 |
 |
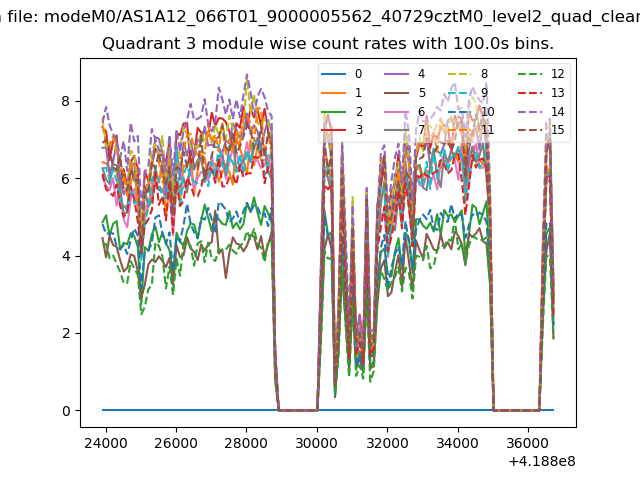
| Module-wise count rates for Quadrant C Data is divided into 100 sec bins |
 |
 |
| Module-wise count rates for Quadrant D Data is divided into 100 sec bins |
 |
 |
| Parameter | Plot |
|---|---|
| CZT HV Monitor | 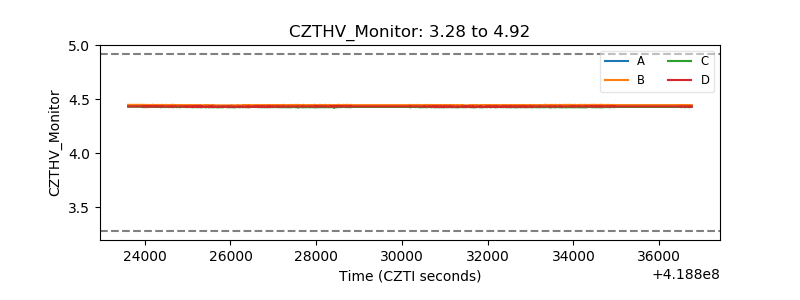 |
| D_VDD | 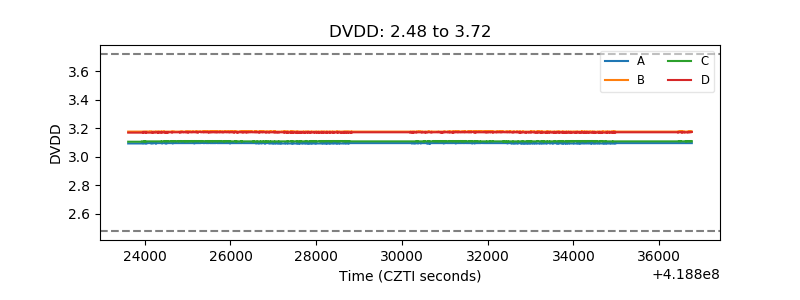 |
| Temperature 1 | 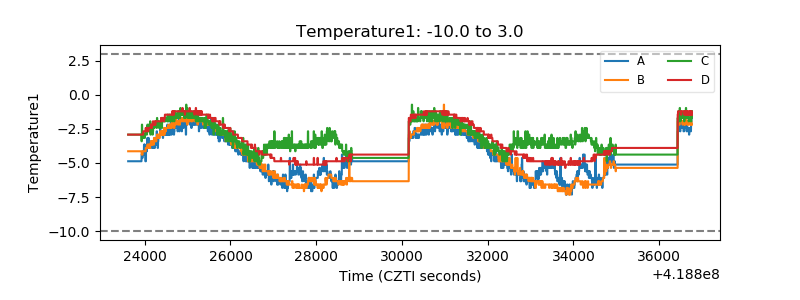 |
| Veto HV Monitor | 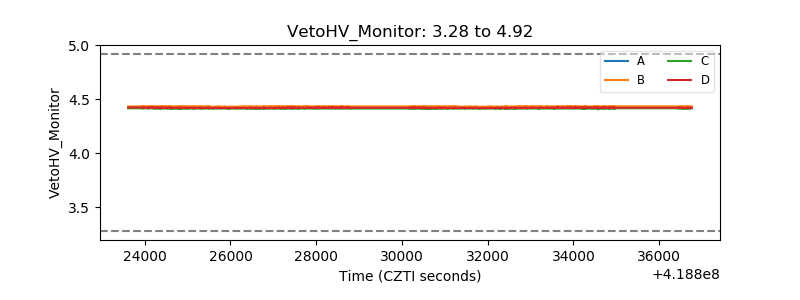 |
| Veto LLD | 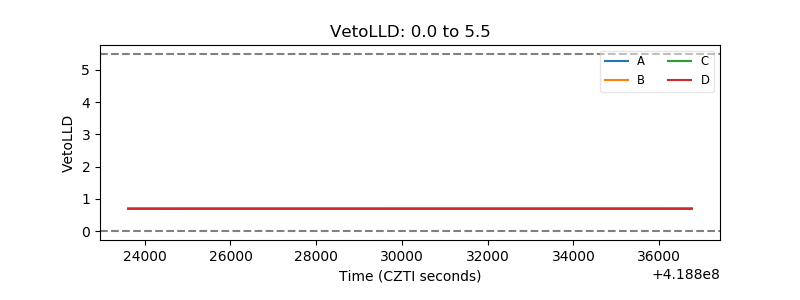 |
| Alpha Counter | 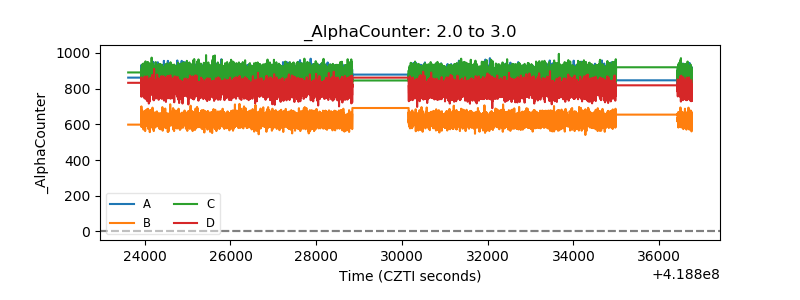 |
| _CPM_Rate | 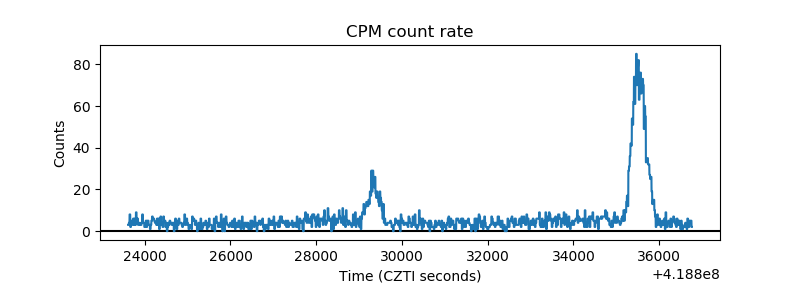 |
| CZT Counter | 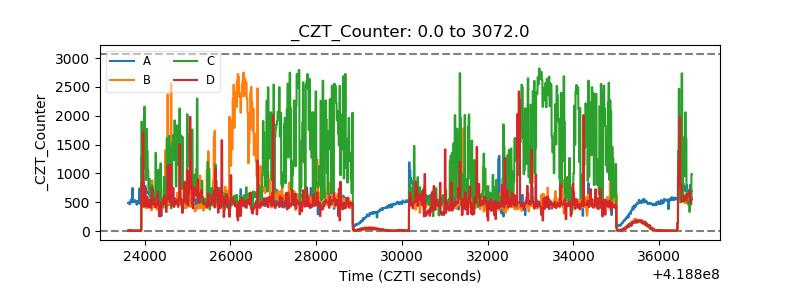 |
| +2.5 Volts monitor | 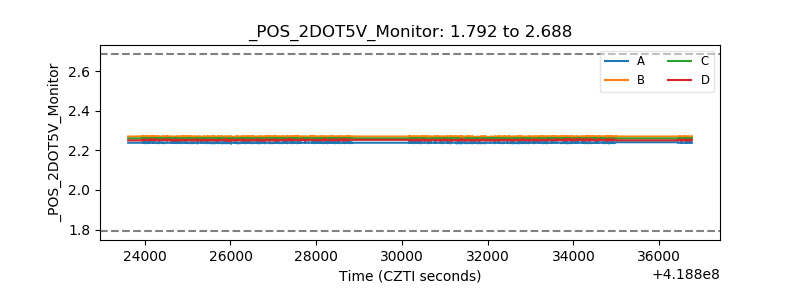 |
| +5 Volts monitor | 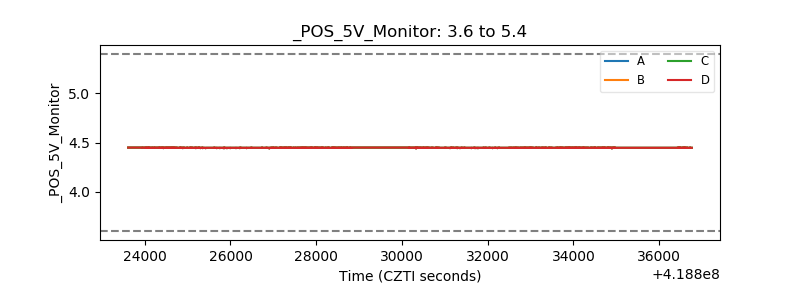 |
| _ROLL_ROT | 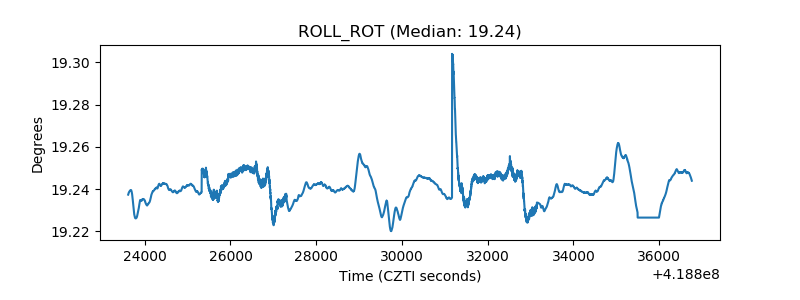 |
| _Roll_DEC | 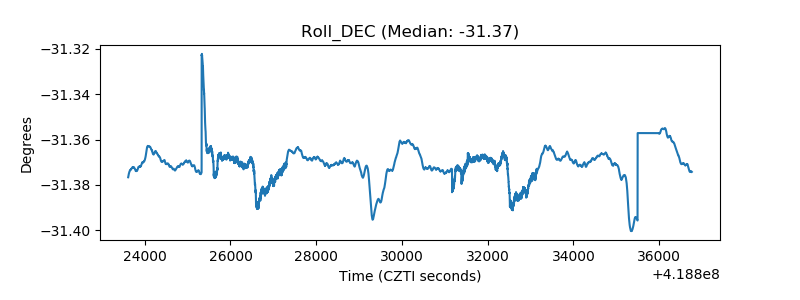 |
| _Roll_RA | 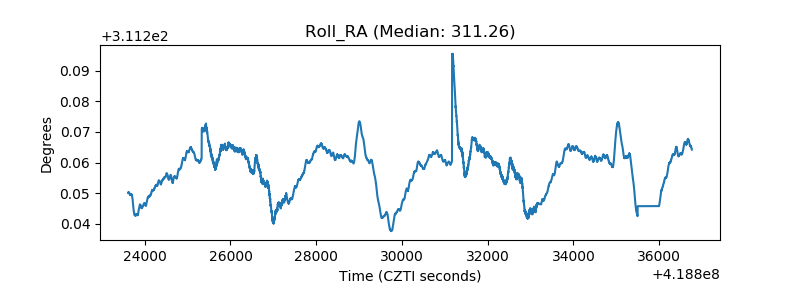 |
| Veto Counter | 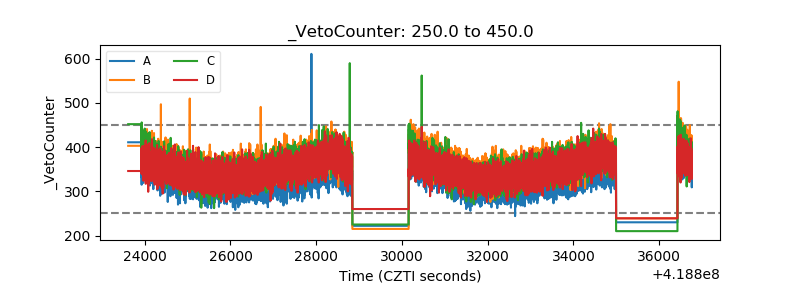 |