| Param | Original file | Final file |
|---|---|---|
| Filename | modeM0/AS1A12_066T01_9000005562_40730cztM0_level2.fits | modeM0/AS1A12_066T01_9000005562_40730cztM0_level2_quad_clean.evt |
| Size (bytes) | 502,954,560 | 85,625,280 |
| Size | 479.7 MB | 81.7 MB |
| Events in quadrant A | 3,406,214 | 627,117 |
| Events in quadrant B | 2,804,781 | 633,302 |
| Events in quadrant C | 8,279,671 | 425,406 |
| Events in quadrant D | 3,683,298 | 507,556 |
| Mode M0 | |||
|---|---|---|---|
| Quadrant | BADHDUFLAG | Total packets | Discarded packets |
| A | 0 | 13593 | 3 |
| B | 0 | 12195 | 2 |
| C | 0 | 28459 | 2 |
| D | 0 | 14659 | 2 |
| Mode M9 | |||
|---|---|---|---|
| Quadrant | BADHDUFLAG | Total packets | Discarded packets |
| A | 0 | 19 | 0 |
| B | 0 | 19 | 0 |
| C | 0 | 19 | 0 |
| D | 0 | 20 | 0 |
| Mode SS | |||
|---|---|---|---|
| Quadrant | BADHDUFLAG | Total packets | Discarded packets |
| A | 0 | 116 | 0 |
| B | 0 | 116 | 0 |
| C | 0 | 116 | 0 |
| D | 0 | 116 | 0 |
| Quadrant | Total seconds | Saturated seconds | Saturation percentage |
|---|---|---|---|
| A | 5703 | 100 | 1.753463% |
| B | 5703 | 52 | 0.911801% |
| C | 5703 | 2014 | 35.314747% |
| D | 5703 | 789 | 13.834824% |
Noise dominated data is calculated using 1-second bins in cleaned event files. If a bin has >2000 counts, and if more than 50% of those come from <1% of pixels, then it is considered to be noise-dominated and hence unusable.
| Quadrant | # 1 sec bins | Bins with >0 counts | Bins with >2000 counts | High rate bins dominated by noise | Noise dominated (total time) | Noise dominated (detector-on time) | Marked lightcurve |
|---|---|---|---|---|---|---|---|
| A | 7256 | 5704 | 68 | 68 | 0.94% | 1.19% | 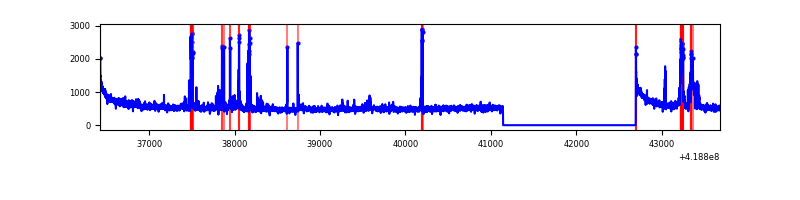 |
| B | 7256 | 5704 | 31 | 31 | 0.43% | 0.54% | 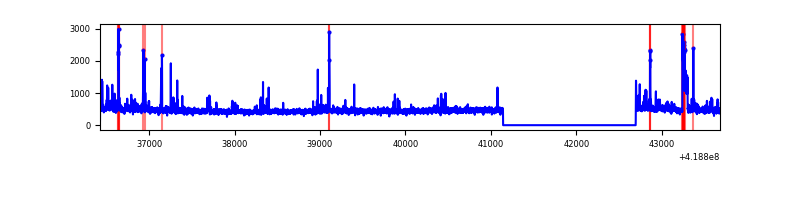 |
| C | 7255 | 5702 | 1909 | 1909 | 26.31% | 33.48% | 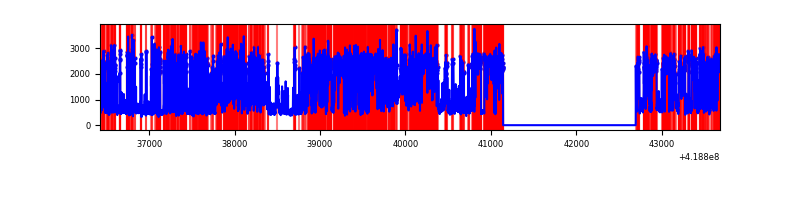 |
| D | 7256 | 5704 | 154 | 154 | 2.12% | 2.70% | 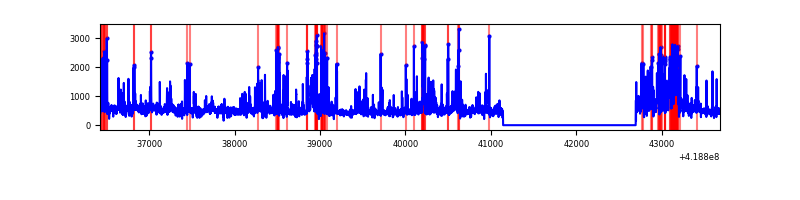 |
Top three noisy pixels from each quadrant. If the there are fewer than three noisy pixels in the level2.evt file, extra rows are filled as -1
| Pixel properties | Quadrant properties | ||||||
|---|---|---|---|---|---|---|---|
| Quadrant | DetID | PixID | Counts | Sigma | Mean | Median | Sigma |
| A | 10 | 83 | 542202 | 4123.52 | 636 | 622 | 131.3 |
| A | 12 | 189 | 245832 | 1867.0 | 636 | 622 | 131.3 |
| A | 6 | 10 | 115778 | 876.78 | 636 | 622 | 131.3 |
| B | 0 | 229 | 159282 | 1277.73 | 631 | 613 | 124.2 |
| B | 0 | 190 | 76296 | 609.46 | 631 | 613 | 124.2 |
| B | 4 | 171 | 32427 | 256.19 | 631 | 613 | 124.2 |
| C | 9 | 187 | 5979239 | 48937.65 | 521 | 524 | 122.2 |
| C | 15 | 214 | 209145 | 1707.63 | 521 | 524 | 122.2 |
| C | 14 | 254 | 29111 | 233.99 | 521 | 524 | 122.2 |
| D | 10 | 34 | 251132 | 1719.54 | 581 | 564 | 145.7 |
| D | 2 | 249 | 202085 | 1382.95 | 581 | 564 | 145.7 |
| D | 1 | 52 | 193044 | 1320.91 | 581 | 564 | 145.7 |
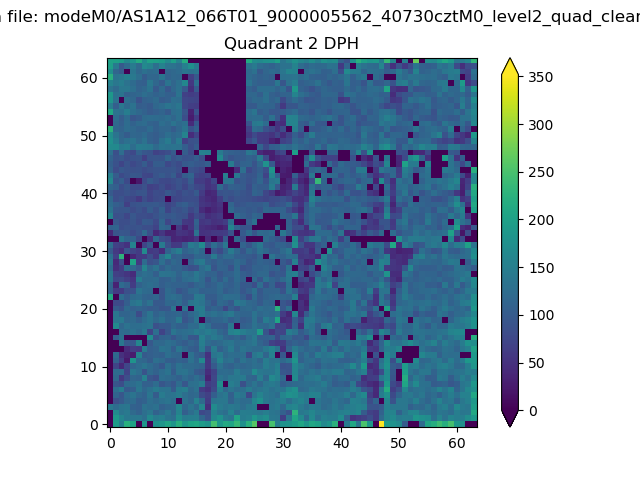
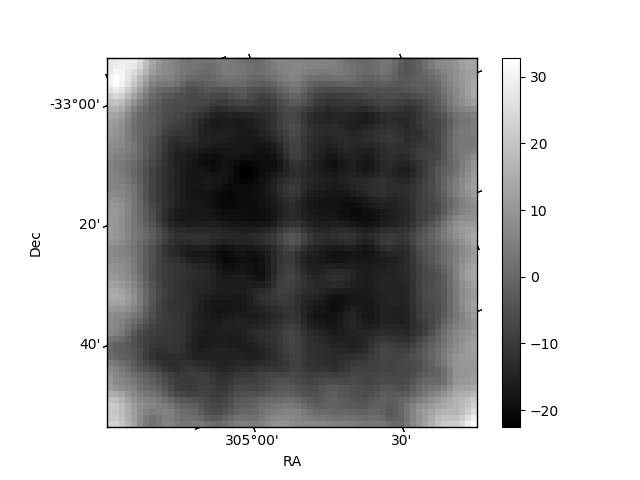
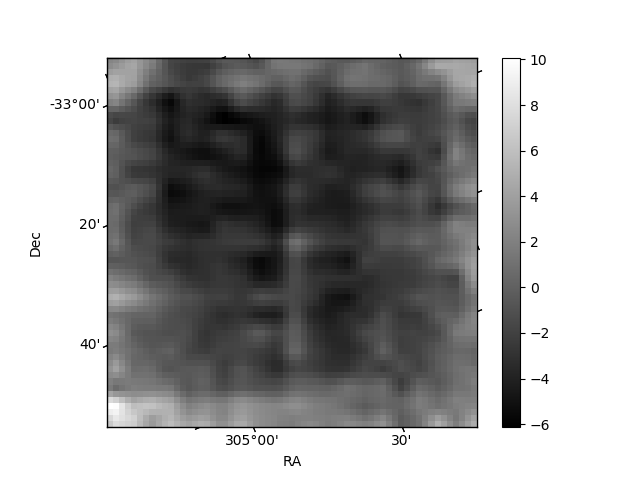
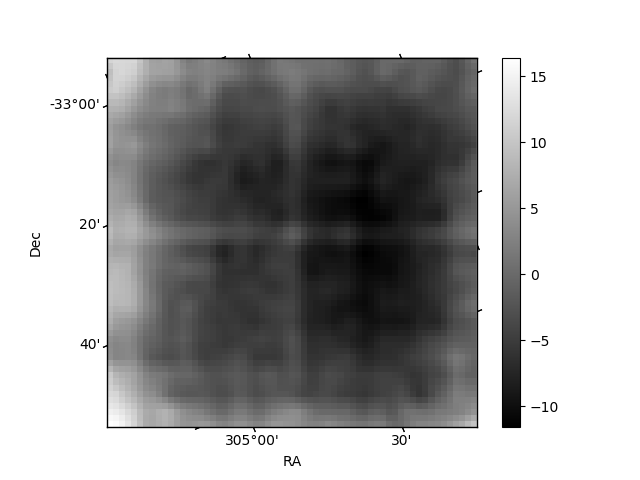
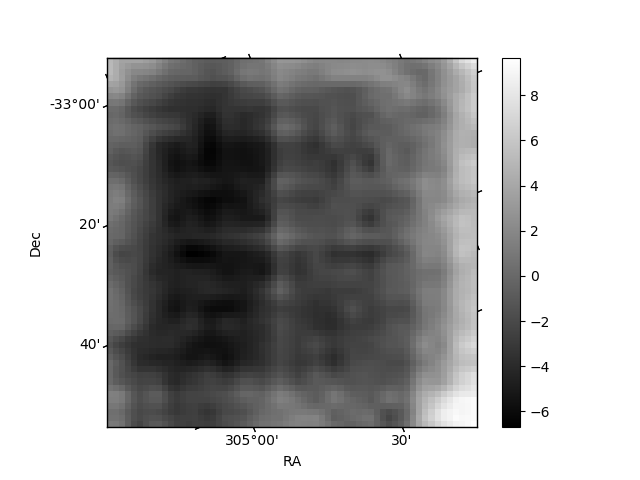
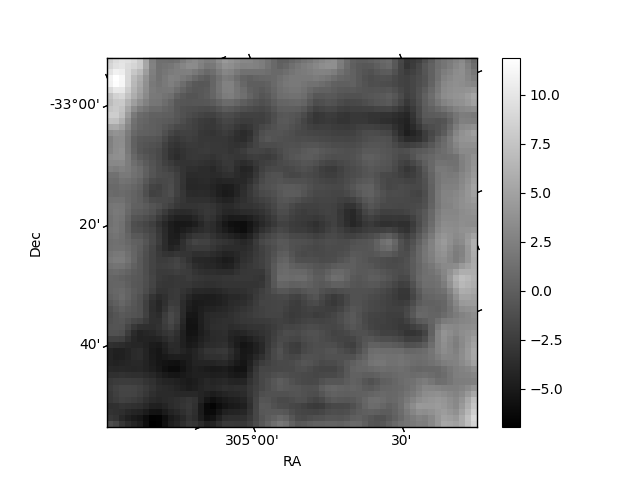
Histogram calculated using DETX and DETY for each event in the final _common_clean file
| Quadrant A | 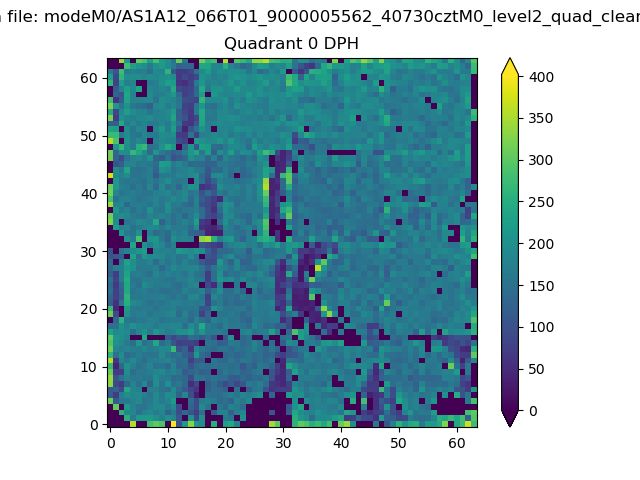 |
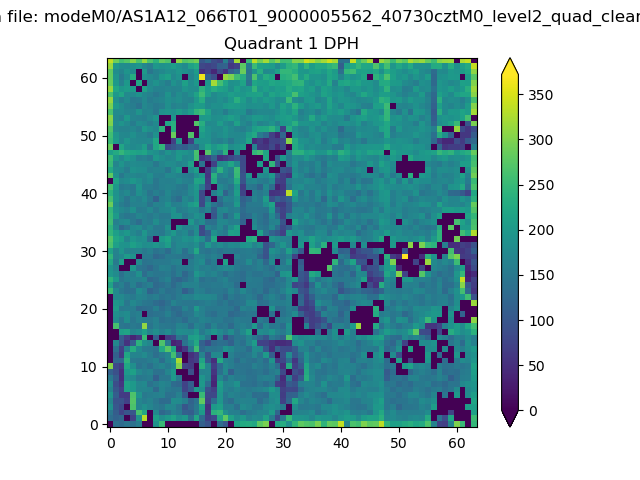 |
Quadrant B |
|---|---|---|---|
| Quadrant D | 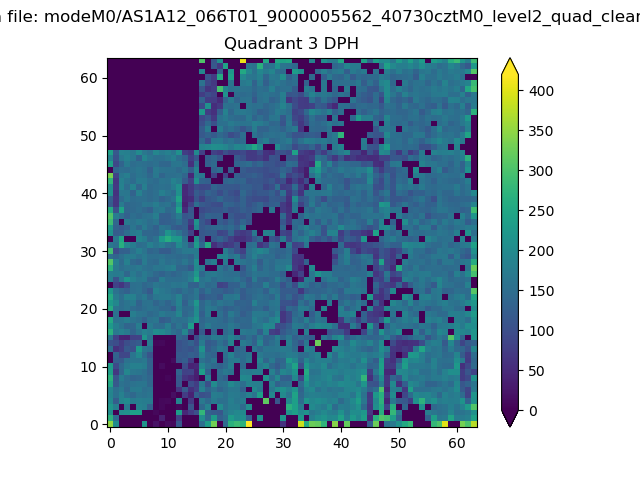 |
 |
Quadrant C |
| Plot type | Count rate plots | Images |
|---|---|---|
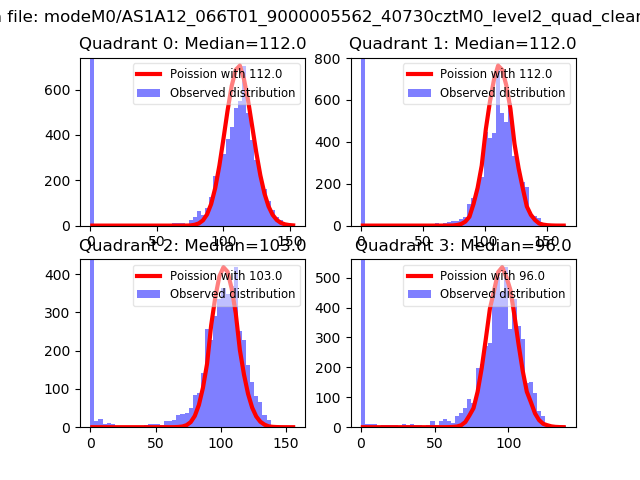
| Comparison with Poisson distribution Blue bars denote a histogram of data divided into 1 sec bins. Red curve is a Poisson curve with rate = median count rate of data. |
 |
 |
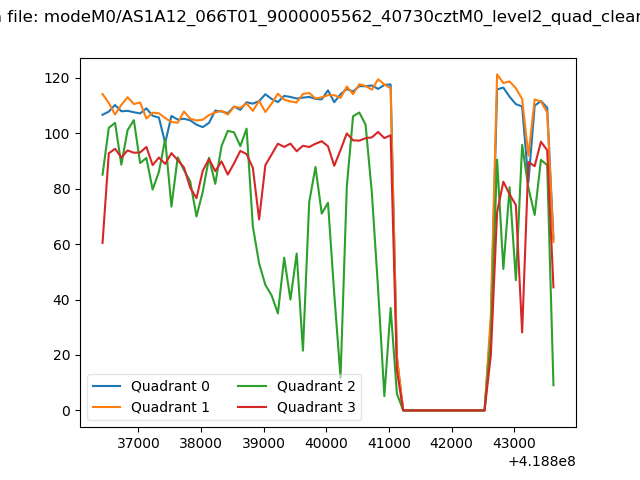
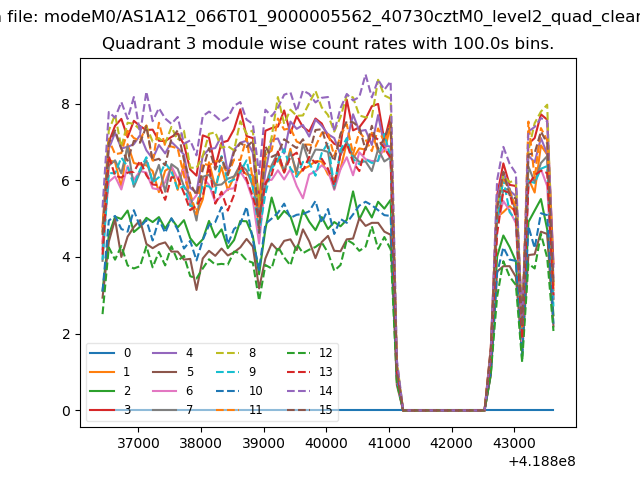
| Quadrant-wise count rates Data is divided into 100 sec bins |
 |
|
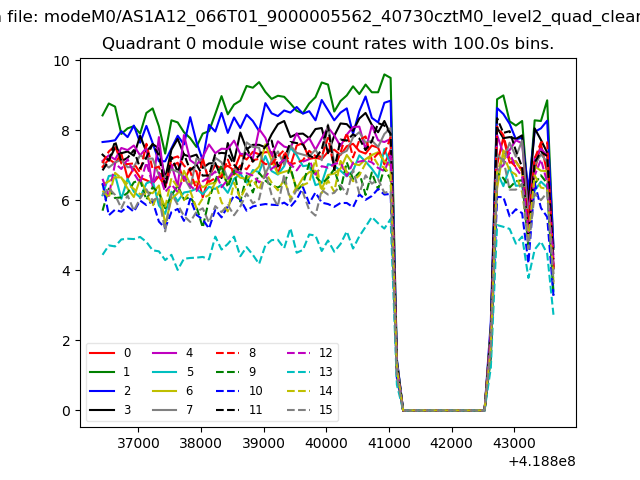
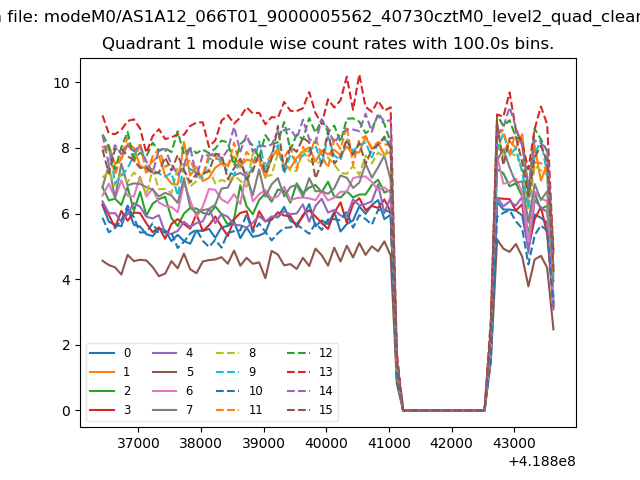
| Module-wise count rates for Quadrant A Data is divided into 100 sec bins |
 |
 |
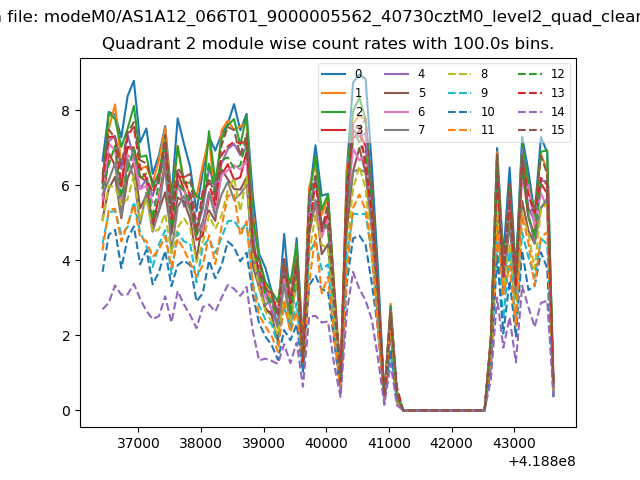
| Module-wise count rates for Quadrant B Data is divided into 100 sec bins |
 |
 |
| Module-wise count rates for Quadrant C Data is divided into 100 sec bins |
 |
 |
| Module-wise count rates for Quadrant D Data is divided into 100 sec bins |
 |
 |
| Parameter | Plot |
|---|---|
| CZT HV Monitor | 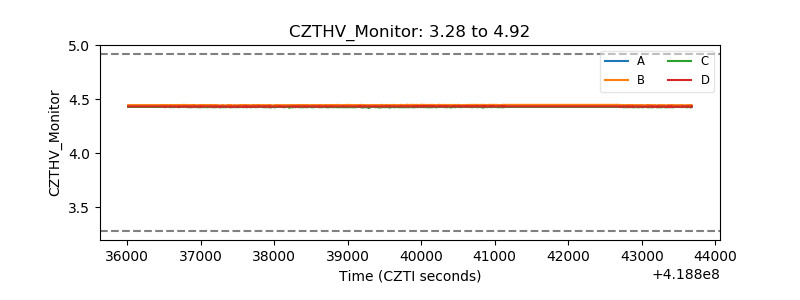 |
| D_VDD | 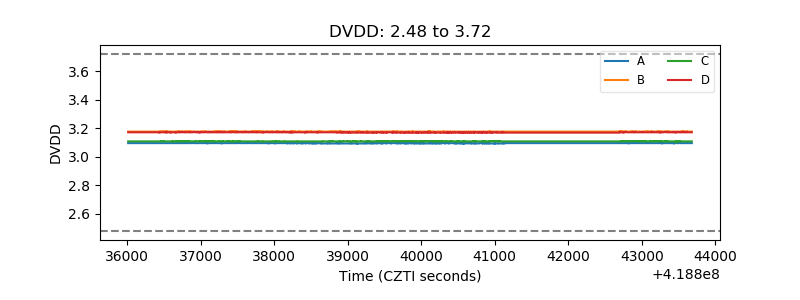 |
| Temperature 1 | 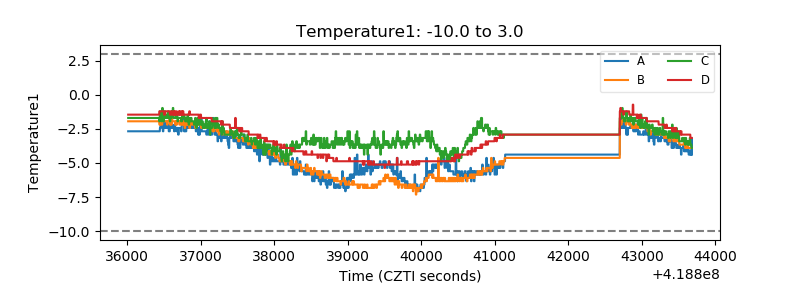 |
| Veto HV Monitor | 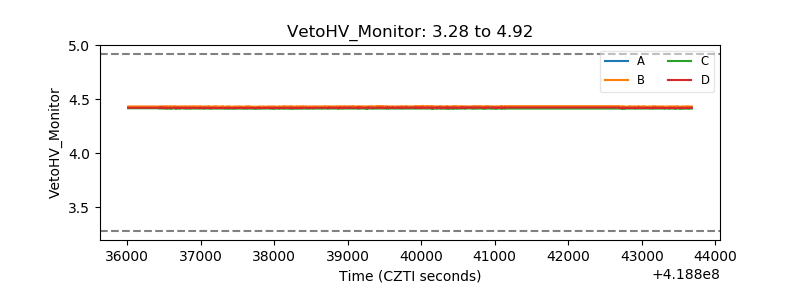 |
| Veto LLD | 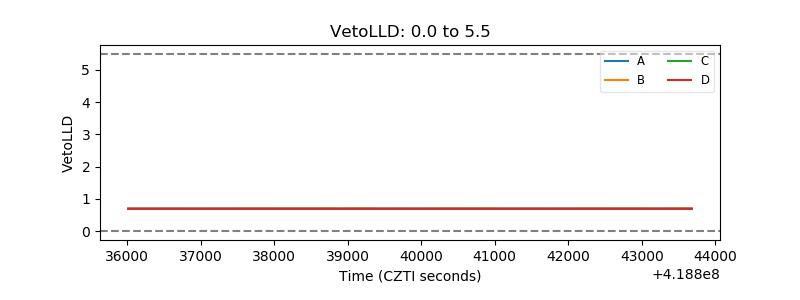 |
| Alpha Counter | 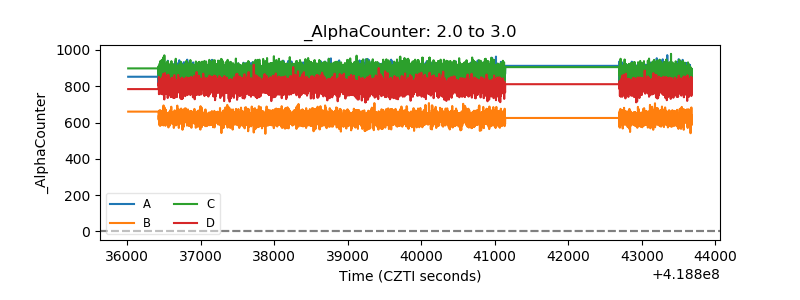 |
| _CPM_Rate | 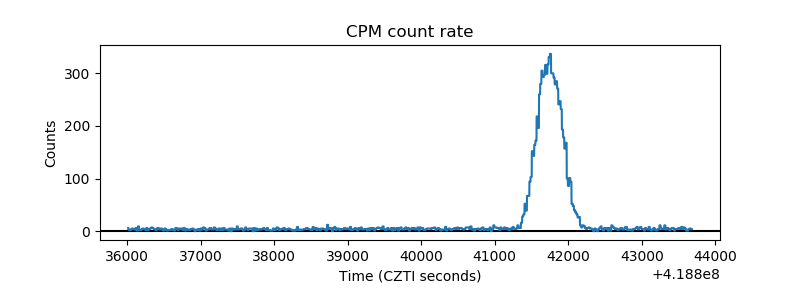 |
| CZT Counter | 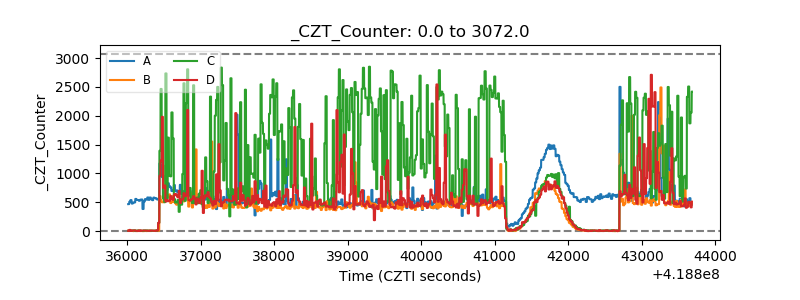 |
| +2.5 Volts monitor | 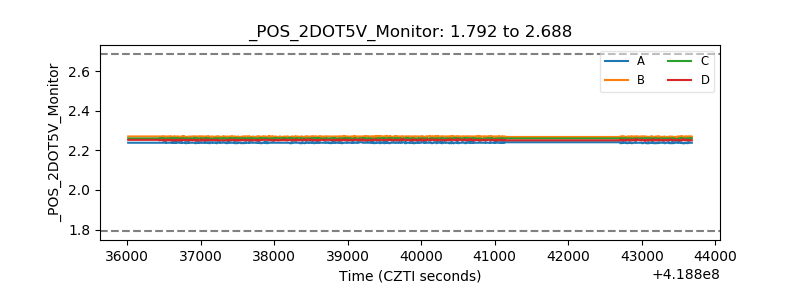 |
| +5 Volts monitor | 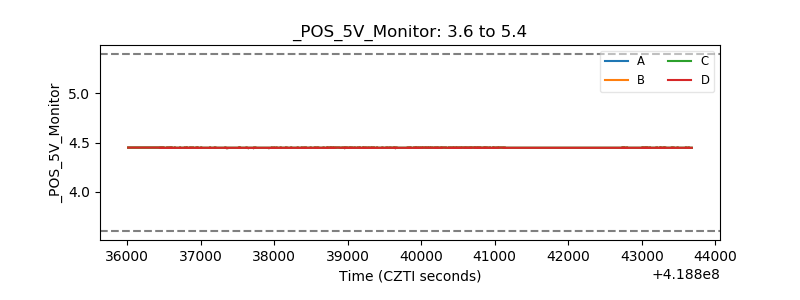 |
| _ROLL_ROT | 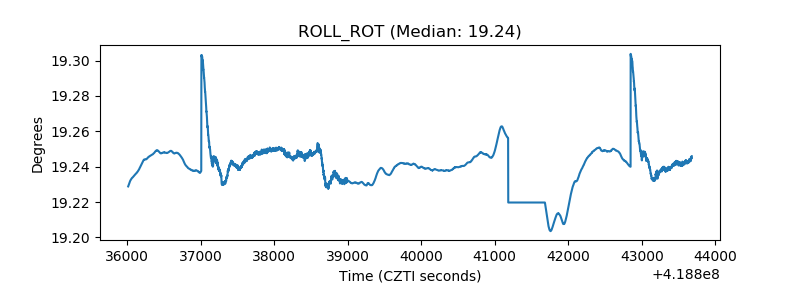 |
| _Roll_DEC | 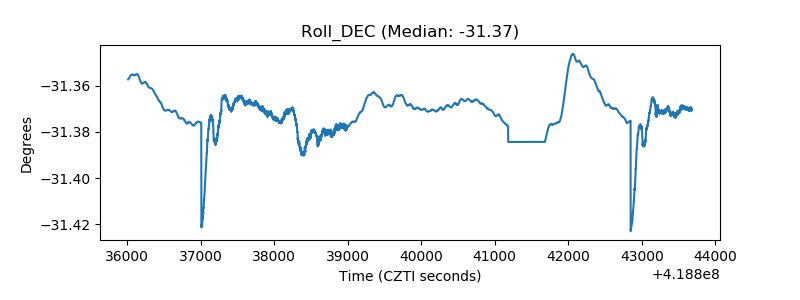 |
| _Roll_RA | 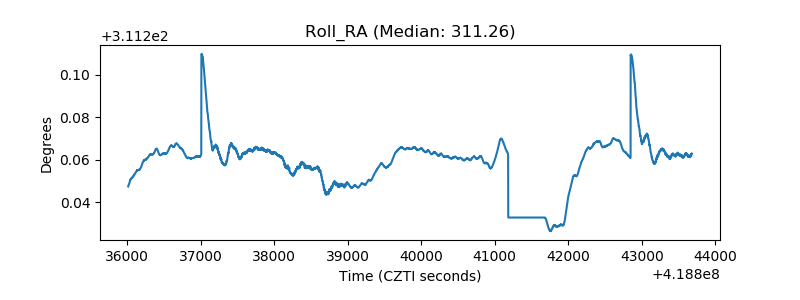 |
| Veto Counter | 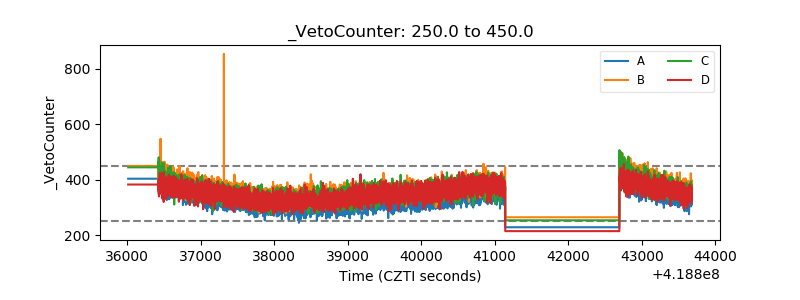 |