| Param | Original file | Final file |
|---|---|---|
| Filename | modeM0/AS1A12_066T01_9000005562_40731cztM0_level2.fits | modeM0/AS1A12_066T01_9000005562_40731cztM0_level2_quad_clean.evt |
| Size (bytes) | 455,996,160 | 87,370,560 |
| Size | 434.9 MB | 83.3 MB |
| Events in quadrant A | 3,172,067 | 627,547 |
| Events in quadrant B | 2,716,785 | 633,598 |
| Events in quadrant C | 6,696,078 | 499,771 |
| Events in quadrant D | 3,862,611 | 495,650 |
| Mode M0 | |||
|---|---|---|---|
| Quadrant | BADHDUFLAG | Total packets | Discarded packets |
| A | 0 | 12790 | 3 |
| B | 0 | 11812 | 2 |
| C | 0 | 23710 | 2 |
| D | 0 | 15082 | 2 |
| Mode M9 | |||
|---|---|---|---|
| Quadrant | BADHDUFLAG | Total packets | Discarded packets |
| A | 0 | 26 | 0 |
| B | 0 | 26 | 0 |
| C | 0 | 26 | 0 |
| D | 0 | 27 | 0 |
| Mode SS | |||
|---|---|---|---|
| Quadrant | BADHDUFLAG | Total packets | Discarded packets |
| A | 0 | 114 | 0 |
| B | 0 | 114 | 0 |
| C | 0 | 114 | 0 |
| D | 0 | 114 | 0 |
| Quadrant | Total seconds | Saturated seconds | Saturation percentage |
|---|---|---|---|
| A | 5552 | 60 | 1.080692% |
| B | 5552 | 50 | 0.900576% |
| C | 5552 | 1204 | 21.685879% |
| D | 5552 | 828 | 14.913545% |
Noise dominated data is calculated using 1-second bins in cleaned event files. If a bin has >2000 counts, and if more than 50% of those come from <1% of pixels, then it is considered to be noise-dominated and hence unusable.
| Quadrant | # 1 sec bins | Bins with >0 counts | Bins with >2000 counts | High rate bins dominated by noise | Noise dominated (total time) | Noise dominated (detector-on time) | Marked lightcurve |
|---|---|---|---|---|---|---|---|
| A | 7225 | 5553 | 32 | 32 | 0.44% | 0.58% | 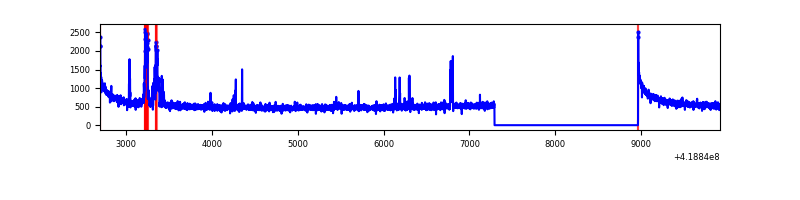 |
| B | 7225 | 5553 | 27 | 27 | 0.37% | 0.49% | 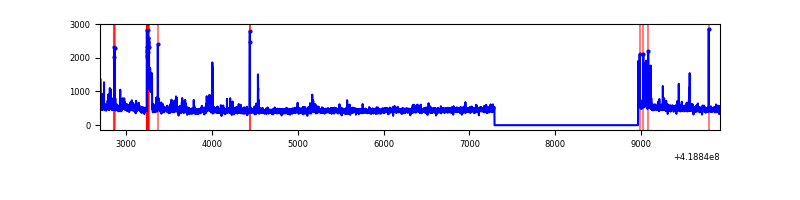 |
| C | 7225 | 5553 | 1128 | 1128 | 15.61% | 20.31% | 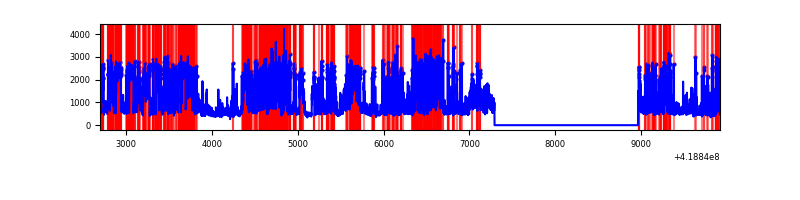 |
| D | 7225 | 5553 | 205 | 205 | 2.84% | 3.69% | 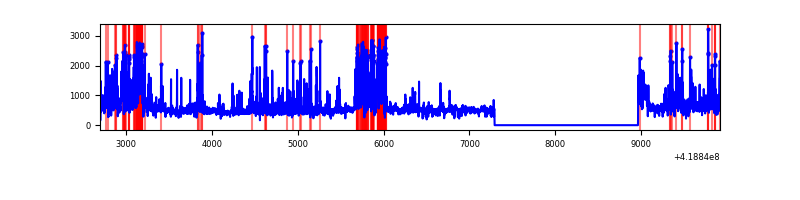 |
Top three noisy pixels from each quadrant. If the there are fewer than three noisy pixels in the level2.evt file, extra rows are filled as -1
| Pixel properties | Quadrant properties | ||||||
|---|---|---|---|---|---|---|---|
| Quadrant | DetID | PixID | Counts | Sigma | Mean | Median | Sigma |
| A | 10 | 83 | 526365 | 4067.85 | 625 | 610 | 129.2 |
| A | 12 | 189 | 175796 | 1355.44 | 625 | 610 | 129.2 |
| A | 13 | 248 | 41119 | 313.42 | 625 | 610 | 129.2 |
| B | 0 | 229 | 129173 | 1069.32 | 620 | 602 | 120.2 |
| B | 4 | 170 | 50325 | 413.54 | 620 | 602 | 120.2 |
| B | 0 | 190 | 48225 | 396.08 | 620 | 602 | 120.2 |
| C | 9 | 187 | 4216683 | 32667.21 | 558 | 562 | 129.1 |
| C | 15 | 214 | 218899 | 1691.71 | 558 | 562 | 129.1 |
| C | 14 | 254 | 31983 | 243.46 | 558 | 562 | 129.1 |
| D | 2 | 249 | 604445 | 4288.11 | 567 | 551 | 140.8 |
| D | 10 | 34 | 250590 | 1775.47 | 567 | 551 | 140.8 |
| D | 1 | 52 | 173537 | 1228.33 | 567 | 551 | 140.8 |
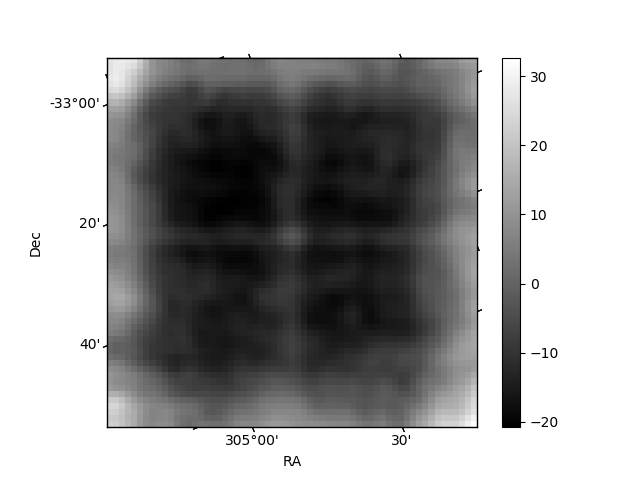
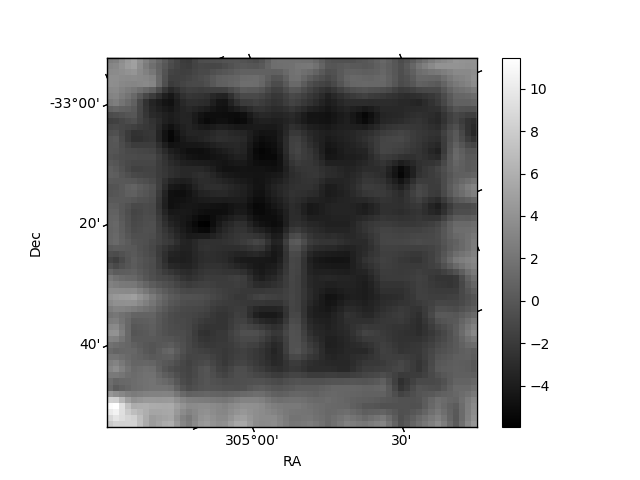
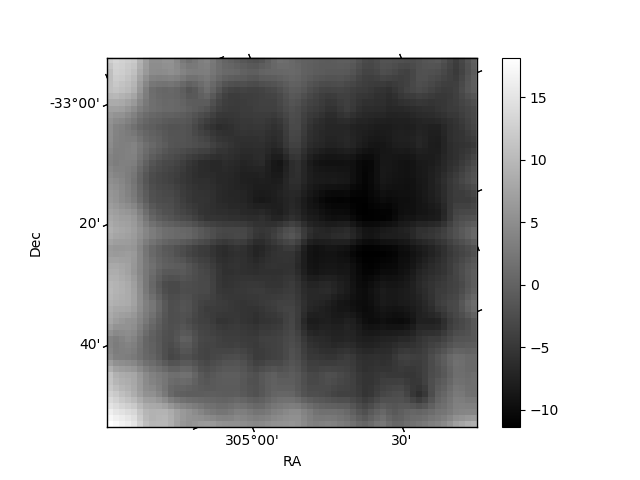
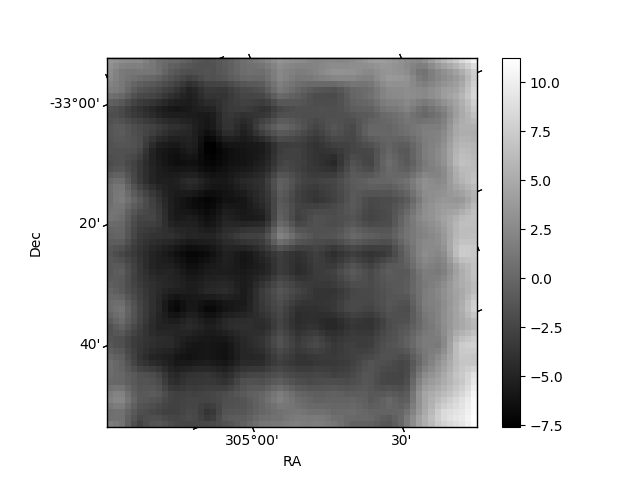
Histogram calculated using DETX and DETY for each event in the final _common_clean file
| Quadrant A | 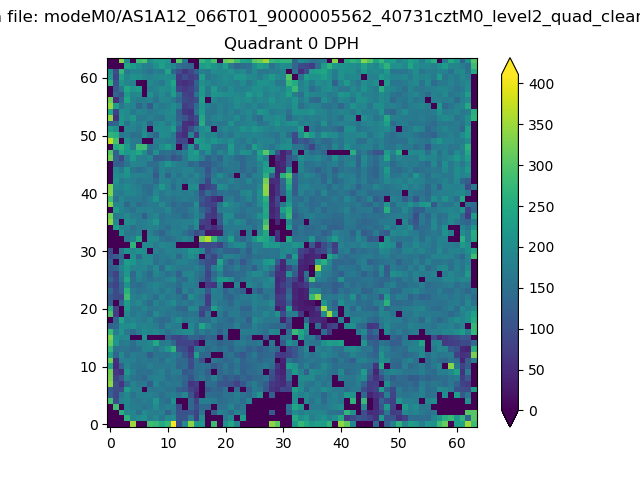 |
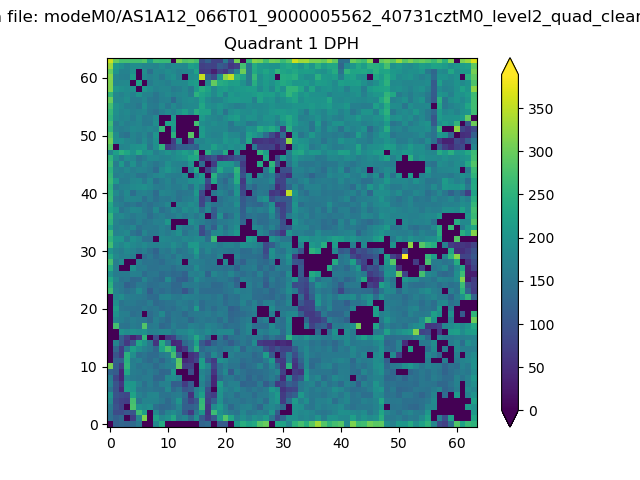 |
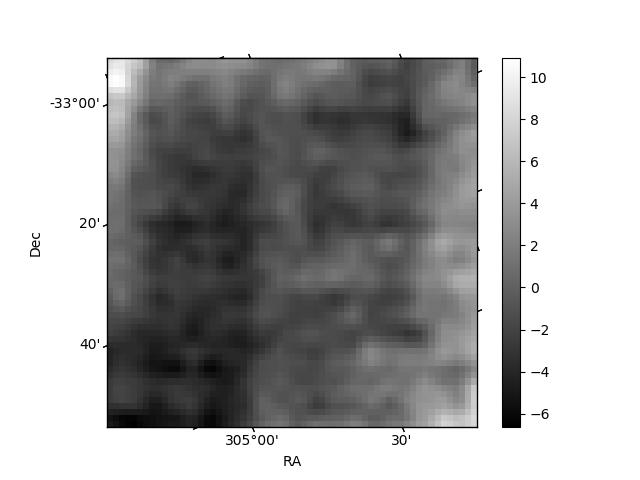
Quadrant B |
|---|---|---|---|
| Quadrant D | 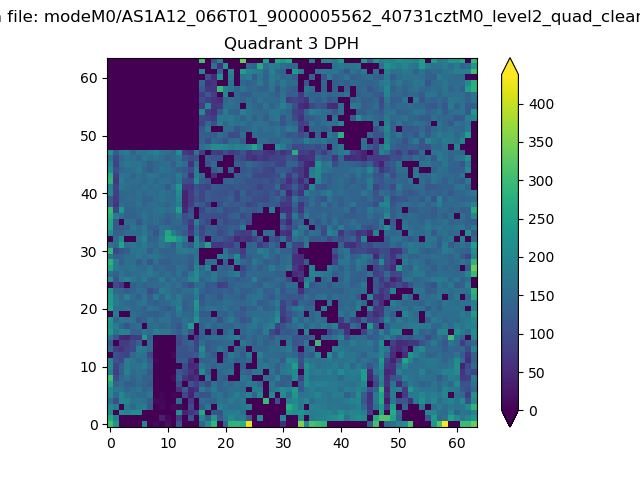 |
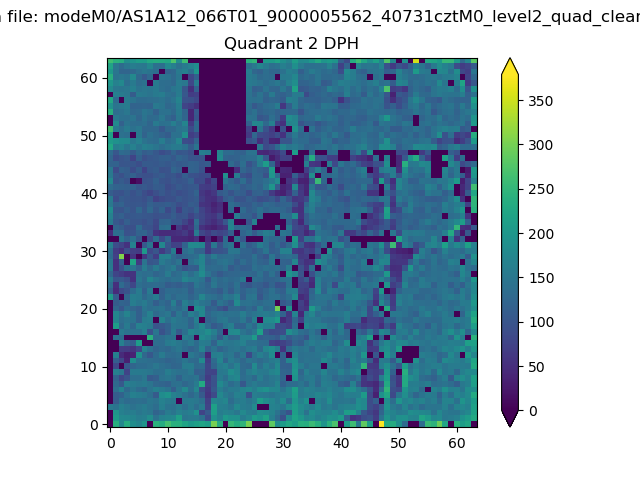 |
Quadrant C |
| Plot type | Count rate plots | Images |
|---|---|---|
| Comparison with Poisson distribution Blue bars denote a histogram of data divided into 1 sec bins. Red curve is a Poisson curve with rate = median count rate of data. |
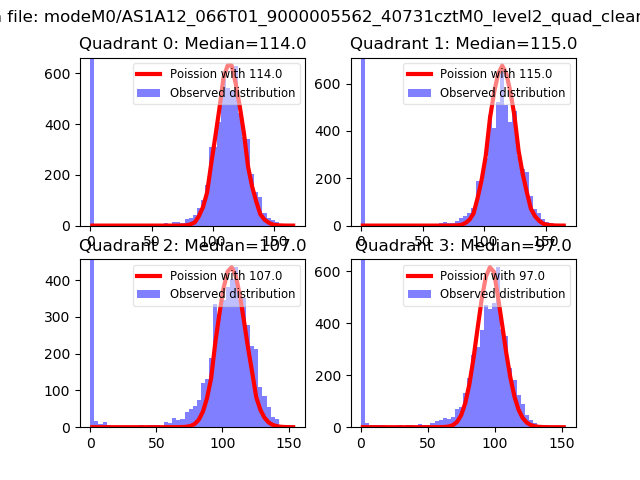 |
 |
| Quadrant-wise count rates Data is divided into 100 sec bins |
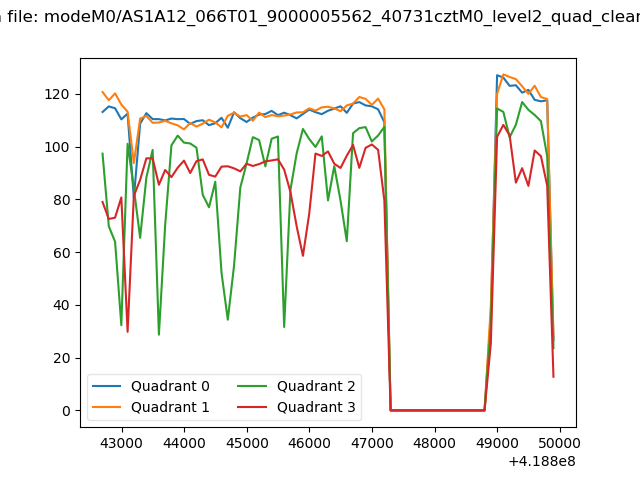 |
|
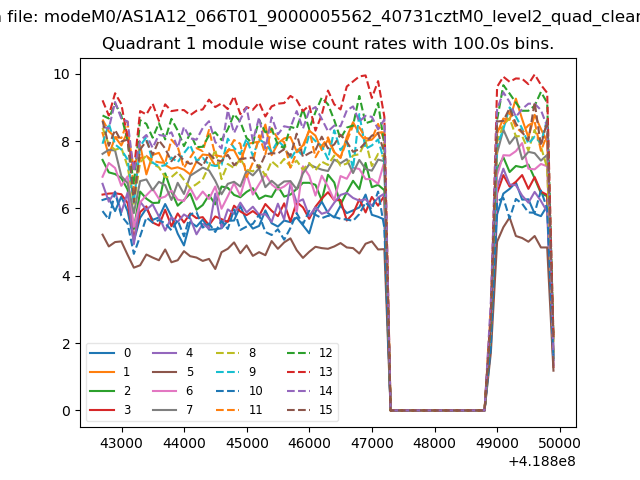
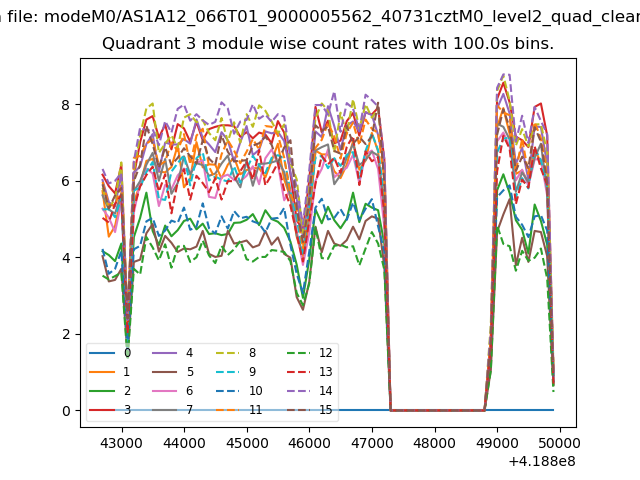
| Module-wise count rates for Quadrant A Data is divided into 100 sec bins |
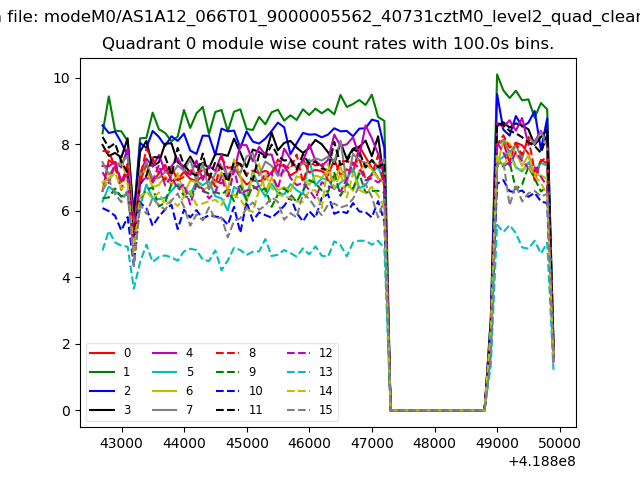 |
 |
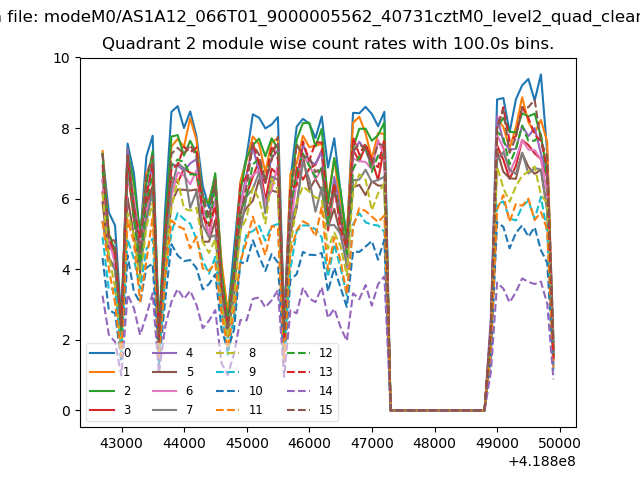
| Module-wise count rates for Quadrant B Data is divided into 100 sec bins |
 |
 |
| Module-wise count rates for Quadrant C Data is divided into 100 sec bins |
 |
 |
| Module-wise count rates for Quadrant D Data is divided into 100 sec bins |
 |
 |
| Parameter | Plot |
|---|---|
| CZT HV Monitor | 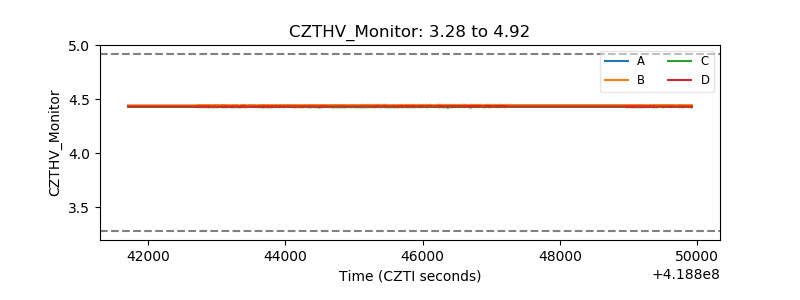 |
| D_VDD | 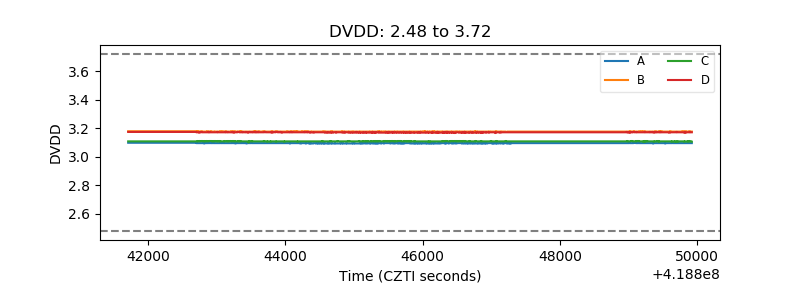 |
| Temperature 1 | 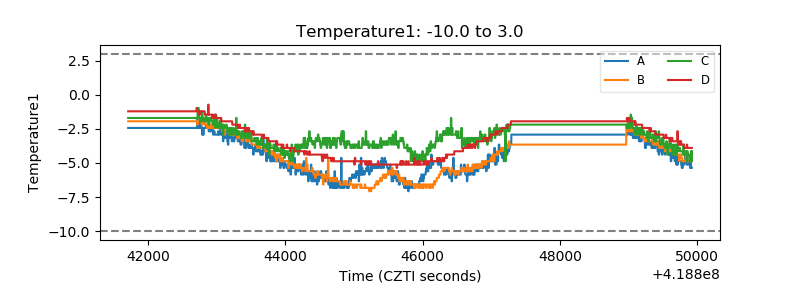 |
| Veto HV Monitor | 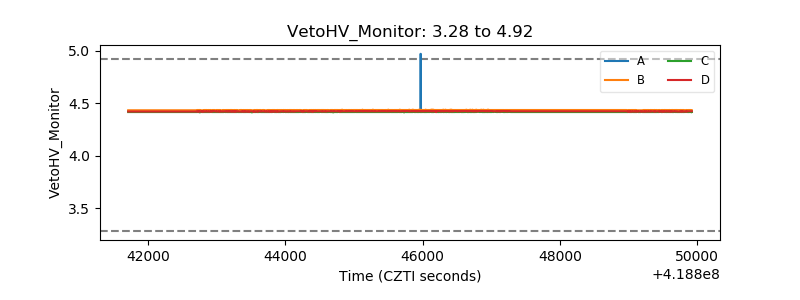 |
| Veto LLD | 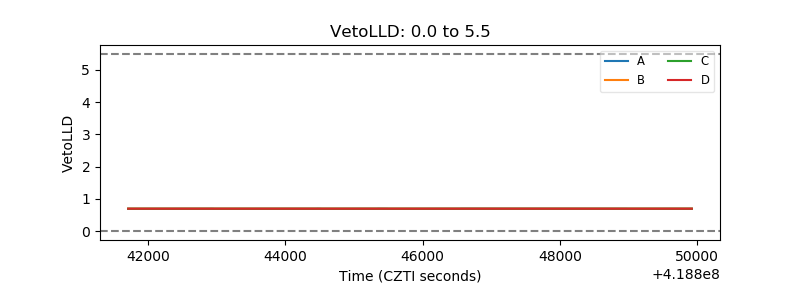 |
| Alpha Counter | 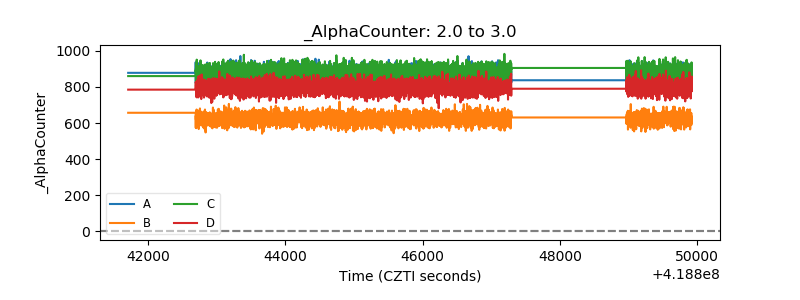 |
| _CPM_Rate | 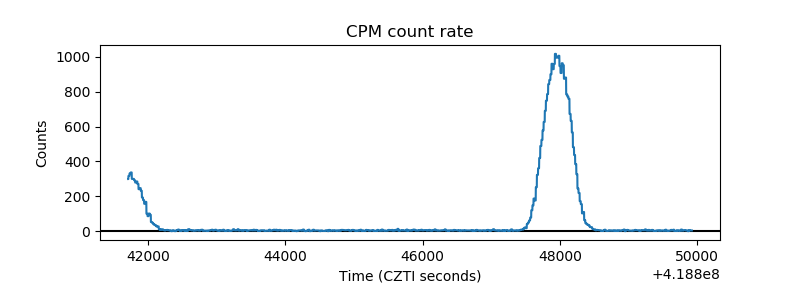 |
| CZT Counter | 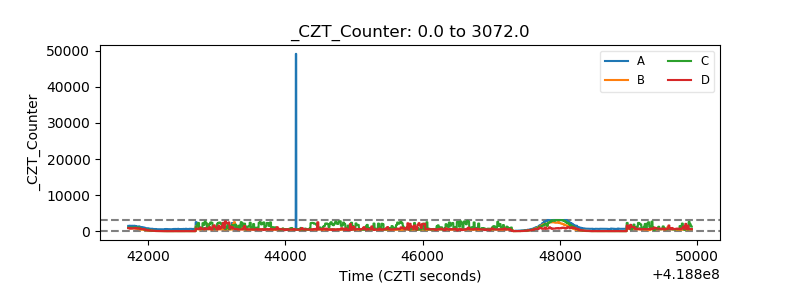 |
| +2.5 Volts monitor | 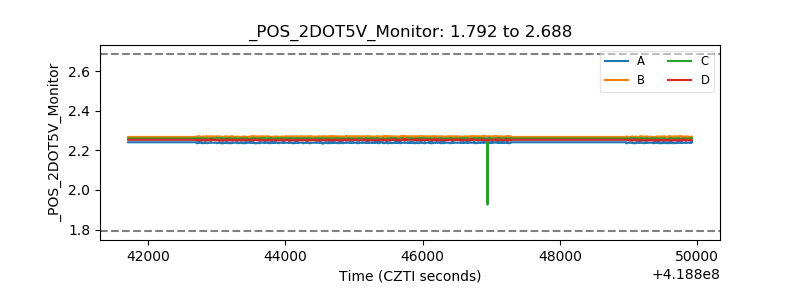 |
| +5 Volts monitor | 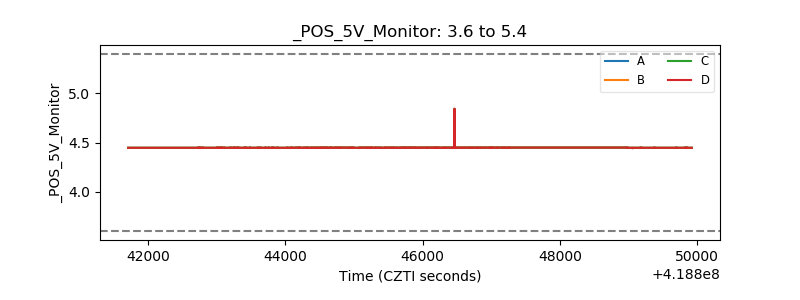 |
| _ROLL_ROT | 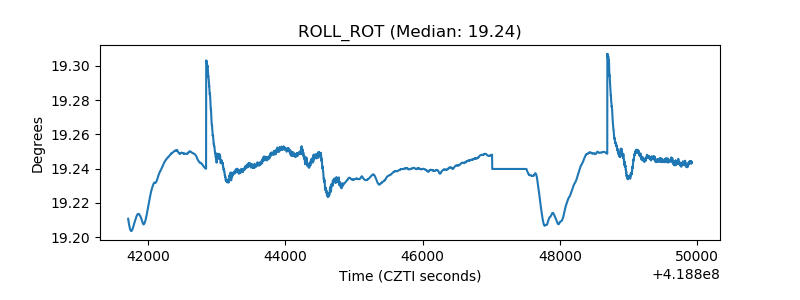 |
| _Roll_DEC | 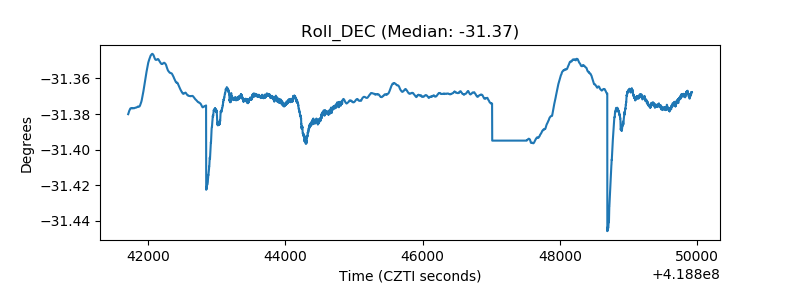 |
| _Roll_RA | 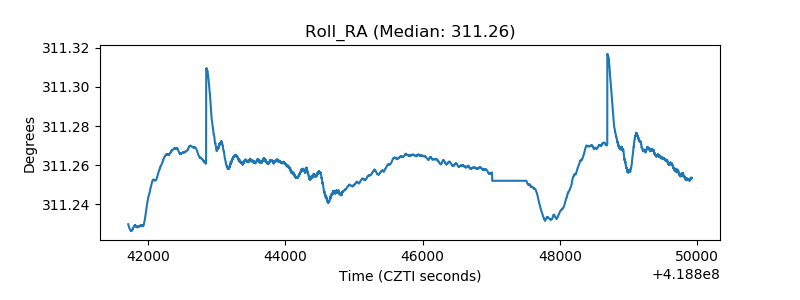 |
| Veto Counter | 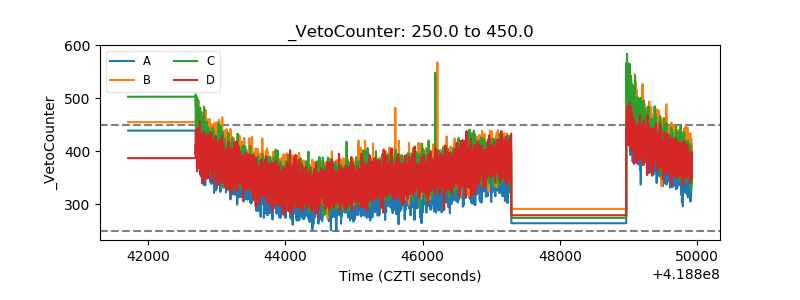 |