| Param | Original file | Final file |
|---|---|---|
| Filename | modeM0/AS1A12_066T01_9000005562_40733cztM0_level2.fits | modeM0/AS1A12_066T01_9000005562_40733cztM0_level2_quad_clean.evt |
| Size (bytes) | 519,068,160 | 82,152,000 |
| Size | 495.0 MB | 78.3 MB |
| Events in quadrant A | 3,091,662 | 620,314 |
| Events in quadrant B | 2,565,873 | 630,134 |
| Events in quadrant C | 6,805,757 | 494,333 |
| Events in quadrant D | 6,344,082 | 375,571 |
| Mode M0 | |||
|---|---|---|---|
| Quadrant | BADHDUFLAG | Total packets | Discarded packets |
| A | 0 | 12432 | 3 |
| B | 0 | 11019 | 2 |
| C | 0 | 23863 | 2 |
| D | 0 | 22395 | 2 |
| Mode M9 | |||
|---|---|---|---|
| Quadrant | BADHDUFLAG | Total packets | Discarded packets |
| A | 0 | 31 | 0 |
| B | 0 | 31 | 0 |
| C | 0 | 31 | 0 |
| D | 0 | 32 | 0 |
| Mode SS | |||
|---|---|---|---|
| Quadrant | BADHDUFLAG | Total packets | Discarded packets |
| A | 0 | 106 | 0 |
| B | 0 | 106 | 0 |
| C | 0 | 106 | 0 |
| D | 0 | 106 | 0 |
| Quadrant | Total seconds | Saturated seconds | Saturation percentage |
|---|---|---|---|
| A | 5233 | 56 | 1.070132% |
| B | 5233 | 31 | 0.592394% |
| C | 5233 | 1173 | 22.415440% |
| D | 5233 | 1941 | 37.091534% |
Noise dominated data is calculated using 1-second bins in cleaned event files. If a bin has >2000 counts, and if more than 50% of those come from <1% of pixels, then it is considered to be noise-dominated and hence unusable.
| Quadrant | # 1 sec bins | Bins with >0 counts | Bins with >2000 counts | High rate bins dominated by noise | Noise dominated (total time) | Noise dominated (detector-on time) | Marked lightcurve |
|---|---|---|---|---|---|---|---|
| A | 7056 | 5234 | 46 | 46 | 0.65% | 0.88% | 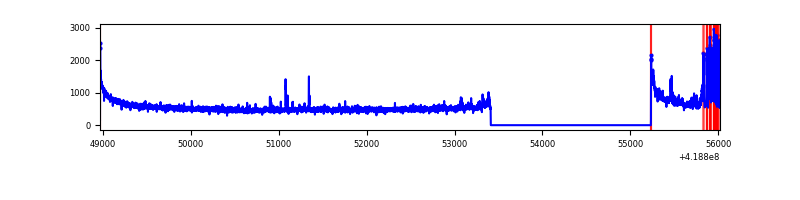 |
| B | 7056 | 5234 | 8 | 8 | 0.11% | 0.15% | 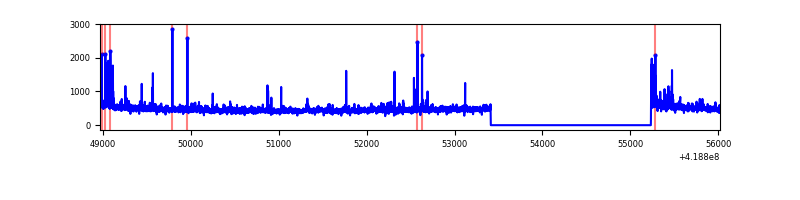 |
| C | 7055 | 5232 | 1108 | 1108 | 15.71% | 21.18% | 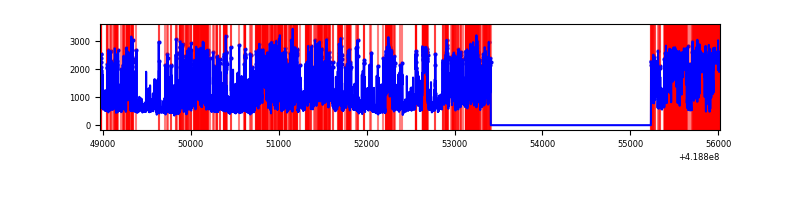 |
| D | 7055 | 5232 | 1304 | 1304 | 18.48% | 24.92% | 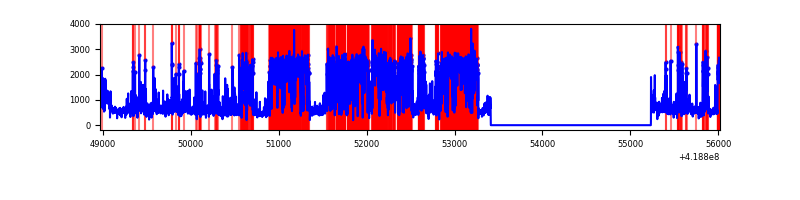 |
Top three noisy pixels from each quadrant. If the there are fewer than three noisy pixels in the level2.evt file, extra rows are filled as -1
| Pixel properties | Quadrant properties | ||||||
|---|---|---|---|---|---|---|---|
| Quadrant | DetID | PixID | Counts | Sigma | Mean | Median | Sigma |
| A | 10 | 83 | 498282 | 4037.96 | 600 | 588 | 123.3 |
| A | 13 | 248 | 239263 | 1936.45 | 600 | 588 | 123.3 |
| A | 12 | 189 | 18238 | 143.2 | 600 | 588 | 123.3 |
| B | 0 | 190 | 59913 | 513.34 | 598 | 582 | 115.6 |
| B | 4 | 170 | 56410 | 483.03 | 598 | 582 | 115.6 |
| B | 0 | 229 | 55082 | 471.54 | 598 | 582 | 115.6 |
| C | 9 | 187 | 4367330 | 34597.25 | 538 | 540 | 126.2 |
| C | 15 | 214 | 207671 | 1641.06 | 538 | 540 | 126.2 |
| C | 14 | 254 | 103003 | 811.79 | 538 | 540 | 126.2 |
| D | 1 | 47 | 3182531 | 26510.69 | 478 | 465 | 120.0 |
| D | 2 | 249 | 415491 | 3457.7 | 478 | 465 | 120.0 |
| D | 12 | 227 | 160570 | 1333.88 | 478 | 465 | 120.0 |
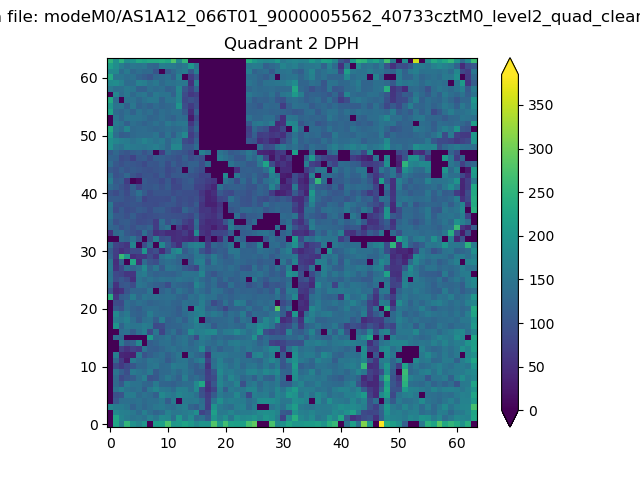
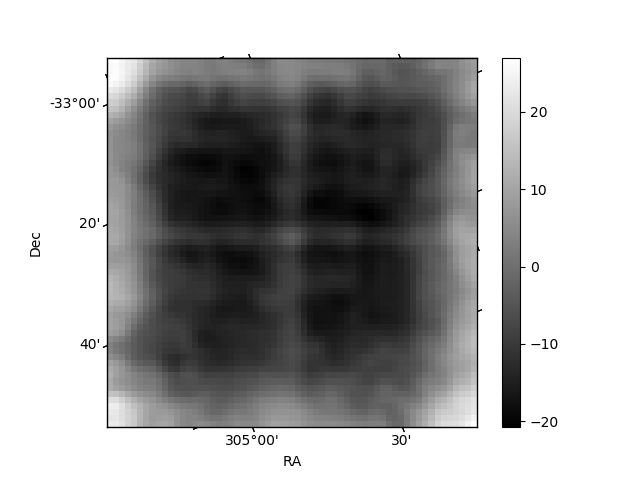
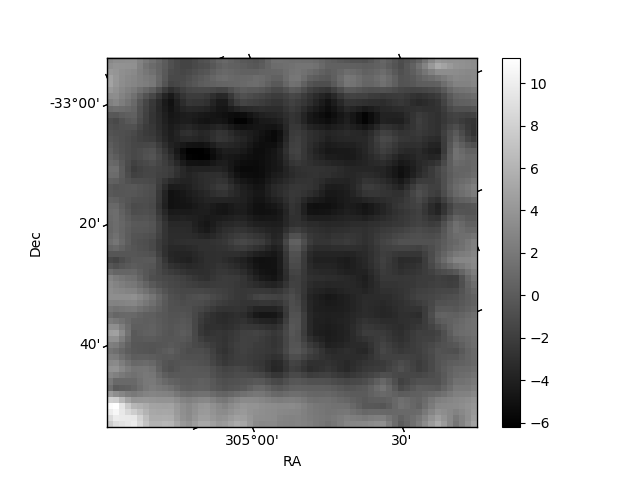
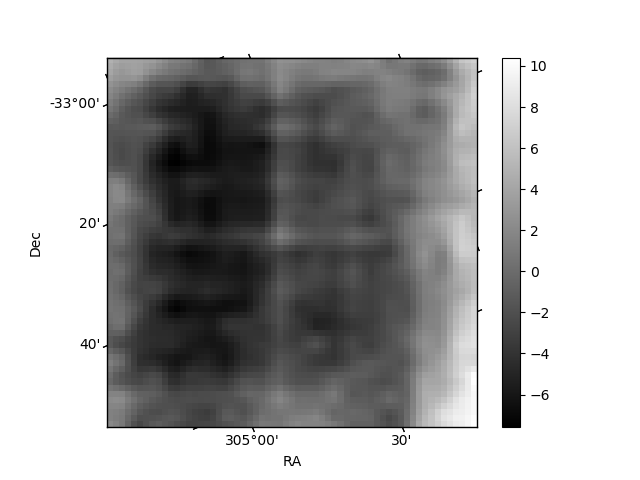
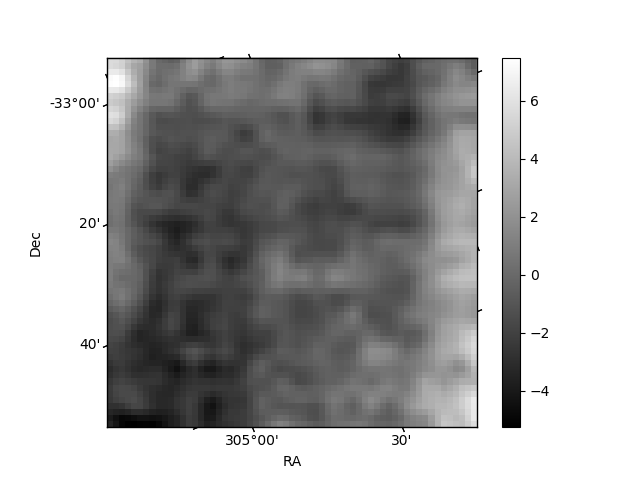
Histogram calculated using DETX and DETY for each event in the final _common_clean file
| Quadrant A | 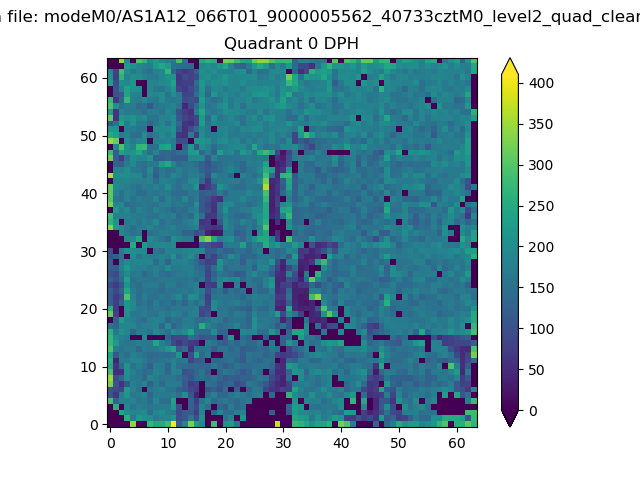 |
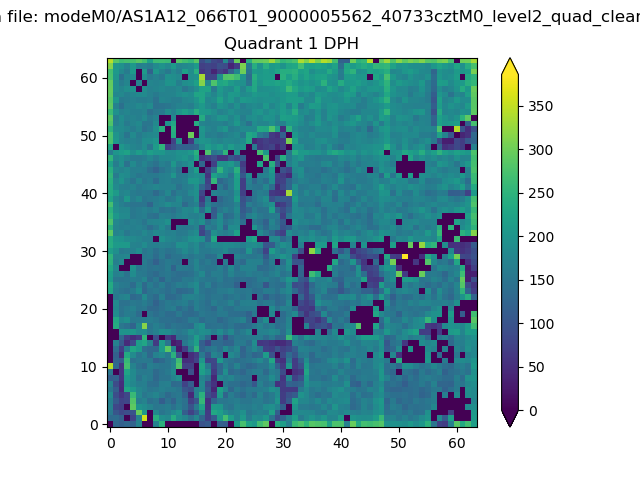 |
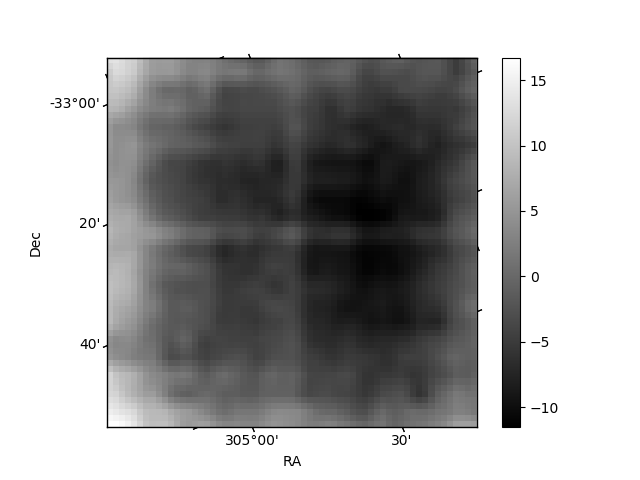
Quadrant B |
|---|---|---|---|
| Quadrant D | 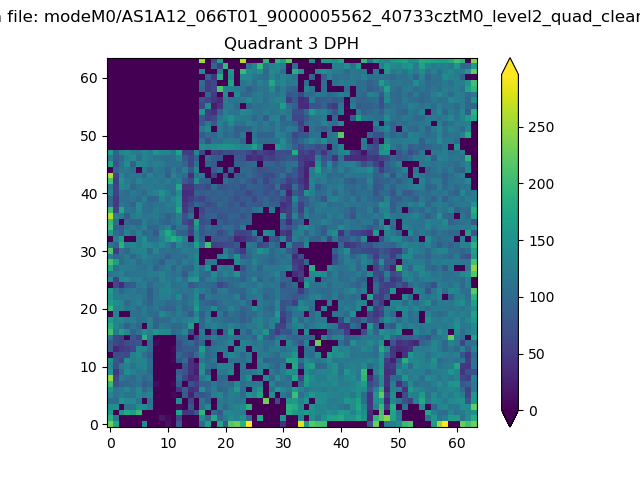 |
 |
Quadrant C |
| Plot type | Count rate plots | Images |
|---|---|---|
| Comparison with Poisson distribution Blue bars denote a histogram of data divided into 1 sec bins. Red curve is a Poisson curve with rate = median count rate of data. |
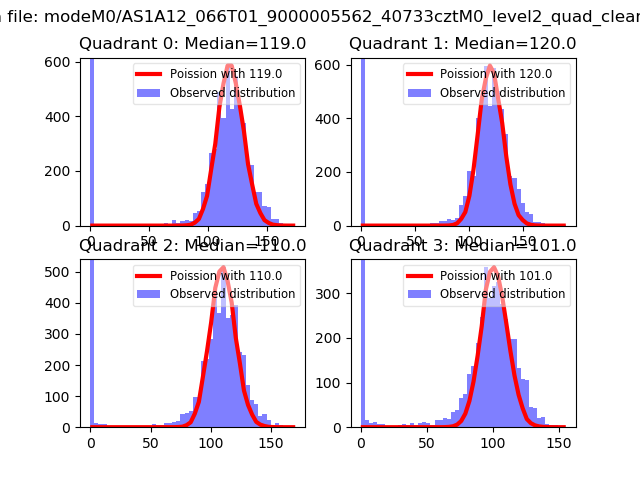 |
 |
| Quadrant-wise count rates Data is divided into 100 sec bins |
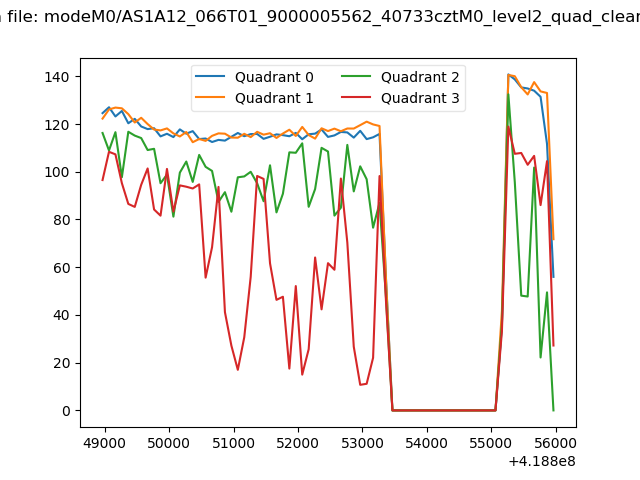 |
|
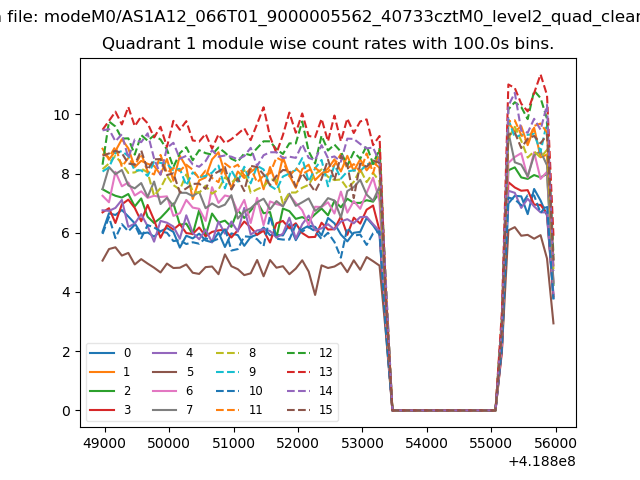
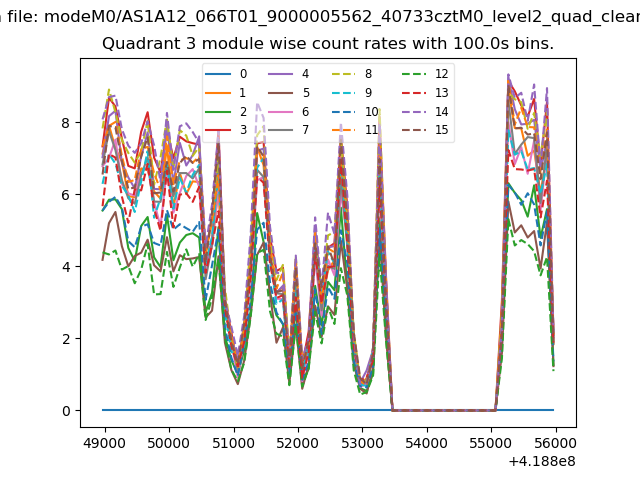
| Module-wise count rates for Quadrant A Data is divided into 100 sec bins |
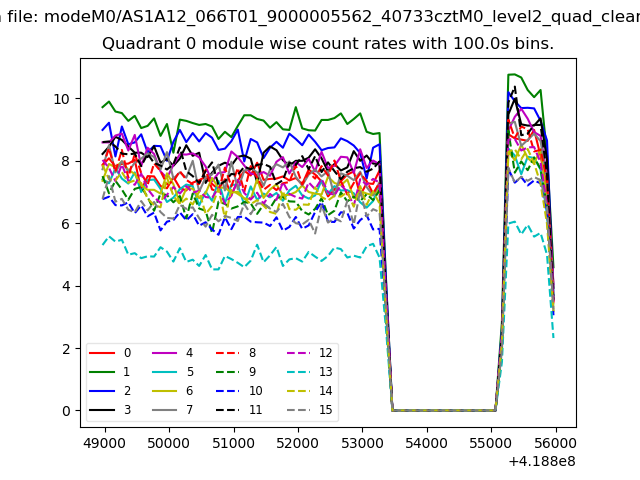 |
 |
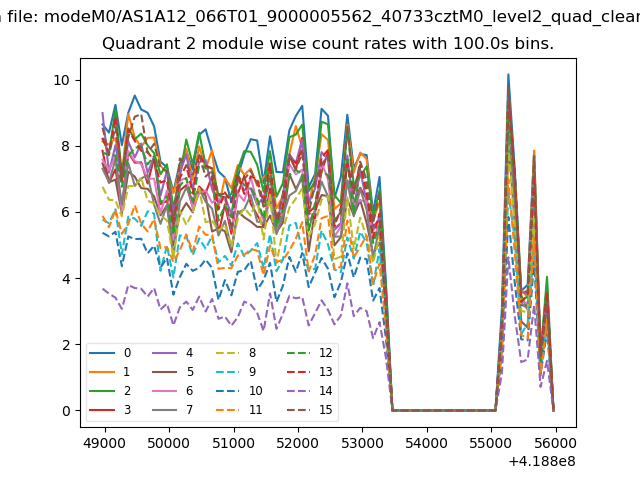
| Module-wise count rates for Quadrant B Data is divided into 100 sec bins |
 |
 |
| Module-wise count rates for Quadrant C Data is divided into 100 sec bins |
 |
 |
| Module-wise count rates for Quadrant D Data is divided into 100 sec bins |
 |
 |
| Parameter | Plot |
|---|---|
| CZT HV Monitor | 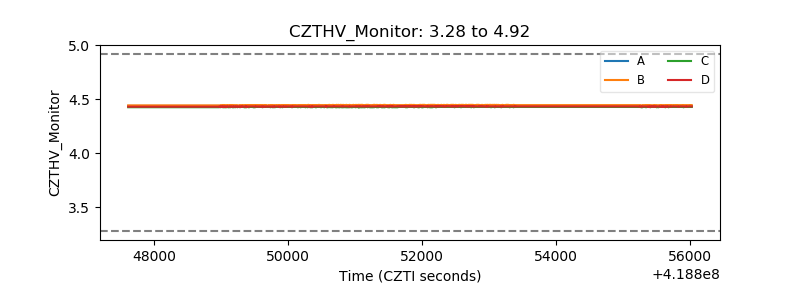 |
| D_VDD | 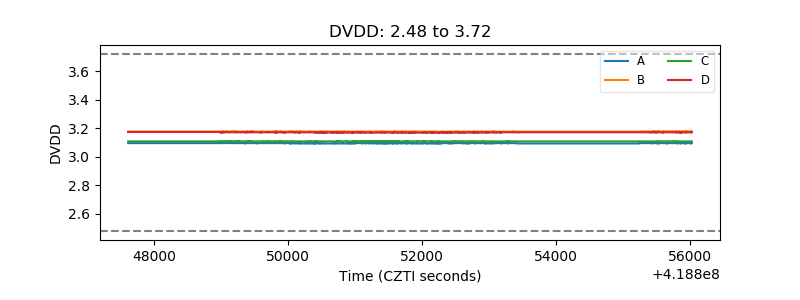 |
| Temperature 1 | 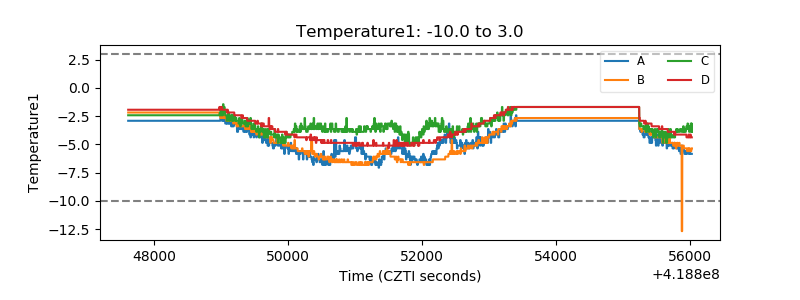 |
| Veto HV Monitor |  |
| Veto LLD | 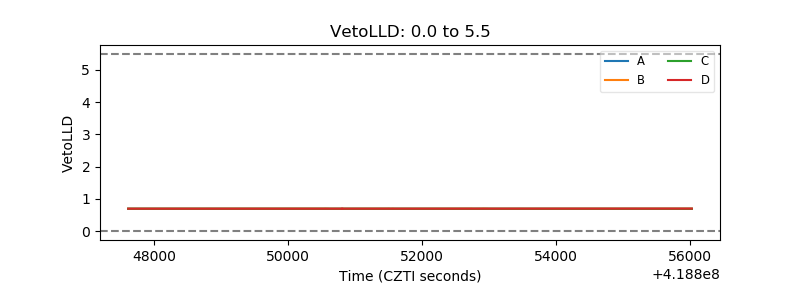 |
| Alpha Counter | 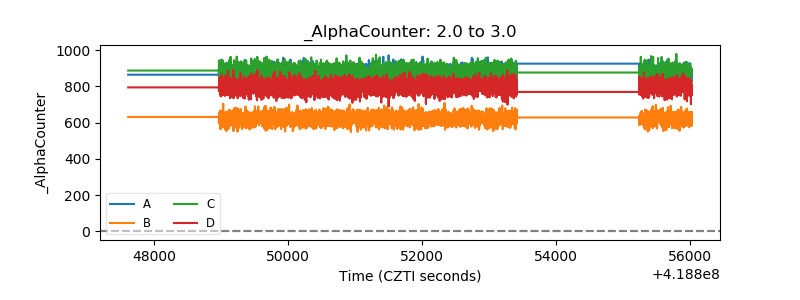 |
| _CPM_Rate | 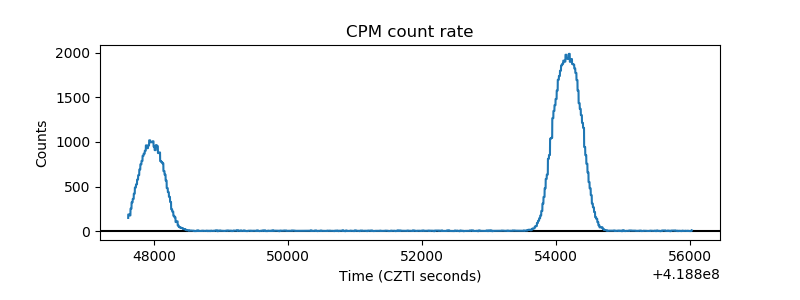 |
| CZT Counter | 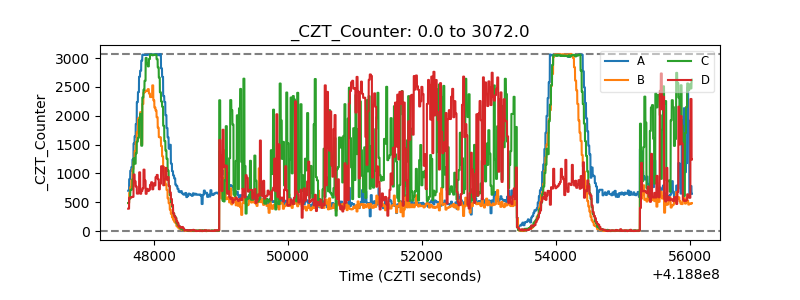 |
| +2.5 Volts monitor | 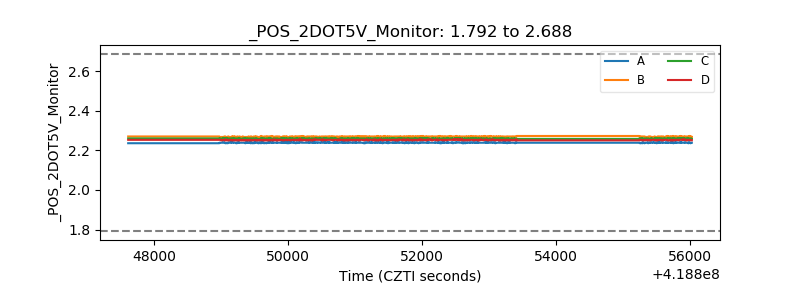 |
| +5 Volts monitor | 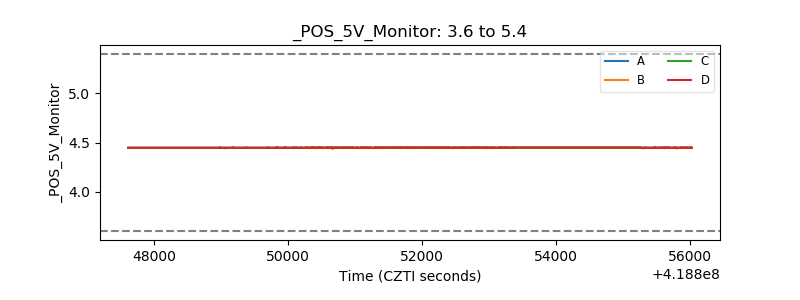 |
| _ROLL_ROT | 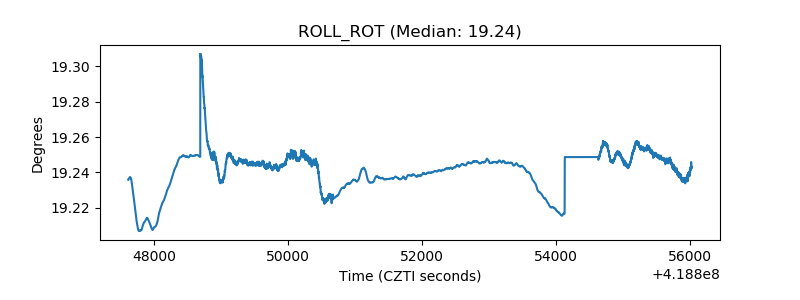 |
| _Roll_DEC | 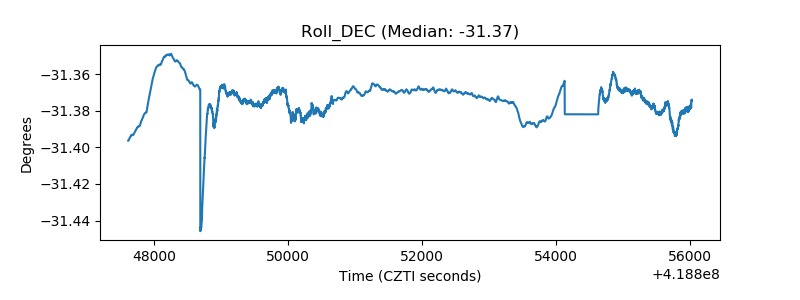 |
| _Roll_RA | 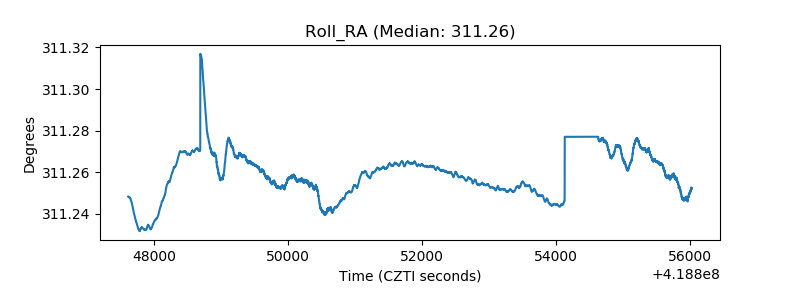 |
| Veto Counter | 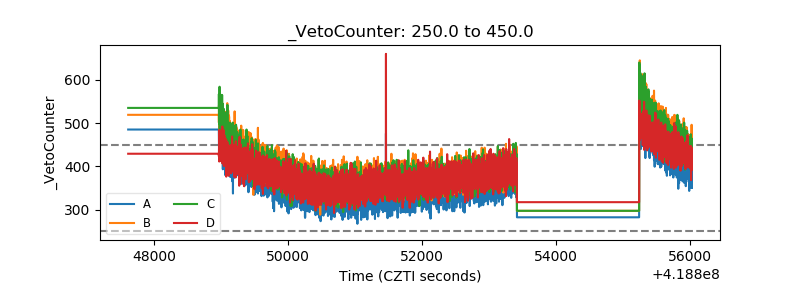 |