| Param | Original file | Final file |
|---|---|---|
| Filename | modeM0/AS1A12_066T01_9000005562_40734cztM0_level2.fits | modeM0/AS1A12_066T01_9000005562_40734cztM0_level2_quad_clean.evt |
| Size (bytes) | 552,026,880 | 82,028,160 |
| Size | 526.5 MB | 78.2 MB |
| Events in quadrant A | 3,795,963 | 622,165 |
| Events in quadrant B | 2,485,382 | 655,063 |
| Events in quadrant C | 9,014,368 | 378,688 |
| Events in quadrant D | 4,739,545 | 468,148 |
| Mode M0 | |||
|---|---|---|---|
| Quadrant | BADHDUFLAG | Total packets | Discarded packets |
| A | 0 | 14553 | 3 |
| B | 0 | 10655 | 2 |
| C | 0 | 30362 | 2 |
| D | 0 | 17533 | 2 |
| Mode M9 | |||
|---|---|---|---|
| Quadrant | BADHDUFLAG | Total packets | Discarded packets |
| A | 0 | 24 | 0 |
| B | 0 | 24 | 0 |
| C | 0 | 24 | 0 |
| D | 0 | 25 | 0 |
| Mode SS | |||
|---|---|---|---|
| Quadrant | BADHDUFLAG | Total packets | Discarded packets |
| A | 0 | 104 | 0 |
| B | 0 | 104 | 0 |
| C | 0 | 104 | 0 |
| D | 0 | 104 | 0 |
| Quadrant | Total seconds | Saturated seconds | Saturation percentage |
|---|---|---|---|
| A | 5132 | 201 | 3.916602% |
| B | 5132 | 15 | 0.292284% |
| C | 5132 | 2368 | 46.141855% |
| D | 5132 | 1161 | 22.622759% |
Noise dominated data is calculated using 1-second bins in cleaned event files. If a bin has >2000 counts, and if more than 50% of those come from <1% of pixels, then it is considered to be noise-dominated and hence unusable.
| Quadrant | # 1 sec bins | Bins with >0 counts | Bins with >2000 counts | High rate bins dominated by noise | Noise dominated (total time) | Noise dominated (detector-on time) | Marked lightcurve |
|---|---|---|---|---|---|---|---|
| A | 7075 | 5133 | 195 | 195 | 2.76% | 3.80% | 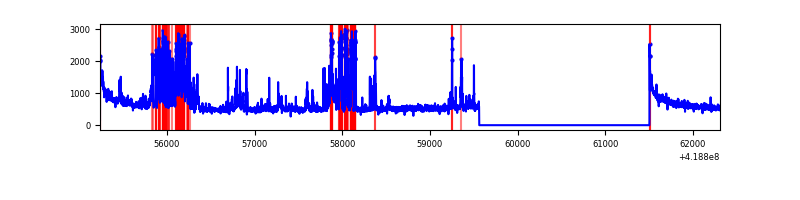 |
| B | 7075 | 5133 | 1 | 1 | 0.01% | 0.02% | 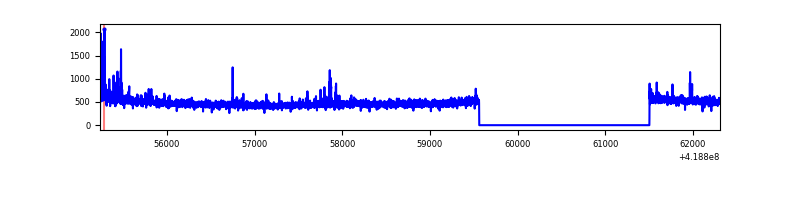 |
| C | 7075 | 5133 | 2256 | 2256 | 31.89% | 43.95% | 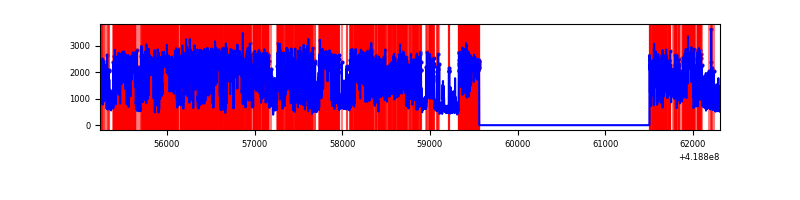 |
| D | 7075 | 5133 | 561 | 561 | 7.93% | 10.93% | 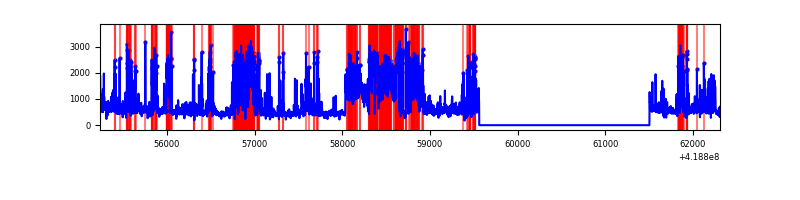 |
Top three noisy pixels from each quadrant. If the there are fewer than three noisy pixels in the level2.evt file, extra rows are filled as -1
| Pixel properties | Quadrant properties | ||||||
|---|---|---|---|---|---|---|---|
| Quadrant | DetID | PixID | Counts | Sigma | Mean | Median | Sigma |
| A | 13 | 248 | 972608 | 8024.63 | 598 | 586 | 121.1 |
| A | 10 | 83 | 480692 | 3963.57 | 598 | 586 | 121.1 |
| A | 12 | 189 | 21099 | 169.35 | 598 | 586 | 121.1 |
| B | 0 | 229 | 36253 | 307.07 | 605 | 588 | 116.1 |
| B | 0 | 190 | 33732 | 285.37 | 605 | 588 | 116.1 |
| B | 4 | 170 | 17283 | 143.74 | 605 | 588 | 116.1 |
| C | 9 | 187 | 6863093 | 61487.97 | 480 | 483 | 111.6 |
| C | 15 | 214 | 180675 | 1614.49 | 480 | 483 | 111.6 |
| C | 14 | 254 | 46783 | 414.84 | 480 | 483 | 111.6 |
| D | 12 | 227 | 1018278 | 7753.37 | 533 | 519 | 131.3 |
| D | 1 | 47 | 797160 | 6068.88 | 533 | 519 | 131.3 |
| D | 2 | 249 | 353985 | 2692.73 | 533 | 519 | 131.3 |
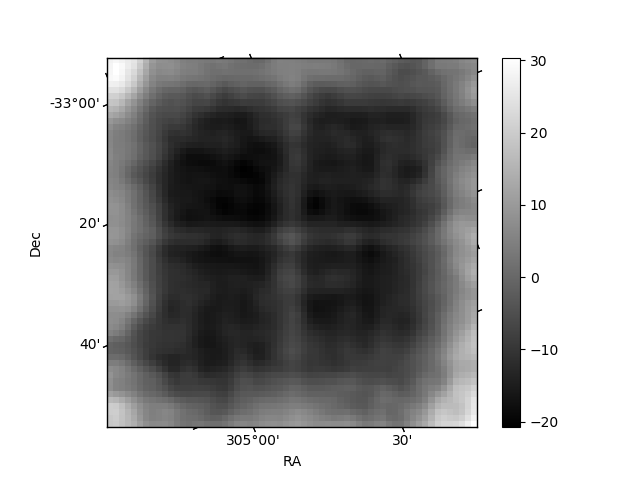
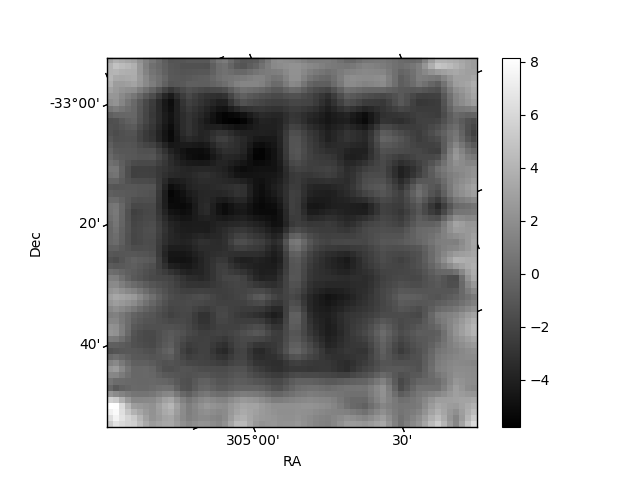
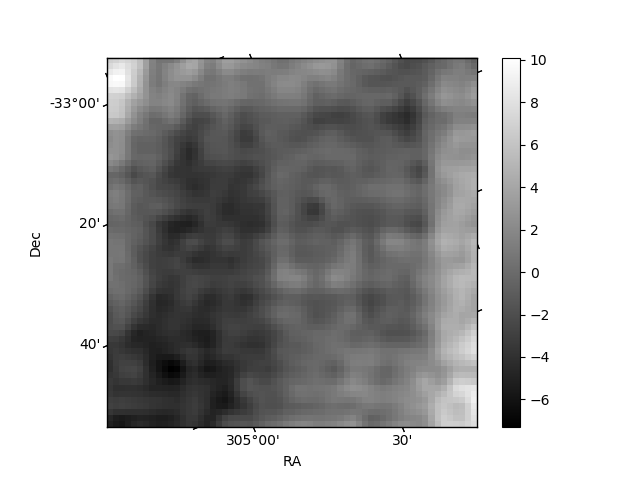
Histogram calculated using DETX and DETY for each event in the final _common_clean file
| Quadrant A | 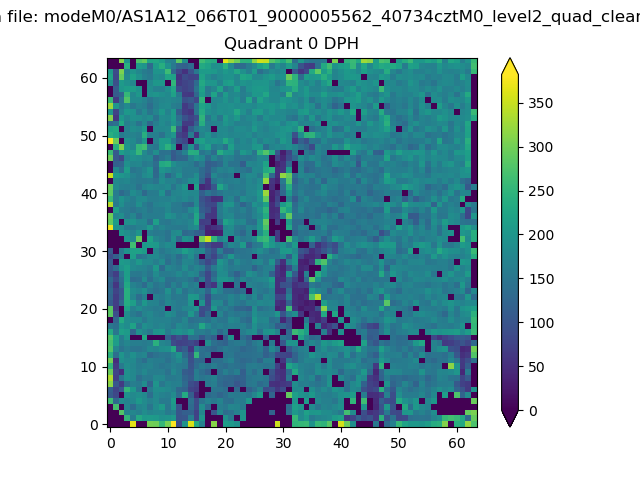 |
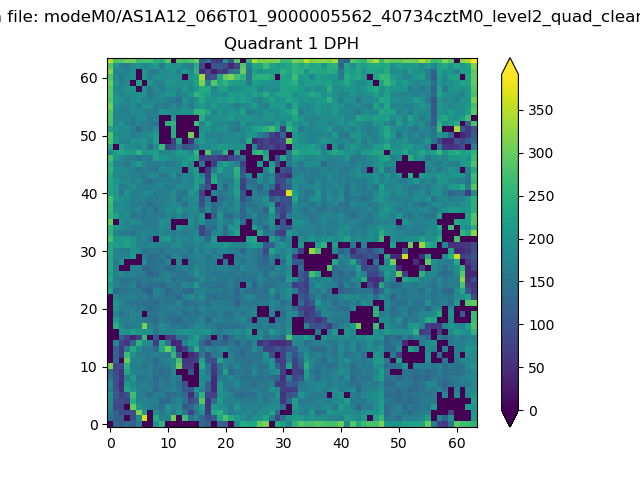 |
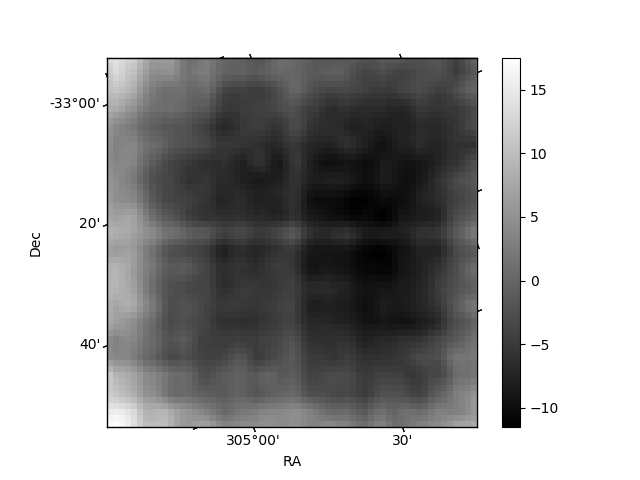
Quadrant B |
|---|---|---|---|
| Quadrant D | 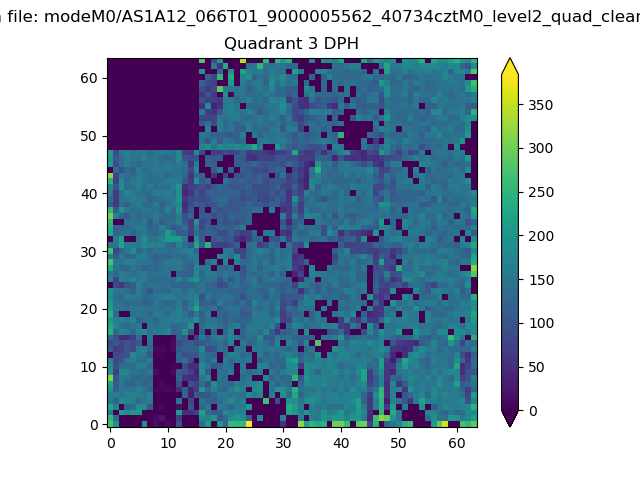 |
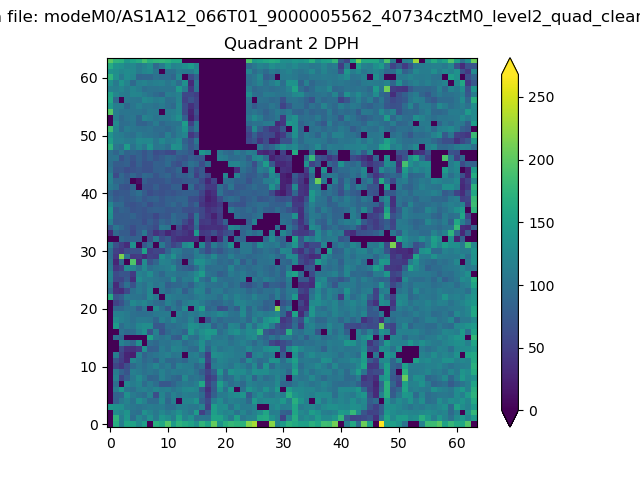 |
Quadrant C |
| Plot type | Count rate plots | Images |
|---|---|---|
| Comparison with Poisson distribution Blue bars denote a histogram of data divided into 1 sec bins. Red curve is a Poisson curve with rate = median count rate of data. |
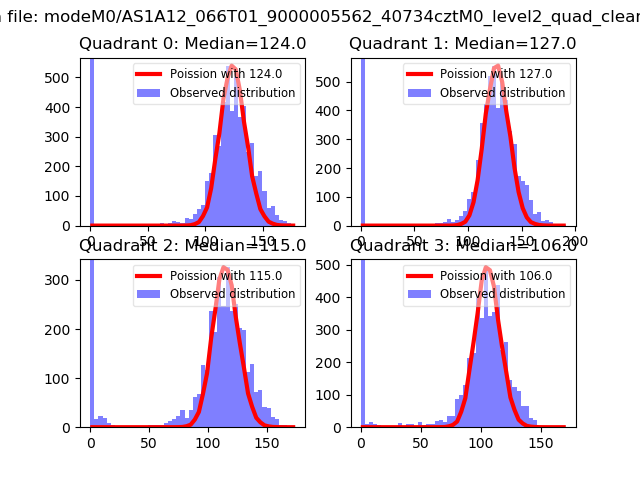 |
 |
| Quadrant-wise count rates Data is divided into 100 sec bins |
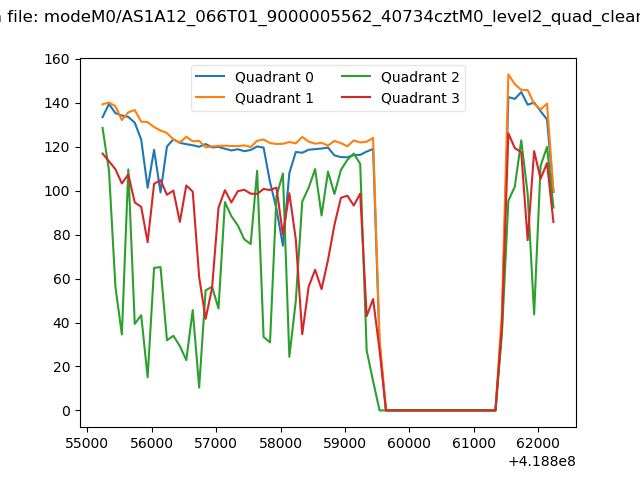 |
|
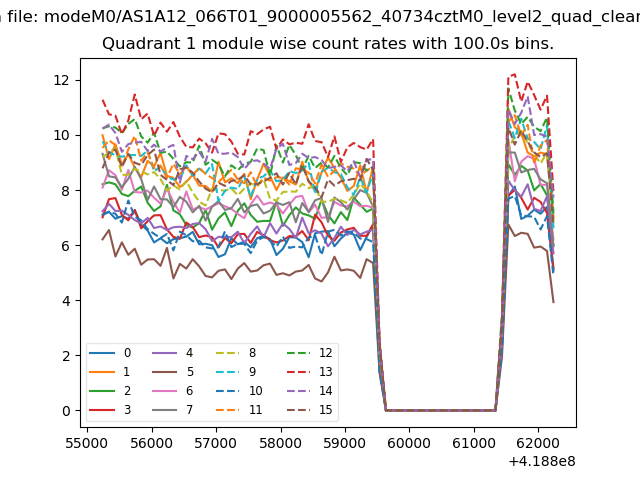
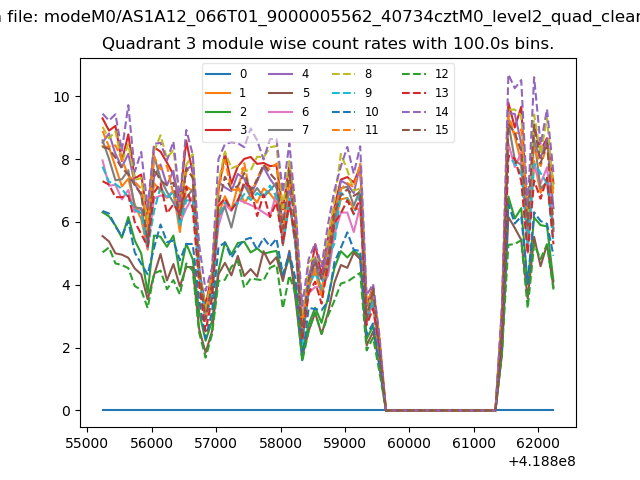
| Module-wise count rates for Quadrant A Data is divided into 100 sec bins |
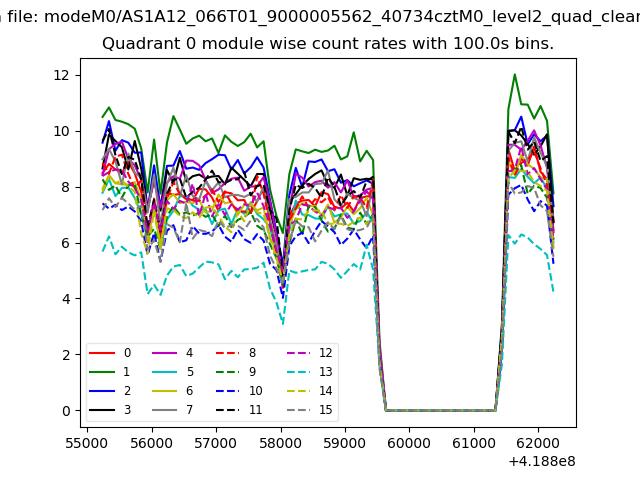 |
 |
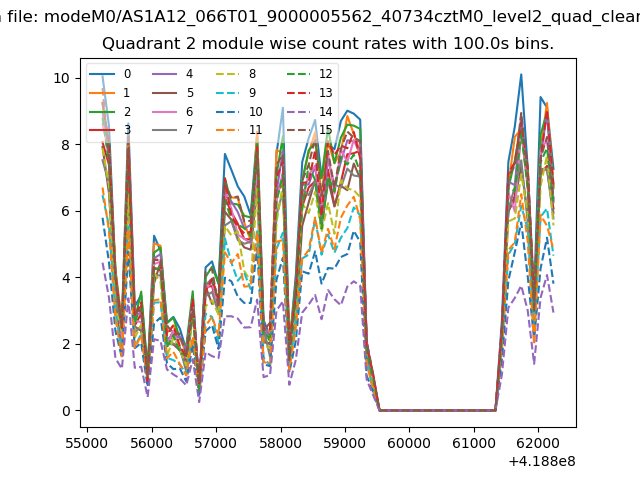
| Module-wise count rates for Quadrant B Data is divided into 100 sec bins |
 |
 |
| Module-wise count rates for Quadrant C Data is divided into 100 sec bins |
 |
 |
| Module-wise count rates for Quadrant D Data is divided into 100 sec bins |
 |
 |
| Parameter | Plot |
|---|---|
| CZT HV Monitor | 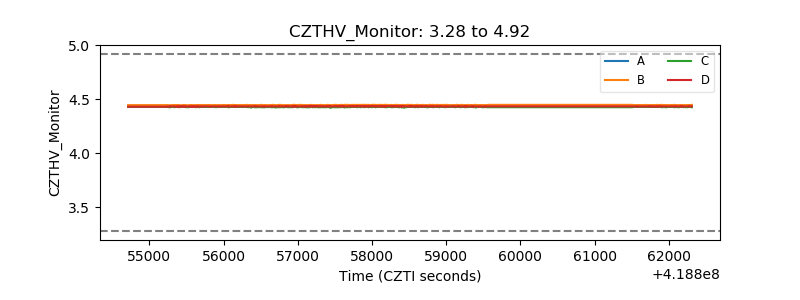 |
| D_VDD | 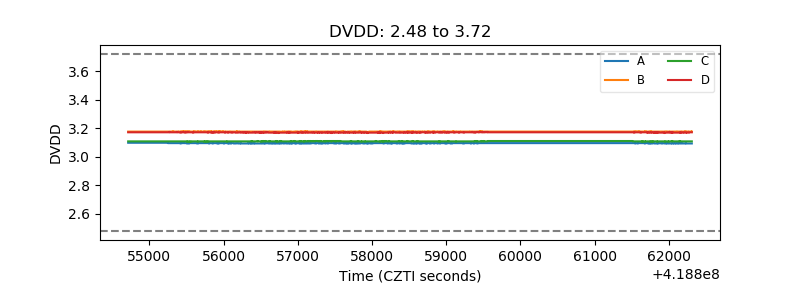 |
| Temperature 1 | 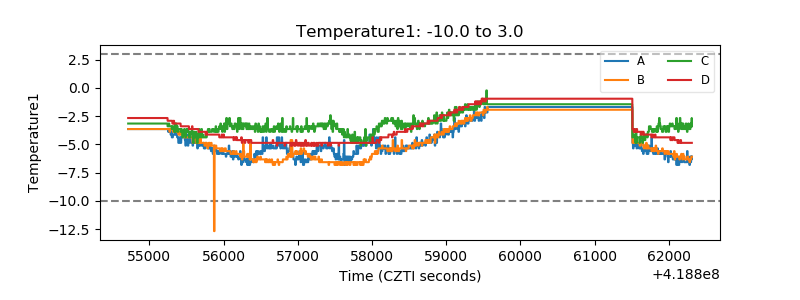 |
| Veto HV Monitor |  |
| Veto LLD | 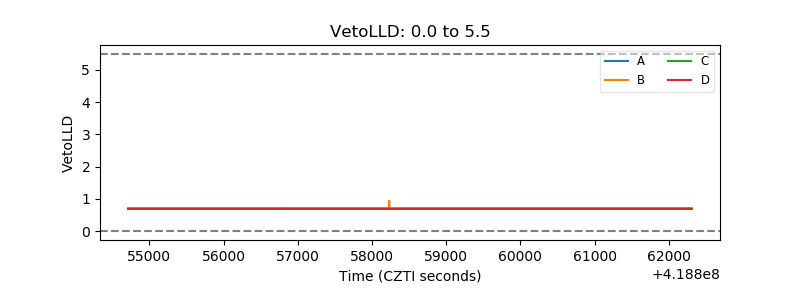 |
| Alpha Counter | 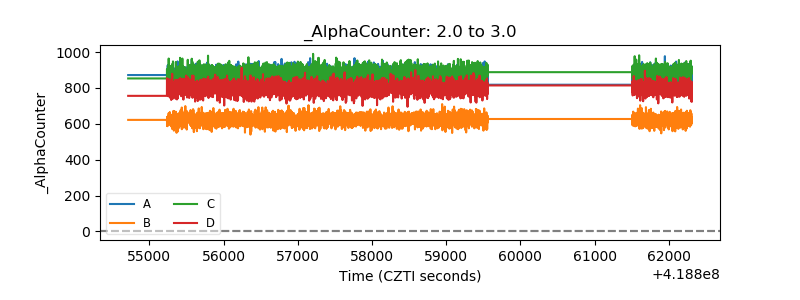 |
| _CPM_Rate | 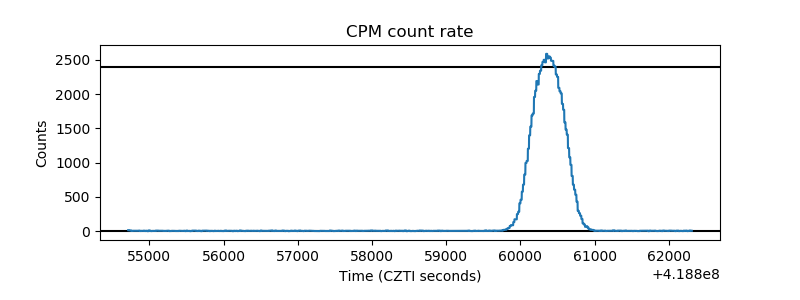 |
| CZT Counter | 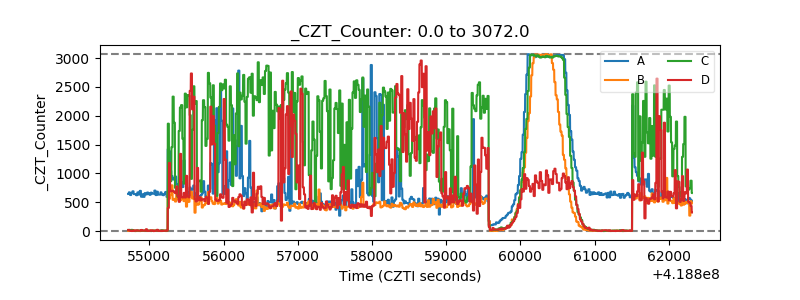 |
| +2.5 Volts monitor | 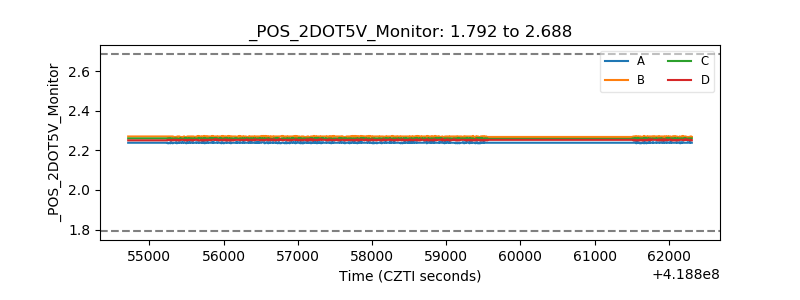 |
| +5 Volts monitor | 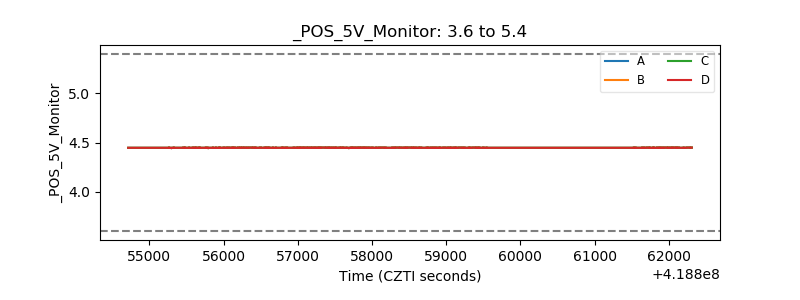 |
| _ROLL_ROT | 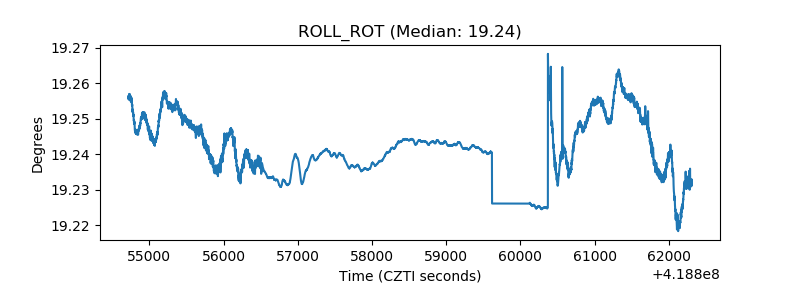 |
| _Roll_DEC | 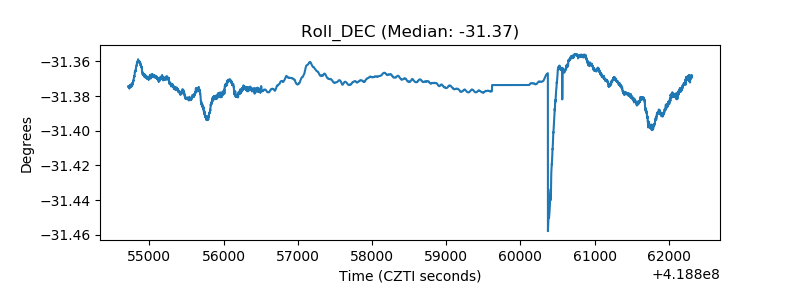 |
| _Roll_RA | 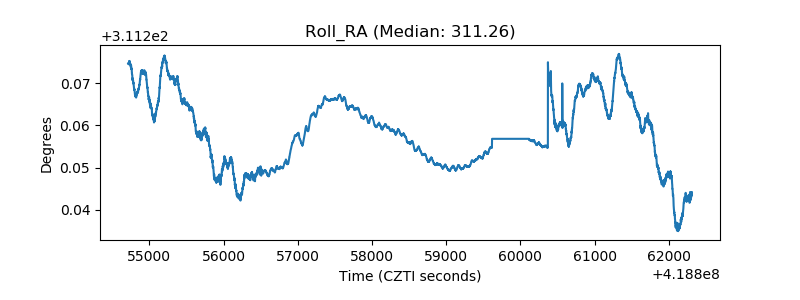 |
| Veto Counter | 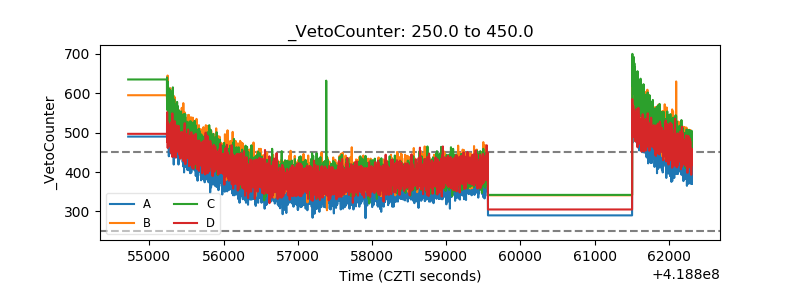 |