| Param | Original file | Final file |
|---|---|---|
| Filename | modeM0/AS1A12_066T01_9000005562_40735cztM0_level2.fits | modeM0/AS1A12_066T01_9000005562_40735cztM0_level2_quad_clean.evt |
| Size (bytes) | 521,127,360 | 80,084,160 |
| Size | 497.0 MB | 76.4 MB |
| Events in quadrant A | 3,797,288 | 604,349 |
| Events in quadrant B | 2,465,542 | 649,221 |
| Events in quadrant C | 9,475,063 | 318,216 |
| Events in quadrant D | 3,166,237 | 504,314 |
| Mode M0 | |||
|---|---|---|---|
| Quadrant | BADHDUFLAG | Total packets | Discarded packets |
| A | 0 | 14479 | 3 |
| B | 0 | 10350 | 2 |
| C | 0 | 31577 | 2 |
| D | 0 | 12644 | 2 |
| Mode M9 | |||
|---|---|---|---|
| Quadrant | BADHDUFLAG | Total packets | Discarded packets |
| A | 0 | 32 | 0 |
| B | 0 | 32 | 0 |
| C | 0 | 32 | 0 |
| D | 0 | 33 | 0 |
| Mode SS | |||
|---|---|---|---|
| Quadrant | BADHDUFLAG | Total packets | Discarded packets |
| A | 0 | 102 | 0 |
| B | 0 | 102 | 0 |
| C | 0 | 102 | 0 |
| D | 0 | 102 | 0 |
| Quadrant | Total seconds | Saturated seconds | Saturation percentage |
|---|---|---|---|
| A | 4964 | 298 | 6.003223% |
| B | 4964 | 5 | 0.100725% |
| C | 4964 | 2771 | 55.821918% |
| D | 4964 | 649 | 13.074134% |
Noise dominated data is calculated using 1-second bins in cleaned event files. If a bin has >2000 counts, and if more than 50% of those come from <1% of pixels, then it is considered to be noise-dominated and hence unusable.
| Quadrant | # 1 sec bins | Bins with >0 counts | Bins with >2000 counts | High rate bins dominated by noise | Noise dominated (total time) | Noise dominated (detector-on time) | Marked lightcurve |
|---|---|---|---|---|---|---|---|
| A | 7027 | 4965 | 258 | 258 | 3.67% | 5.20% | 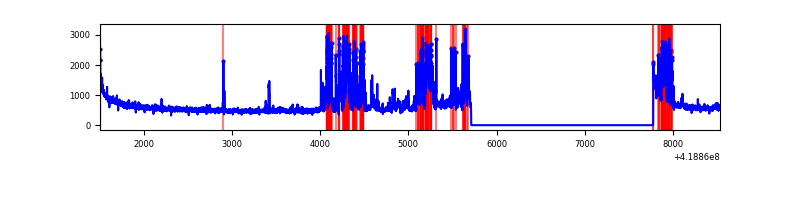 |
| B | 7027 | 4965 | 0 | 0 | 0.00% | 0.00% | 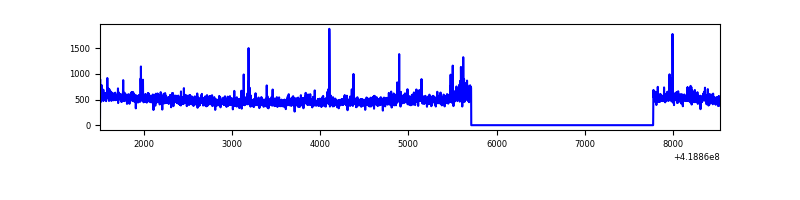 |
| C | 7027 | 4964 | 2680 | 2680 | 38.14% | 53.99% | 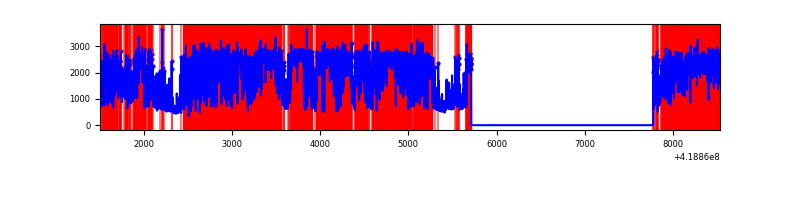 |
| D | 7027 | 4964 | 117 | 117 | 1.67% | 2.36% | 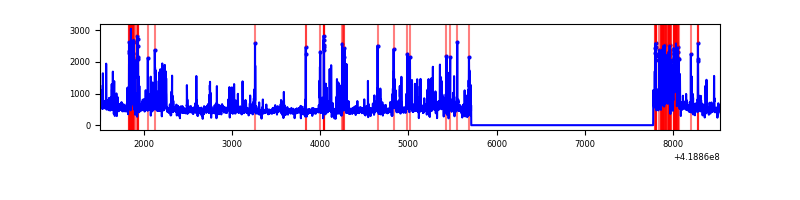 |
Top three noisy pixels from each quadrant. If the there are fewer than three noisy pixels in the level2.evt file, extra rows are filled as -1
| Pixel properties | Quadrant properties | ||||||
|---|---|---|---|---|---|---|---|
| Quadrant | DetID | PixID | Counts | Sigma | Mean | Median | Sigma |
| A | 13 | 248 | 959762 | 8121.91 | 582 | 571 | 118.1 |
| A | 10 | 83 | 457698 | 3870.7 | 582 | 571 | 118.1 |
| A | 12 | 189 | 130333 | 1098.75 | 582 | 571 | 118.1 |
| B | 4 | 170 | 58986 | 519.94 | 592 | 576 | 112.3 |
| B | 0 | 229 | 20800 | 180.02 | 592 | 576 | 112.3 |
| B | 4 | 171 | 19606 | 169.4 | 592 | 576 | 112.3 |
| C | 9 | 187 | 7419767 | 69630.43 | 457 | 461 | 106.6 |
| C | 15 | 214 | 168831 | 1580.16 | 457 | 461 | 106.6 |
| C | 14 | 254 | 66437 | 619.19 | 457 | 461 | 106.6 |
| D | 2 | 249 | 396150 | 2974.86 | 544 | 530 | 133.0 |
| D | 12 | 227 | 173463 | 1300.37 | 544 | 530 | 133.0 |
| D | 12 | 191 | 168563 | 1263.52 | 544 | 530 | 133.0 |
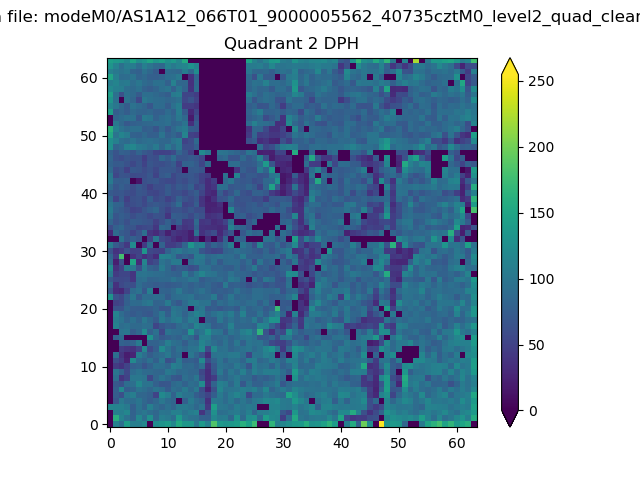
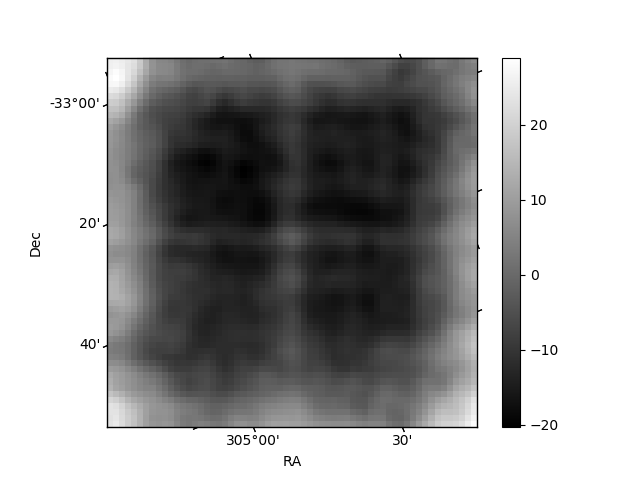
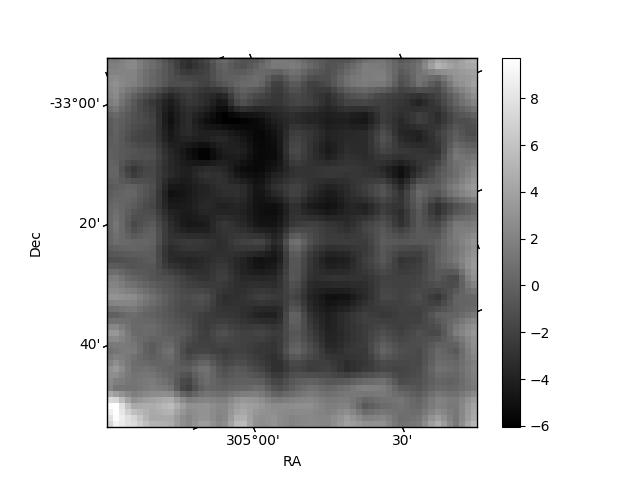
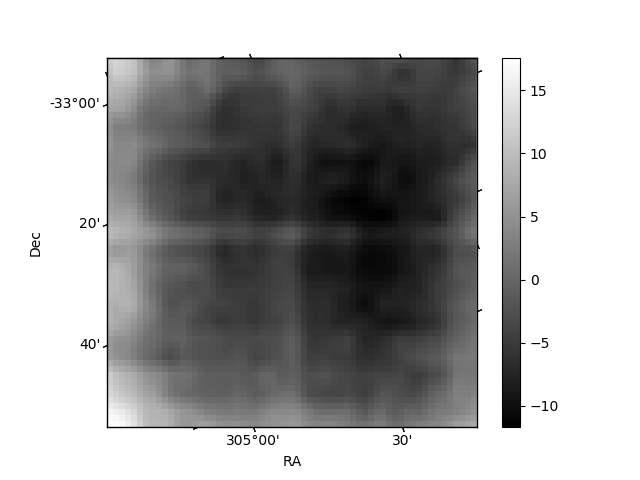
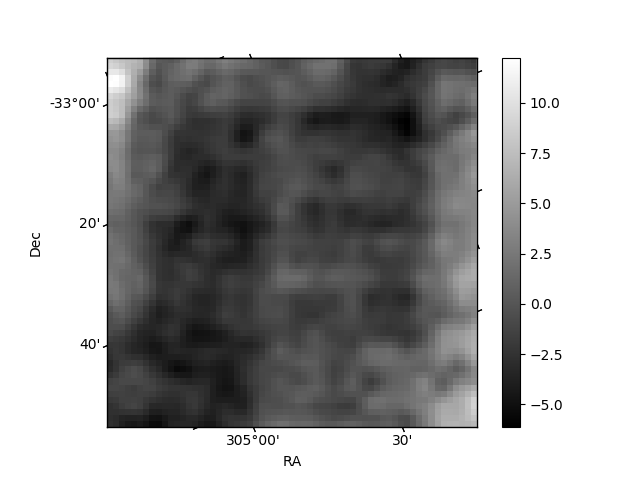
Histogram calculated using DETX and DETY for each event in the final _common_clean file
| Quadrant A | 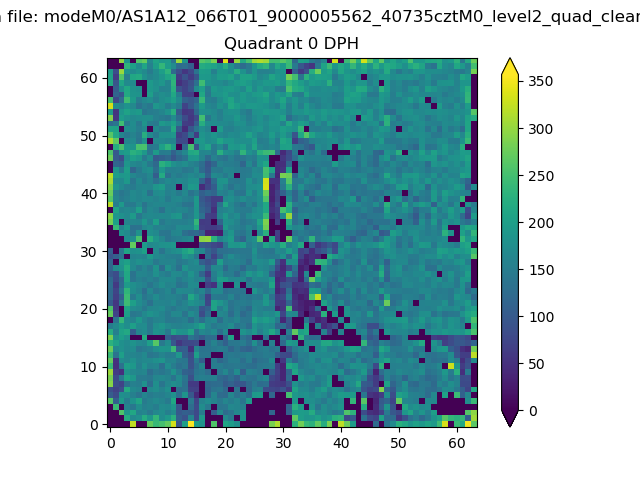 |
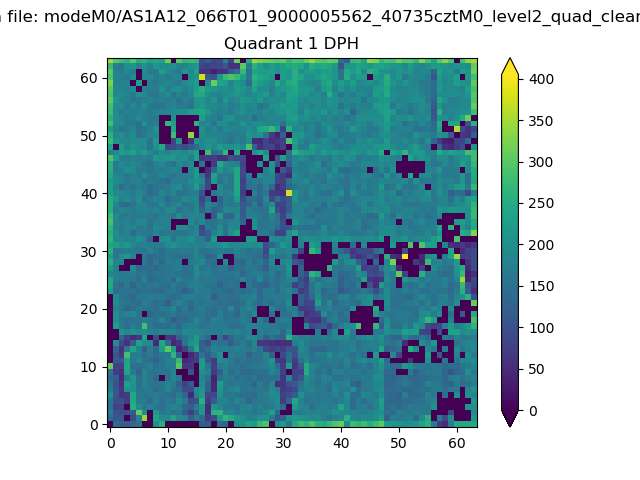 |
Quadrant B |
|---|---|---|---|
| Quadrant D | 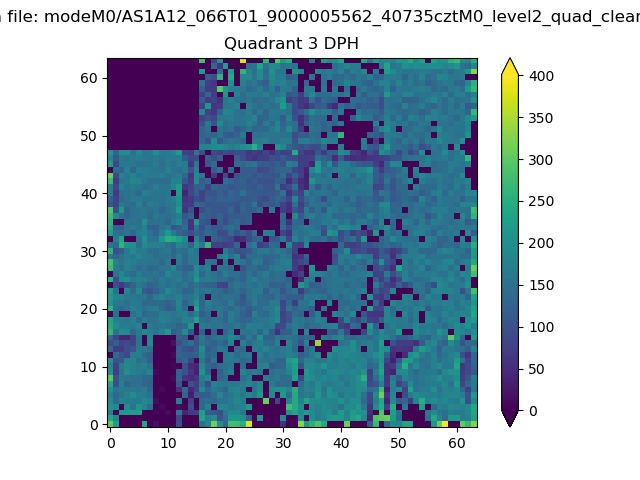 |
 |
Quadrant C |
| Plot type | Count rate plots | Images |
|---|---|---|
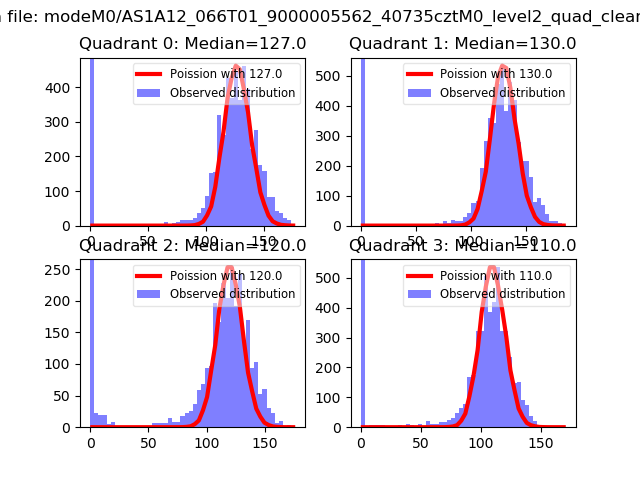
| Comparison with Poisson distribution Blue bars denote a histogram of data divided into 1 sec bins. Red curve is a Poisson curve with rate = median count rate of data. |
 |
 |
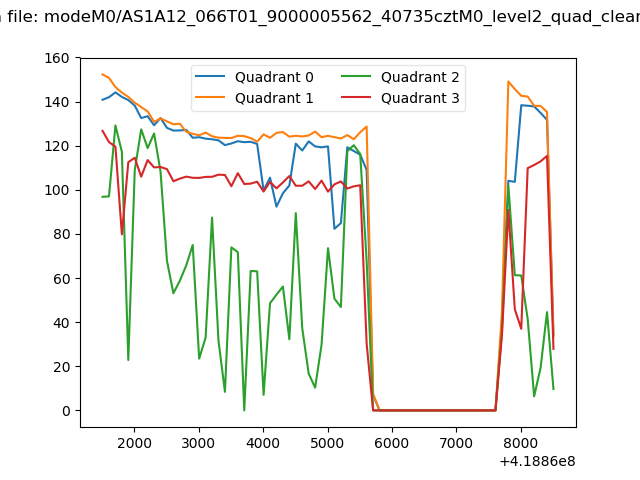
| Quadrant-wise count rates Data is divided into 100 sec bins |
 |
|
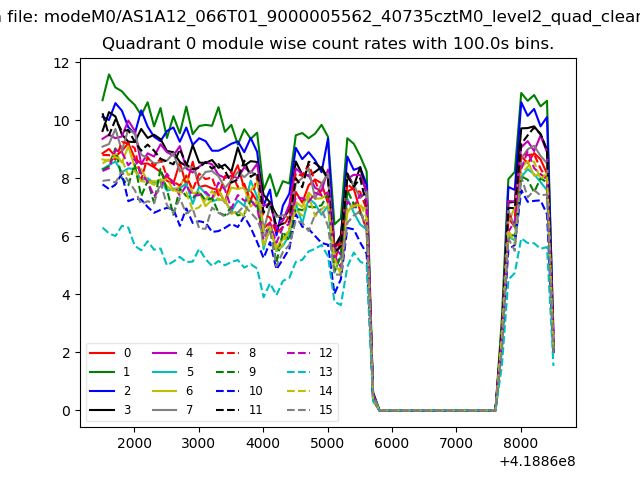
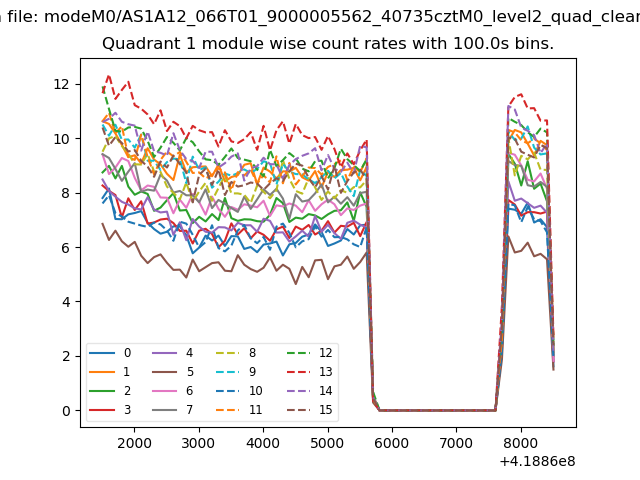
| Module-wise count rates for Quadrant A Data is divided into 100 sec bins |
 |
 |
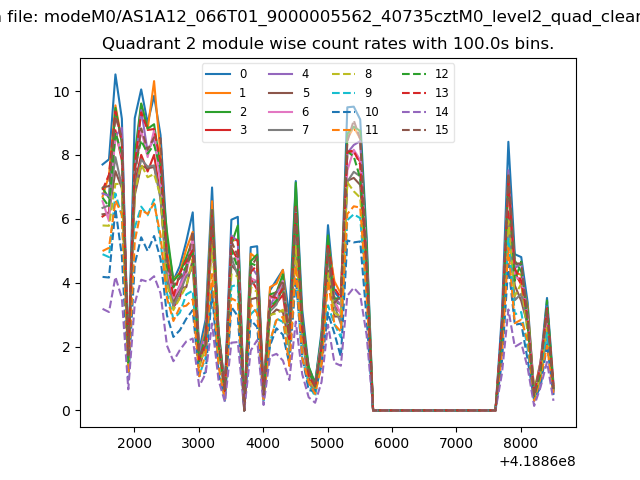
| Module-wise count rates for Quadrant B Data is divided into 100 sec bins |
 |
 |
| Module-wise count rates for Quadrant C Data is divided into 100 sec bins |
 |
 |
| Module-wise count rates for Quadrant D Data is divided into 100 sec bins |
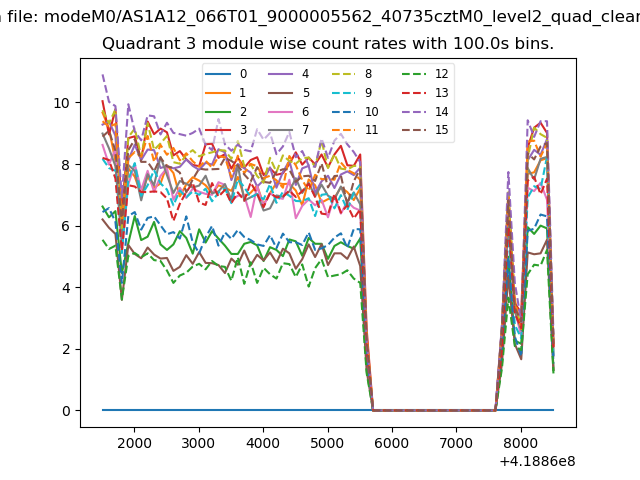 |
 |
| Parameter | Plot |
|---|---|
| CZT HV Monitor | 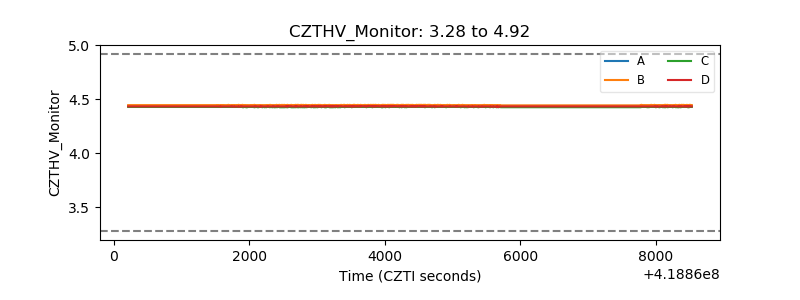 |
| D_VDD | 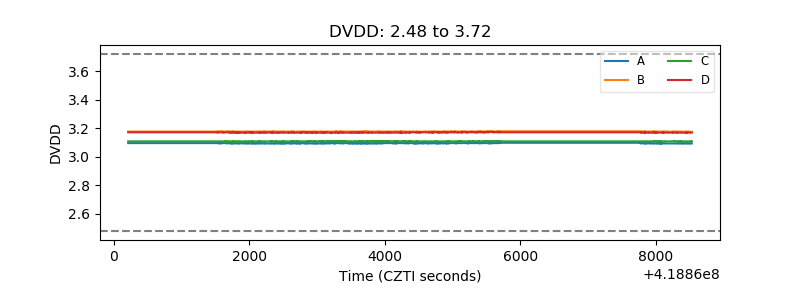 |
| Temperature 1 | 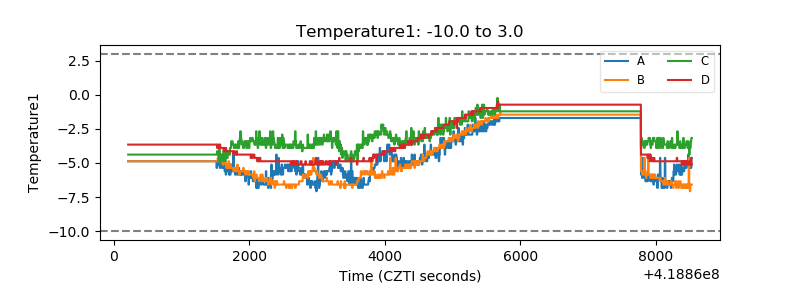 |
| Veto HV Monitor | 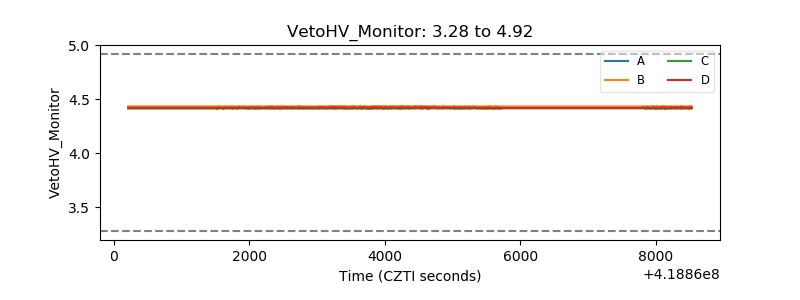 |
| Veto LLD | 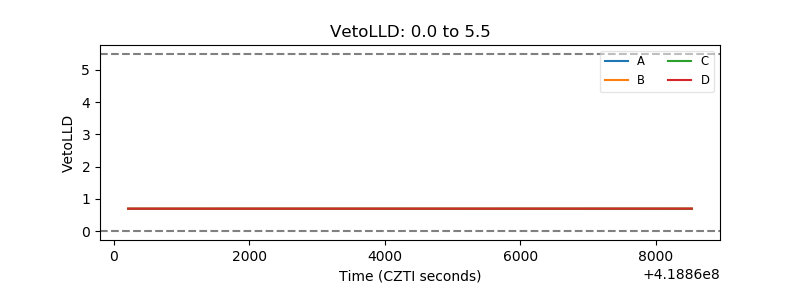 |
| Alpha Counter | 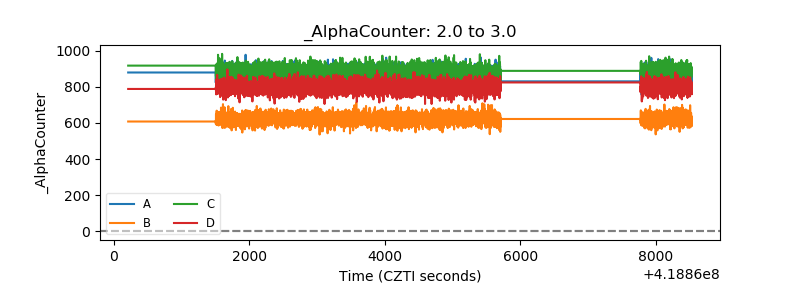 |
| _CPM_Rate | 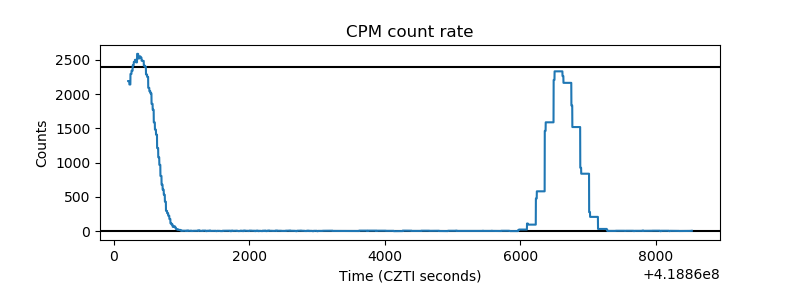 |
| CZT Counter | 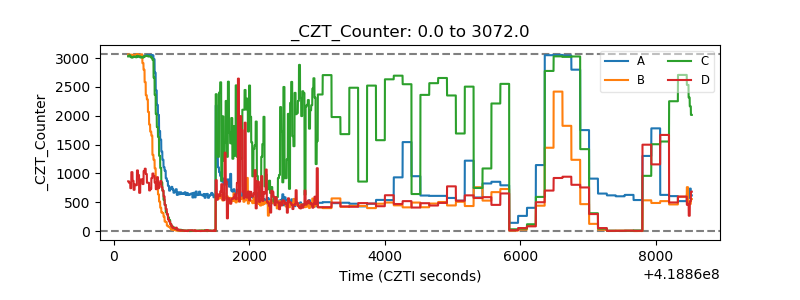 |
| +2.5 Volts monitor | 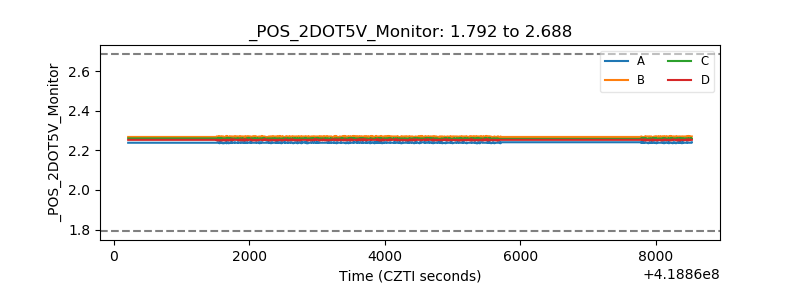 |
| +5 Volts monitor |  |
| _ROLL_ROT | 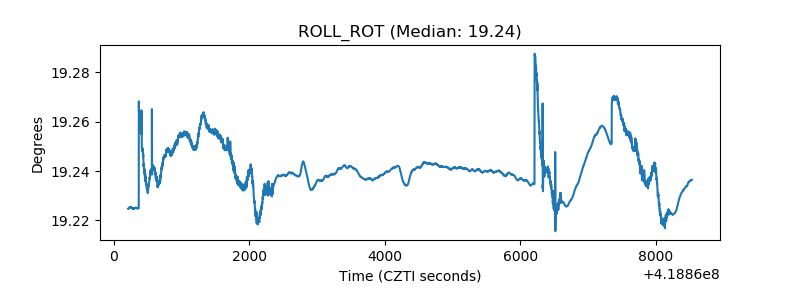 |
| _Roll_DEC | 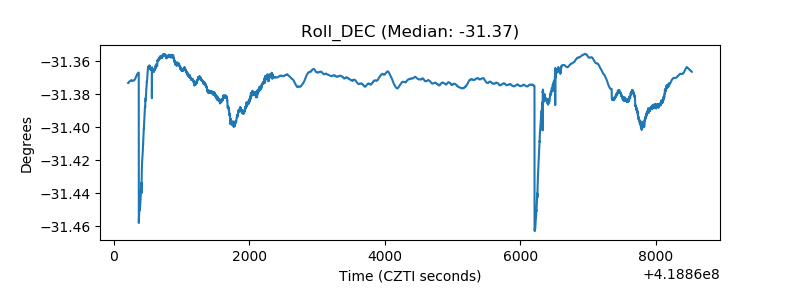 |
| _Roll_RA | 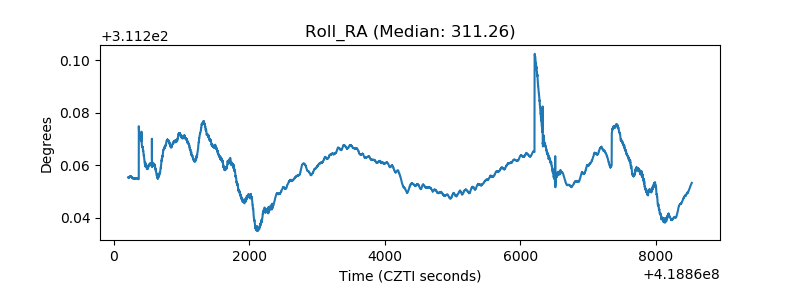 |
| Veto Counter | 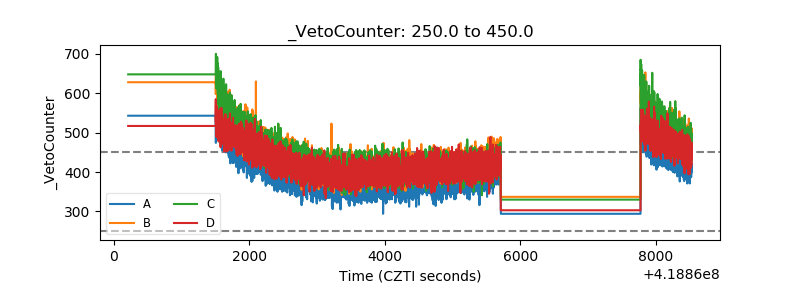 |