| Param | Original file | Final file |
|---|---|---|
| Filename | modeM0/AS1A12_066T01_9000005562_40736cztM0_level2.fits | modeM0/AS1A12_066T01_9000005562_40736cztM0_level2_quad_clean.evt |
| Size (bytes) | 459,224,640 | 83,404,800 |
| Size | 438.0 MB | 79.5 MB |
| Events in quadrant A | 3,067,271 | 617,190 |
| Events in quadrant B | 2,458,516 | 641,793 |
| Events in quadrant C | 7,996,147 | 413,207 |
| Events in quadrant D | 3,089,317 | 503,851 |
| Mode M0 | |||
|---|---|---|---|
| Quadrant | BADHDUFLAG | Total packets | Discarded packets |
| A | 0 | 12184 | 3 |
| B | 0 | 10386 | 2 |
| C | 0 | 27144 | 2 |
| D | 0 | 12453 | 2 |
| Mode M9 | |||
|---|---|---|---|
| Quadrant | BADHDUFLAG | Total packets | Discarded packets |
| A | 0 | 30 | 0 |
| B | 0 | 30 | 0 |
| C | 0 | 30 | 0 |
| D | 0 | 31 | 0 |
| Mode SS | |||
|---|---|---|---|
| Quadrant | BADHDUFLAG | Total packets | Discarded packets |
| A | 0 | 102 | 0 |
| B | 0 | 102 | 0 |
| C | 0 | 102 | 0 |
| D | 0 | 102 | 0 |
| Quadrant | Total seconds | Saturated seconds | Saturation percentage |
|---|---|---|---|
| A | 4979 | 83 | 1.667001% |
| B | 4979 | 13 | 0.261097% |
| C | 4979 | 1960 | 39.365334% |
| D | 4979 | 642 | 12.894155% |
Noise dominated data is calculated using 1-second bins in cleaned event files. If a bin has >2000 counts, and if more than 50% of those come from <1% of pixels, then it is considered to be noise-dominated and hence unusable.
| Quadrant | # 1 sec bins | Bins with >0 counts | Bins with >2000 counts | High rate bins dominated by noise | Noise dominated (total time) | Noise dominated (detector-on time) | Marked lightcurve |
|---|---|---|---|---|---|---|---|
| A | 7072 | 4980 | 78 | 78 | 1.10% | 1.57% | 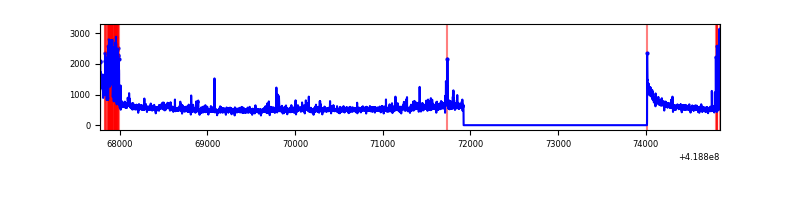 |
| B | 7072 | 4980 | 4 | 4 | 0.06% | 0.08% | 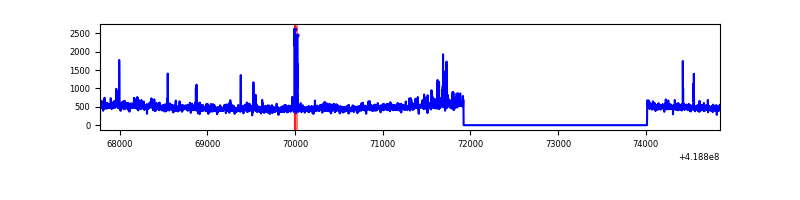 |
| C | 7072 | 4979 | 1922 | 1922 | 27.18% | 38.60% | 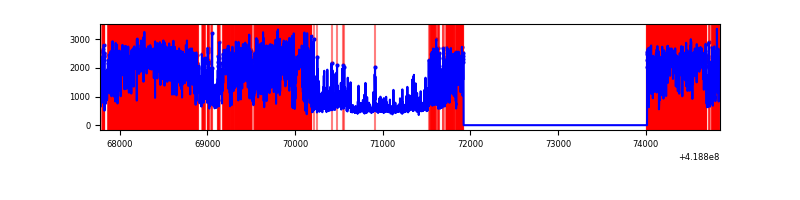 |
| D | 7072 | 4979 | 96 | 96 | 1.36% | 1.93% | 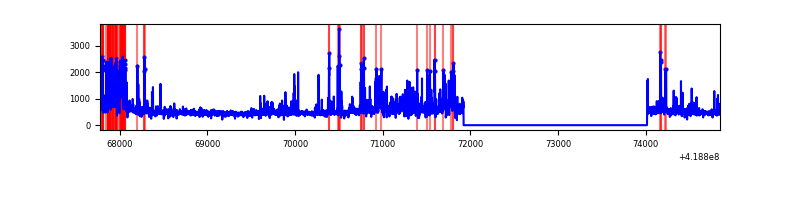 |
Top three noisy pixels from each quadrant. If the there are fewer than three noisy pixels in the level2.evt file, extra rows are filled as -1
| Pixel properties | Quadrant properties | ||||||
|---|---|---|---|---|---|---|---|
| Quadrant | DetID | PixID | Counts | Sigma | Mean | Median | Sigma |
| A | 10 | 83 | 466914 | 3969.97 | 581 | 570 | 117.5 |
| A | 13 | 248 | 247148 | 2099.11 | 581 | 570 | 117.5 |
| A | 12 | 189 | 101897 | 862.59 | 581 | 570 | 117.5 |
| B | 0 | 190 | 48267 | 426.22 | 586 | 571 | 111.9 |
| B | 0 | 229 | 37502 | 330.02 | 586 | 571 | 111.9 |
| B | 5 | 255 | 29169 | 255.56 | 586 | 571 | 111.9 |
| C | 9 | 187 | 5789114 | 49248.54 | 508 | 513 | 117.5 |
| C | 15 | 214 | 186119 | 1579.11 | 508 | 513 | 117.5 |
| C | 14 | 254 | 17792 | 147.01 | 508 | 513 | 117.5 |
| D | 2 | 249 | 268169 | 2008.75 | 546 | 533 | 133.2 |
| D | 12 | 191 | 168922 | 1263.85 | 546 | 533 | 133.2 |
| D | 1 | 47 | 144832 | 1083.04 | 546 | 533 | 133.2 |
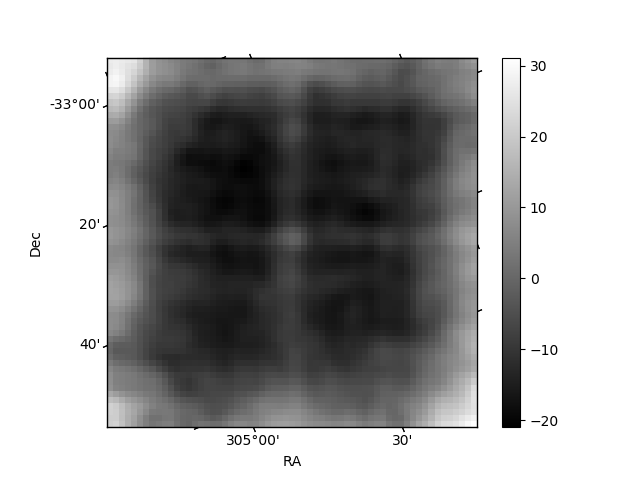
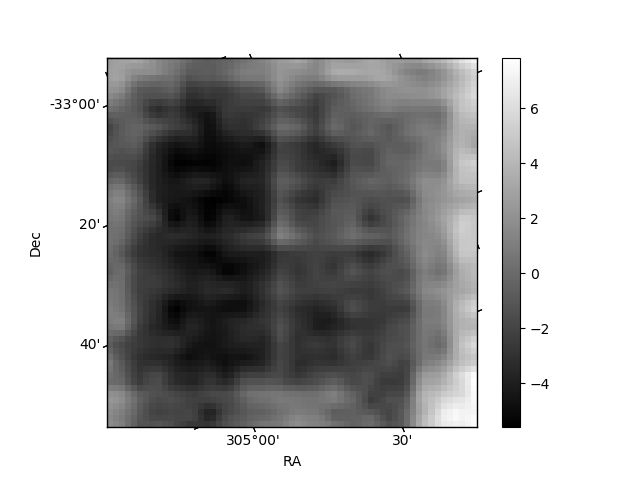
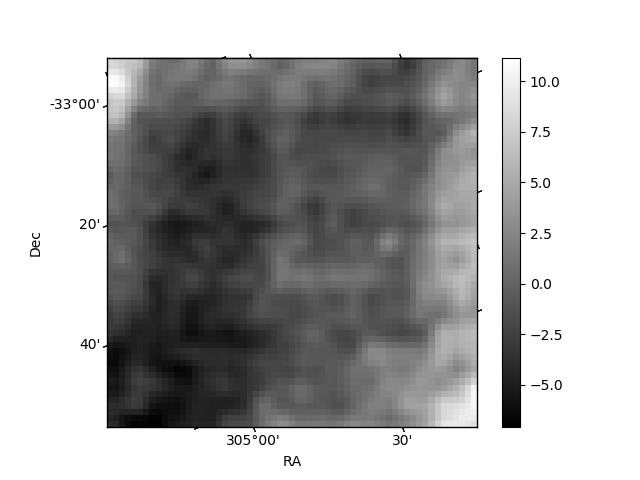
Histogram calculated using DETX and DETY for each event in the final _common_clean file
| Quadrant A | 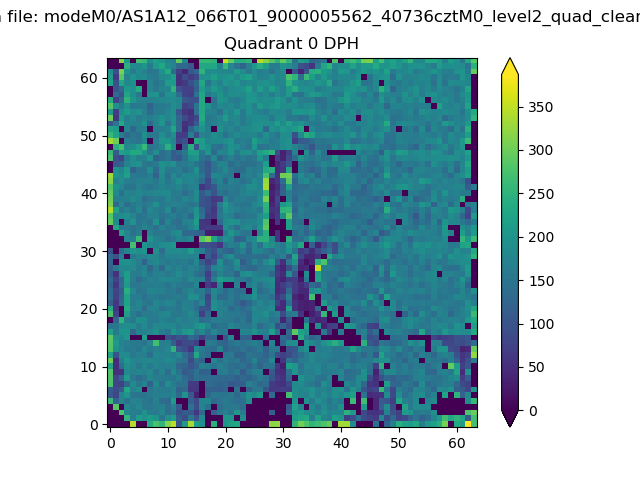 |
 |
Quadrant B |
|---|---|---|---|
| Quadrant D | 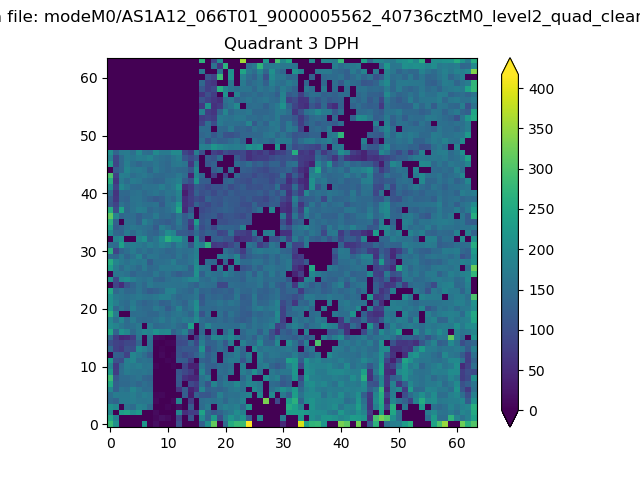 |
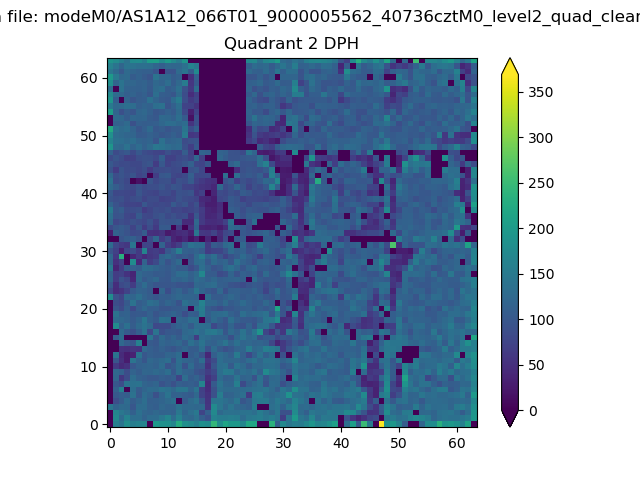 |
Quadrant C |
| Plot type | Count rate plots | Images |
|---|---|---|
| Comparison with Poisson distribution Blue bars denote a histogram of data divided into 1 sec bins. Red curve is a Poisson curve with rate = median count rate of data. |
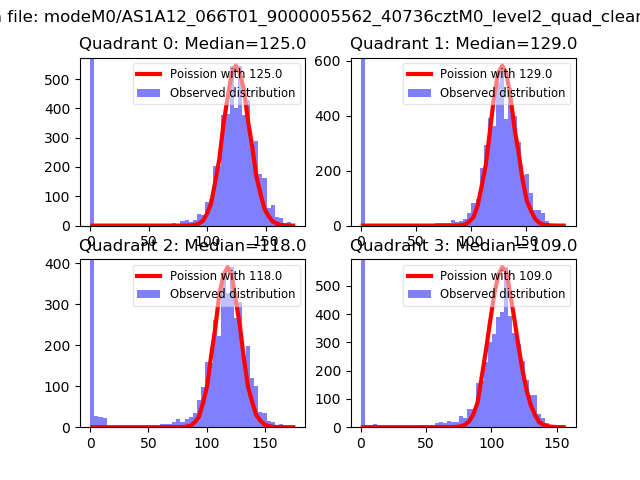 |
 |
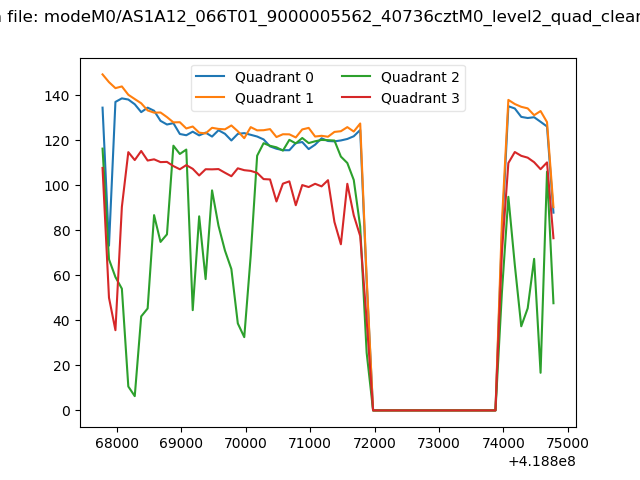
| Quadrant-wise count rates Data is divided into 100 sec bins |
 |
|
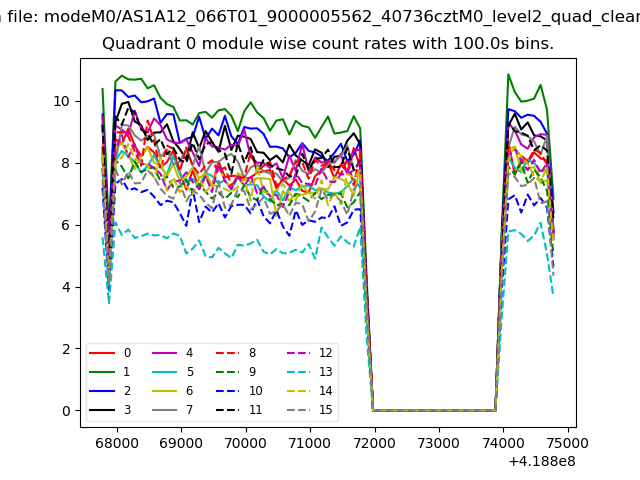
| Module-wise count rates for Quadrant A Data is divided into 100 sec bins |
 |
 |
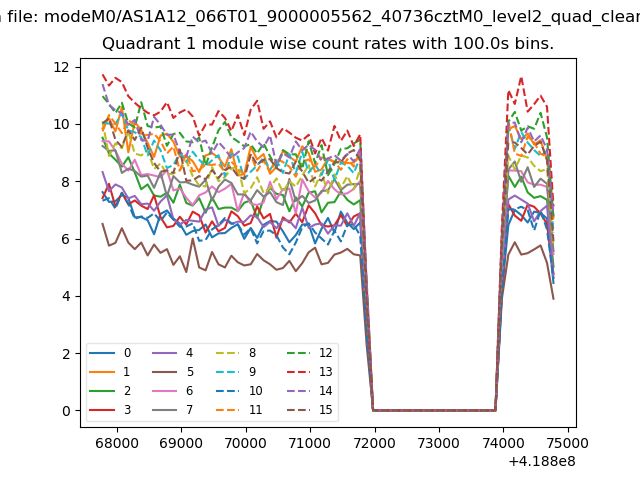
| Module-wise count rates for Quadrant B Data is divided into 100 sec bins |
 |
 |
| Module-wise count rates for Quadrant C Data is divided into 100 sec bins |
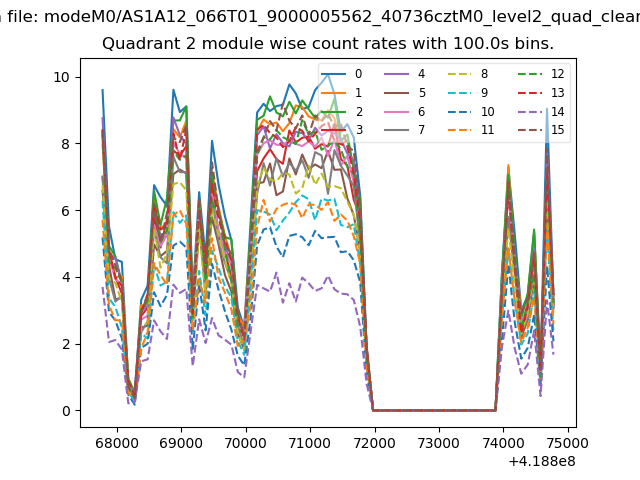 |
 |
| Module-wise count rates for Quadrant D Data is divided into 100 sec bins |
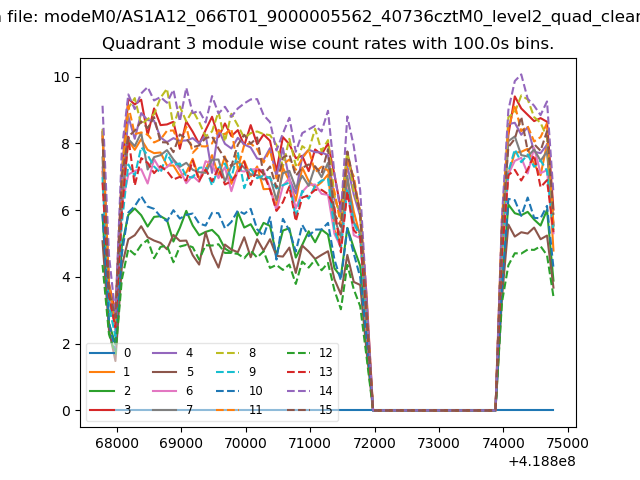 |
 |
| Parameter | Plot |
|---|---|
| CZT HV Monitor | 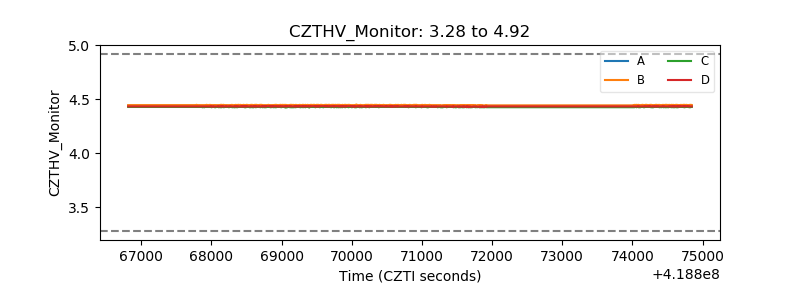 |
| D_VDD | 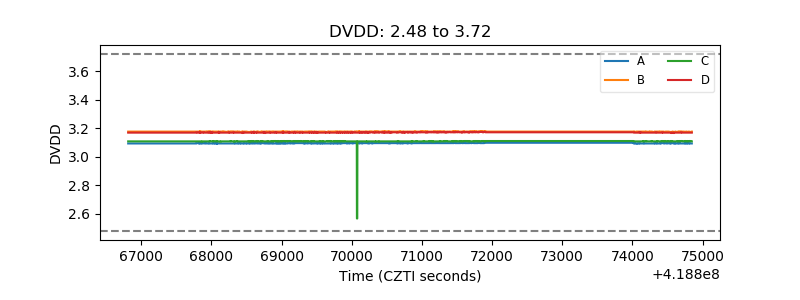 |
| Temperature 1 | 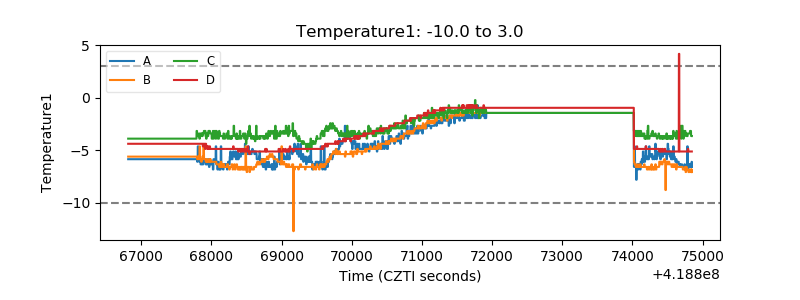 |
| Veto HV Monitor | 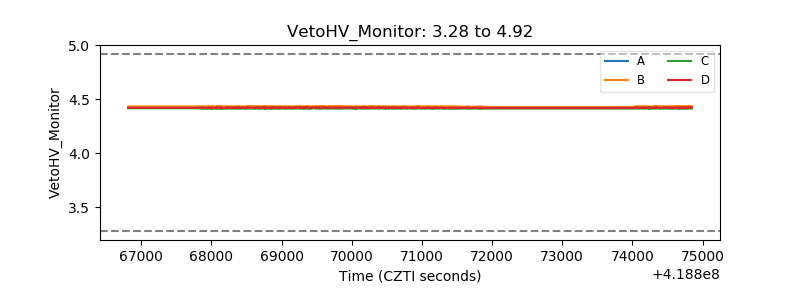 |
| Veto LLD | 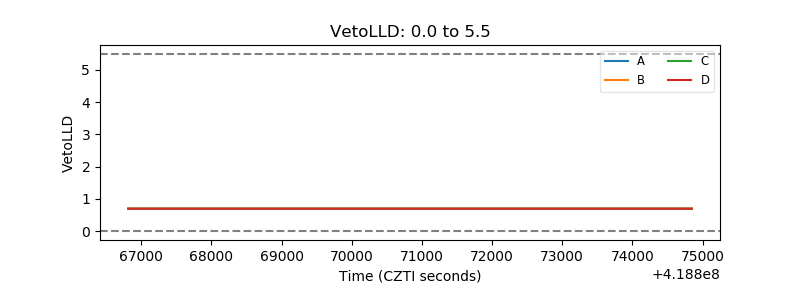 |
| Alpha Counter | 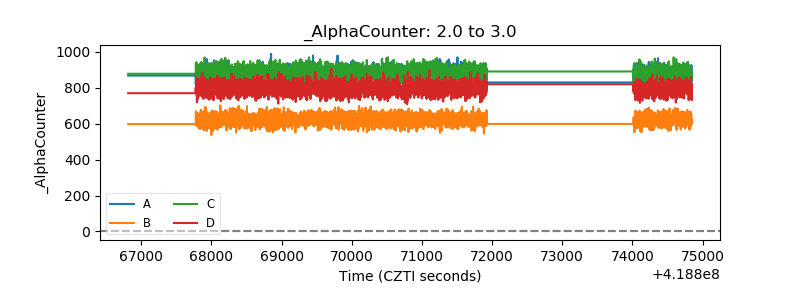 |
| _CPM_Rate | 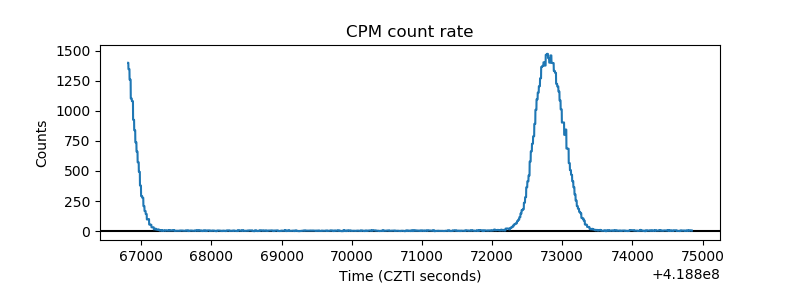 |
| CZT Counter | 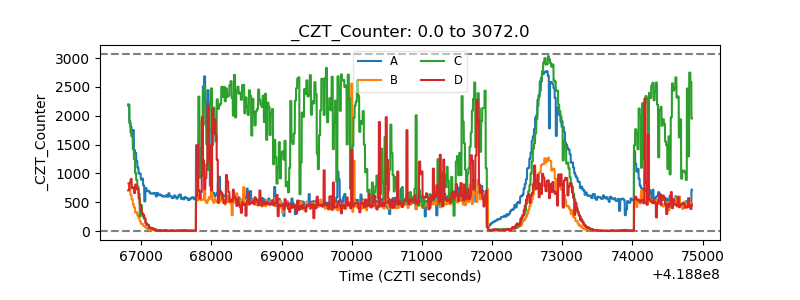 |
| +2.5 Volts monitor | 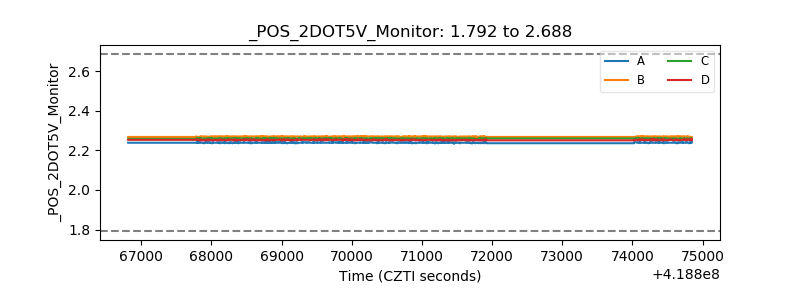 |
| +5 Volts monitor | 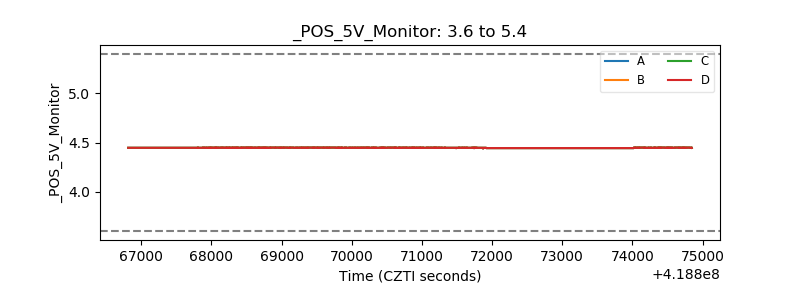 |
| _ROLL_ROT | 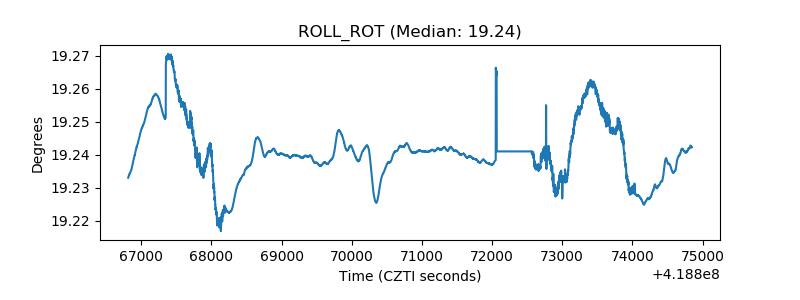 |
| _Roll_DEC | 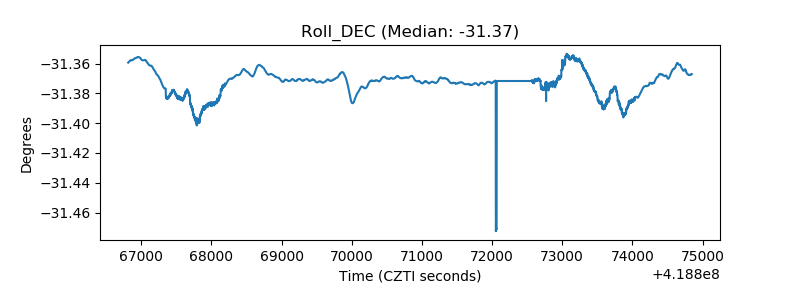 |
| _Roll_RA | 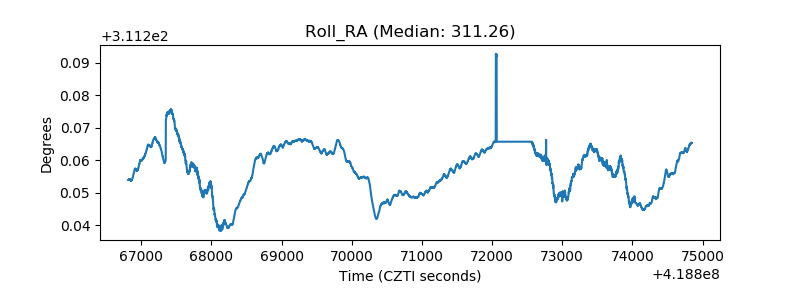 |
| Veto Counter | 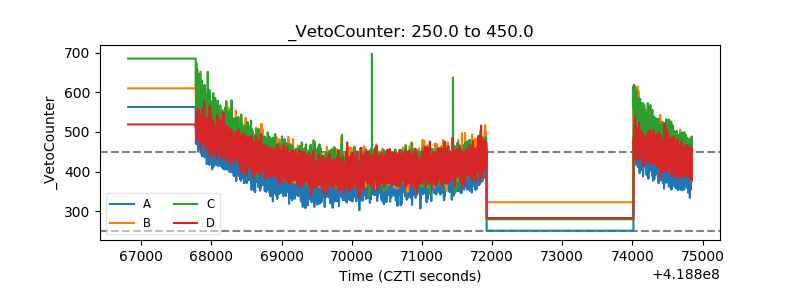 |