| Param | Original file | Final file |
|---|---|---|
| Filename | modeM0/AS1A12_066T01_9000005562_40737cztM0_level2.fits | modeM0/AS1A12_066T01_9000005562_40737cztM0_level2_quad_clean.evt |
| Size (bytes) | 488,165,760 | 76,766,400 |
| Size | 465.6 MB | 73.2 MB |
| Events in quadrant A | 2,790,620 | 588,606 |
| Events in quadrant B | 2,316,594 | 607,645 |
| Events in quadrant C | 9,652,877 | 289,510 |
| Events in quadrant D | 2,925,474 | 492,501 |
| Mode M0 | |||
|---|---|---|---|
| Quadrant | BADHDUFLAG | Total packets | Discarded packets |
| A | 0 | 11310 | 3 |
| B | 0 | 10122 | 2 |
| C | 0 | 32077 | 2 |
| D | 0 | 12007 | 2 |
| Mode M9 | |||
|---|---|---|---|
| Quadrant | BADHDUFLAG | Total packets | Discarded packets |
| A | 0 | 35 | 0 |
| B | 0 | 35 | 0 |
| C | 0 | 35 | 0 |
| D | 0 | 36 | 0 |
| Mode SS | |||
|---|---|---|---|
| Quadrant | BADHDUFLAG | Total packets | Discarded packets |
| A | 0 | 100 | 0 |
| B | 0 | 100 | 0 |
| C | 0 | 100 | 0 |
| D | 0 | 100 | 0 |
| Quadrant | Total seconds | Saturated seconds | Saturation percentage |
|---|---|---|---|
| A | 4935 | 36 | 0.729483% |
| B | 4935 | 10 | 0.202634% |
| C | 4935 | 2895 | 58.662614% |
| D | 4935 | 512 | 10.374873% |
Noise dominated data is calculated using 1-second bins in cleaned event files. If a bin has >2000 counts, and if more than 50% of those come from <1% of pixels, then it is considered to be noise-dominated and hence unusable.
| Quadrant | # 1 sec bins | Bins with >0 counts | Bins with >2000 counts | High rate bins dominated by noise | Noise dominated (total time) | Noise dominated (detector-on time) | Marked lightcurve |
|---|---|---|---|---|---|---|---|
| A | 7058 | 4936 | 27 | 27 | 0.38% | 0.55% | 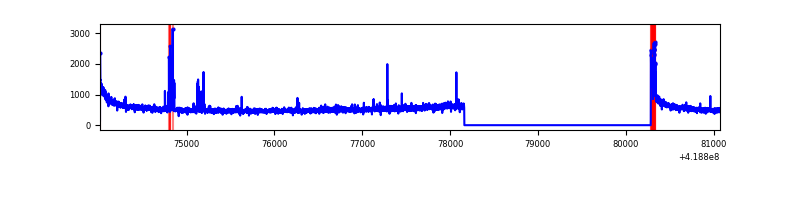 |
| B | 7058 | 4936 | 2 | 2 | 0.03% | 0.04% | 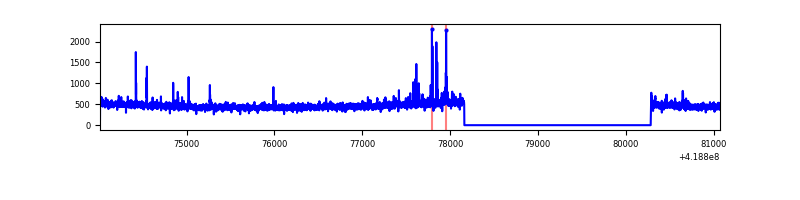 |
| C | 7058 | 4936 | 2769 | 2769 | 39.23% | 56.10% | 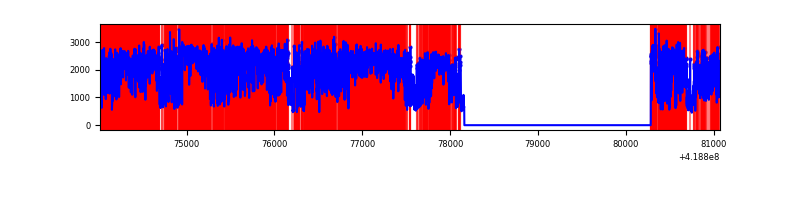 |
| D | 7058 | 4936 | 123 | 123 | 1.74% | 2.49% | 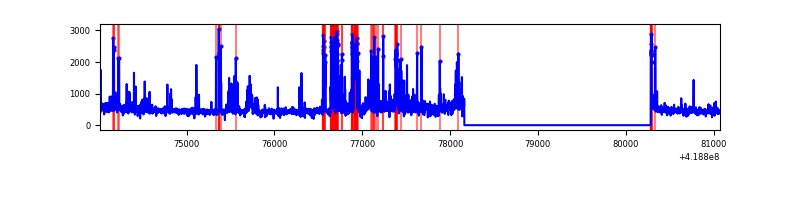 |
Top three noisy pixels from each quadrant. If the there are fewer than three noisy pixels in the level2.evt file, extra rows are filled as -1
| Pixel properties | Quadrant properties | ||||||
|---|---|---|---|---|---|---|---|
| Quadrant | DetID | PixID | Counts | Sigma | Mean | Median | Sigma |
| A | 10 | 83 | 460910 | 3974.2 | 563 | 552 | 115.8 |
| A | 13 | 248 | 107953 | 927.18 | 563 | 552 | 115.8 |
| A | 12 | 189 | 32973 | 279.89 | 563 | 552 | 115.8 |
| B | 0 | 190 | 49029 | 446.22 | 563 | 546 | 108.7 |
| B | 0 | 229 | 22381 | 200.96 | 563 | 546 | 108.7 |
| B | 12 | 111 | 13340 | 117.75 | 563 | 546 | 108.7 |
| C | 9 | 187 | 7639574 | 76124.92 | 432 | 435 | 100.4 |
| C | 15 | 214 | 164230 | 1632.24 | 432 | 435 | 100.4 |
| C | 14 | 254 | 118689 | 1178.42 | 432 | 435 | 100.4 |
| D | 12 | 227 | 297795 | 2298.73 | 530 | 516 | 129.3 |
| D | 2 | 249 | 153706 | 1184.55 | 530 | 516 | 129.3 |
| D | 12 | 191 | 142170 | 1095.35 | 530 | 516 | 129.3 |
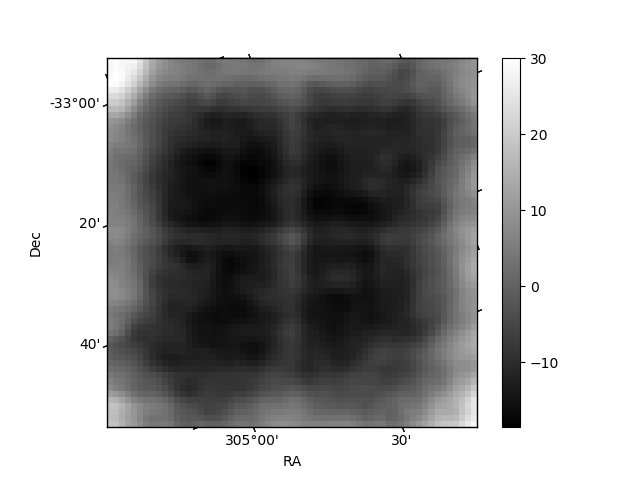
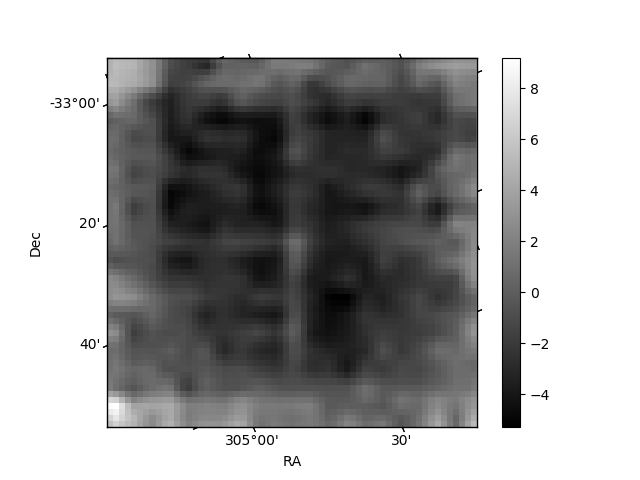
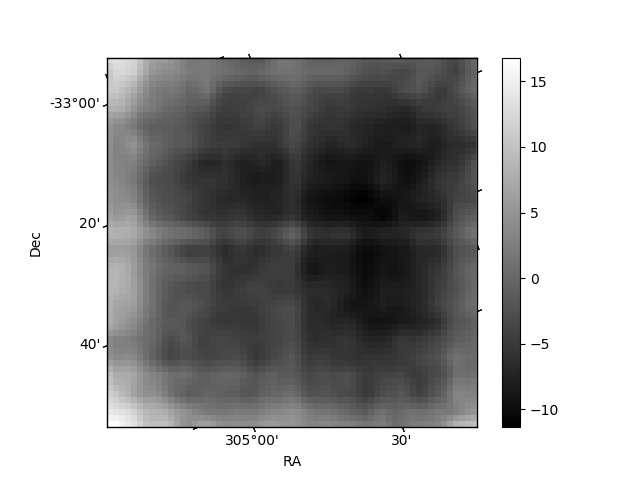
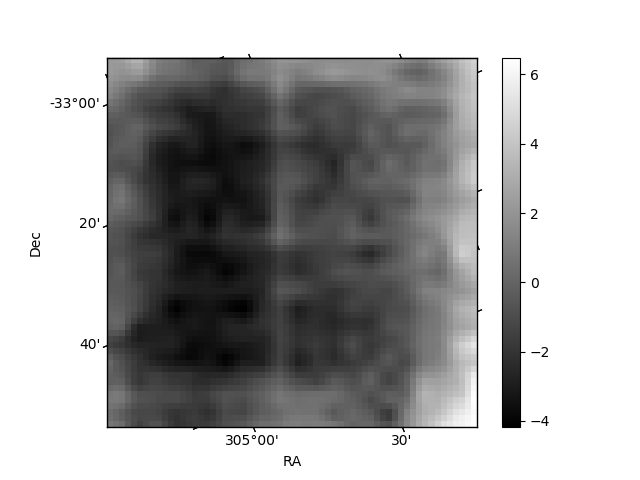
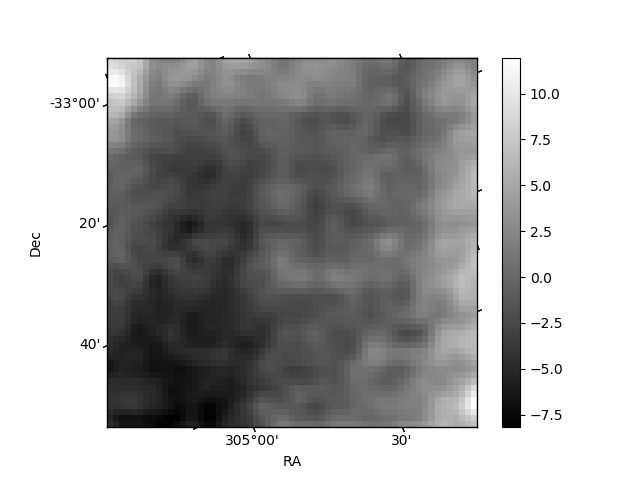
Histogram calculated using DETX and DETY for each event in the final _common_clean file
| Quadrant A | 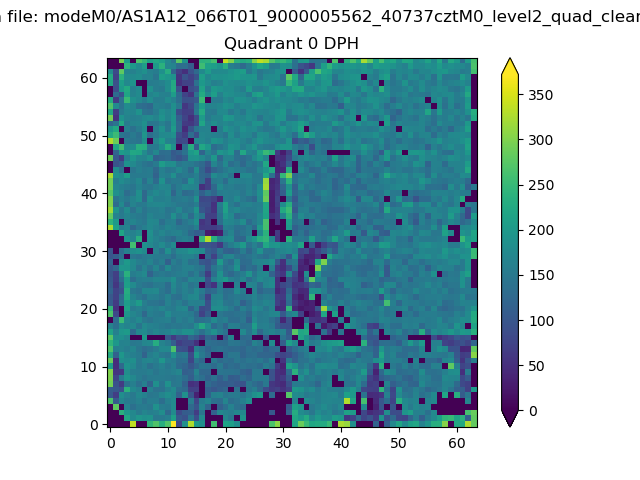 |
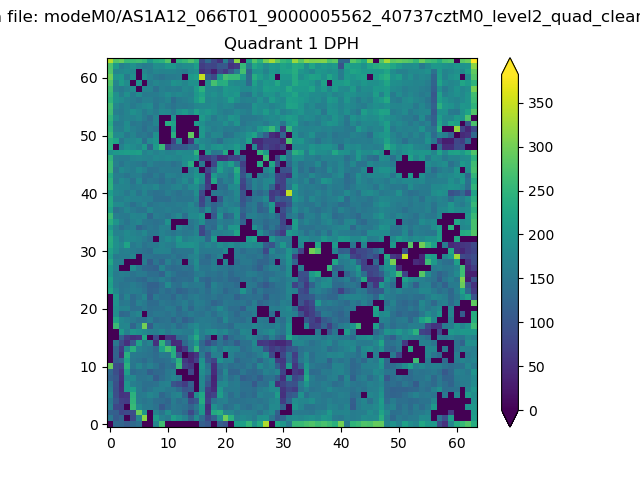 |
Quadrant B |
|---|---|---|---|
| Quadrant D | 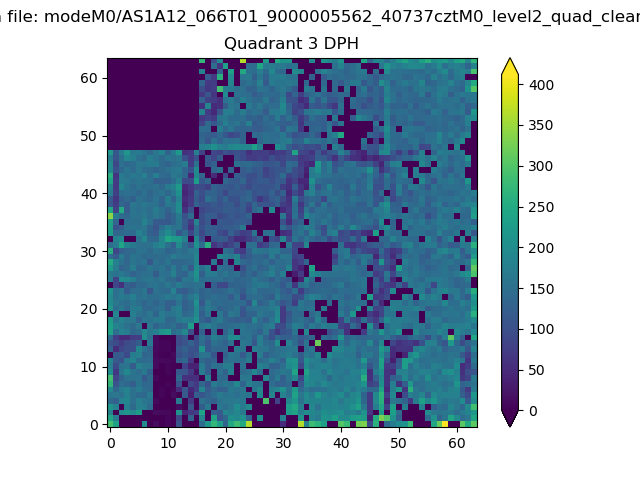 |
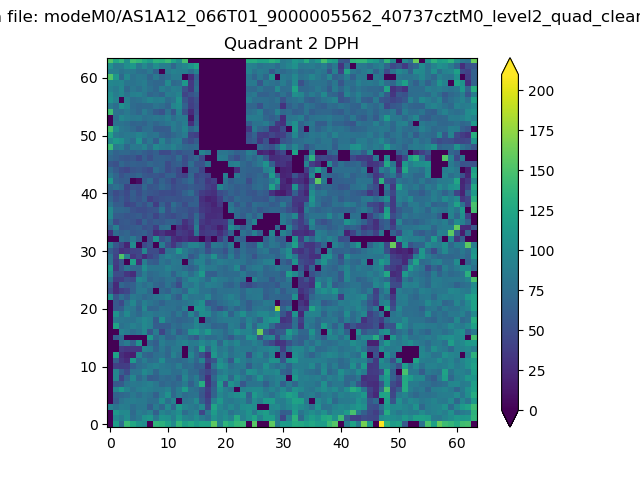 |
Quadrant C |
| Plot type | Count rate plots | Images |
|---|---|---|
| Comparison with Poisson distribution Blue bars denote a histogram of data divided into 1 sec bins. Red curve is a Poisson curve with rate = median count rate of data. |
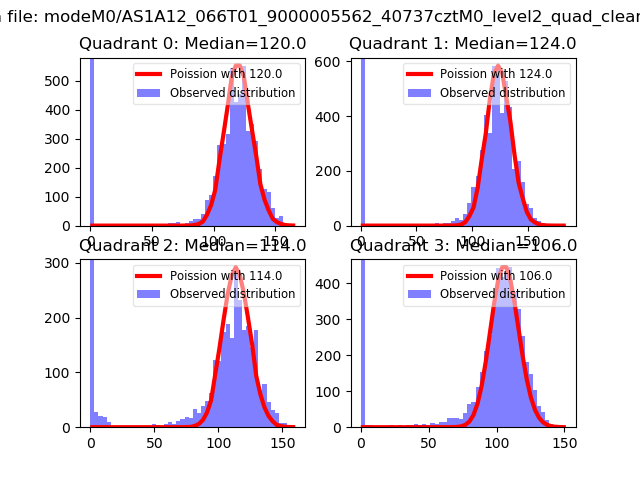 |
 |
| Quadrant-wise count rates Data is divided into 100 sec bins |
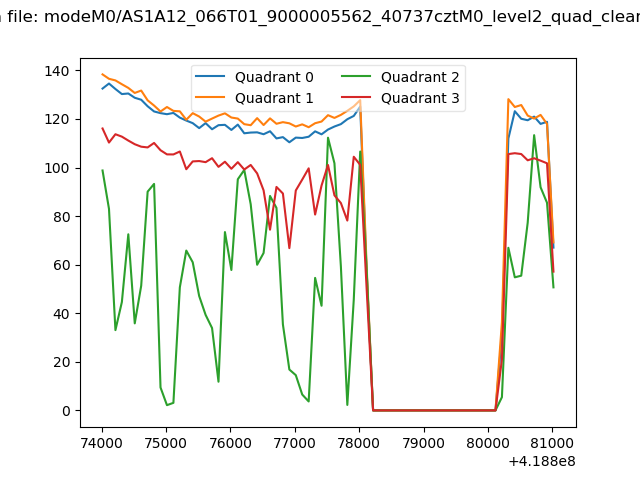 |
|
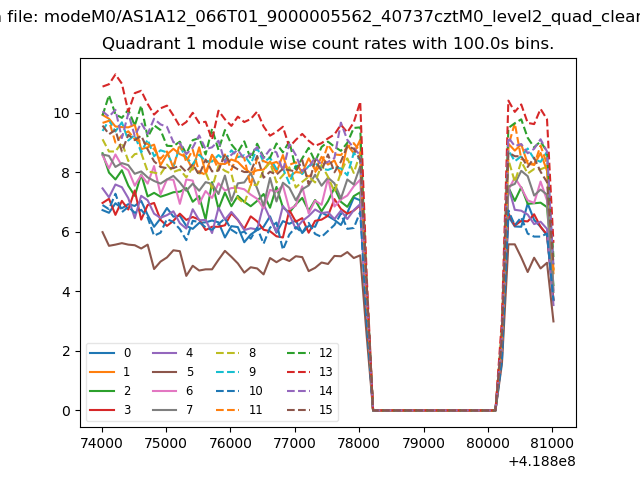
| Module-wise count rates for Quadrant A Data is divided into 100 sec bins |
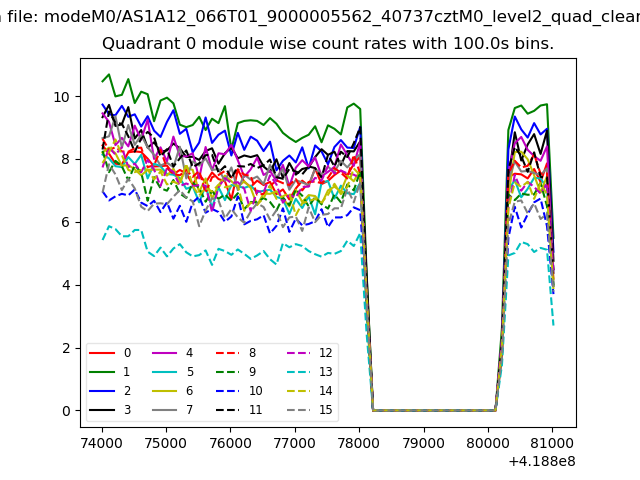 |
 |
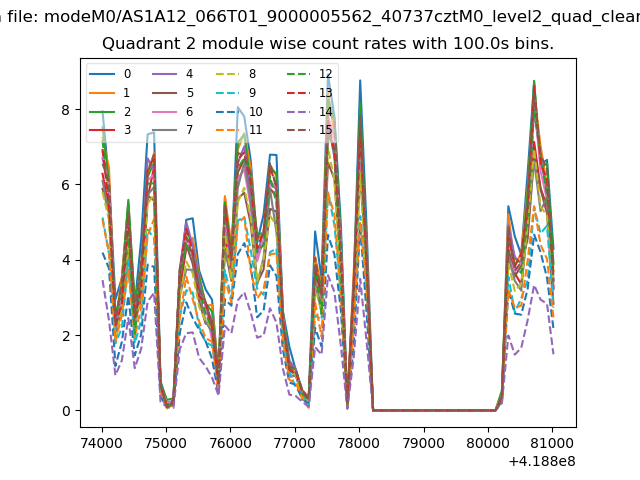
| Module-wise count rates for Quadrant B Data is divided into 100 sec bins |
 |
 |
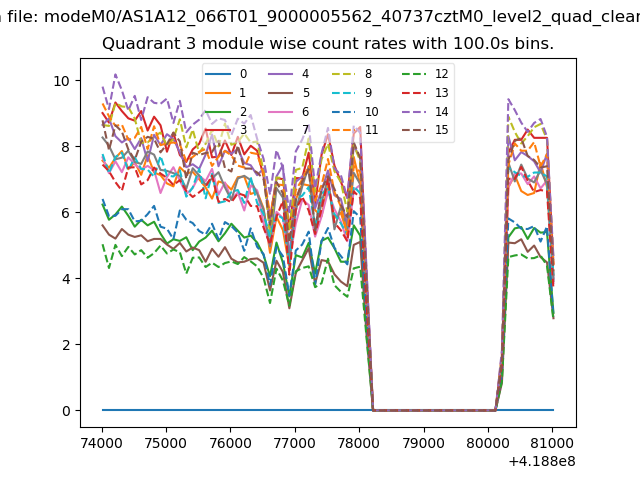
| Module-wise count rates for Quadrant C Data is divided into 100 sec bins |
 |
 |
| Module-wise count rates for Quadrant D Data is divided into 100 sec bins |
 |
 |
| Parameter | Plot |
|---|---|
| CZT HV Monitor | 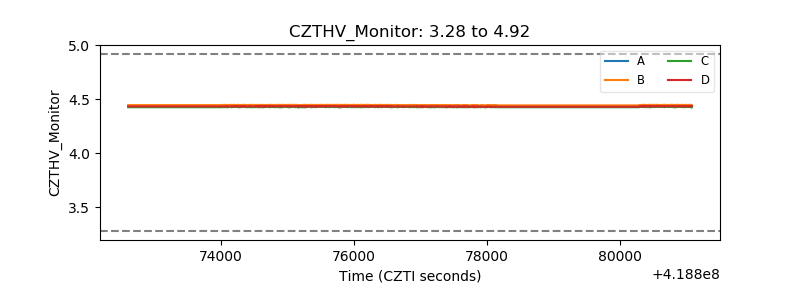 |
| D_VDD |  |
| Temperature 1 | 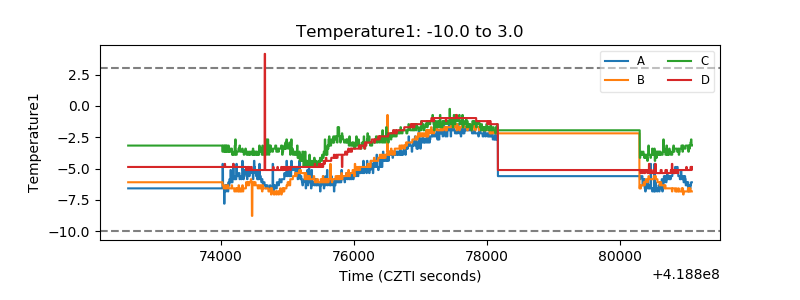 |
| Veto HV Monitor | 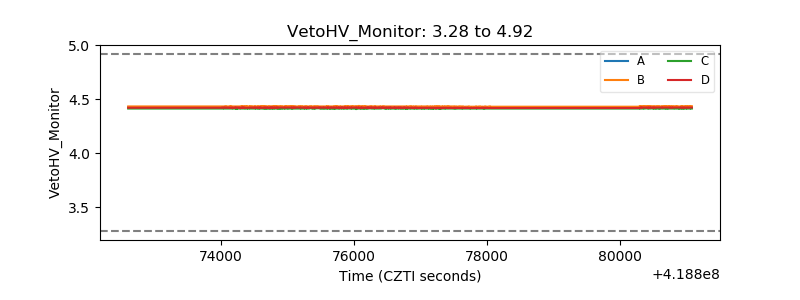 |
| Veto LLD | 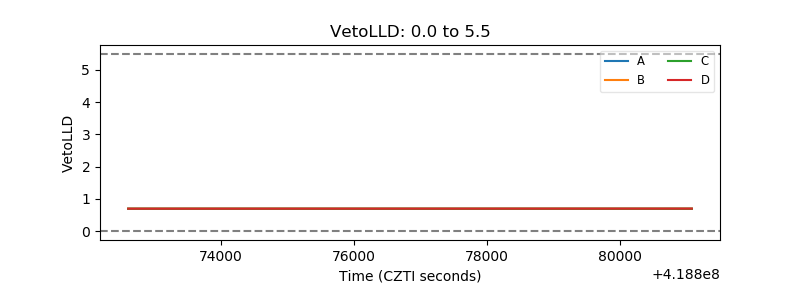 |
| Alpha Counter | 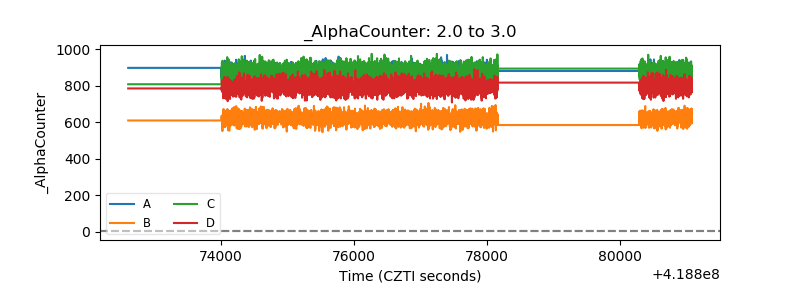 |
| _CPM_Rate | 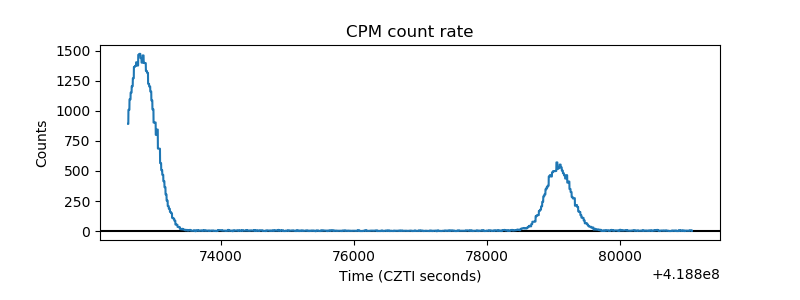 |
| CZT Counter | 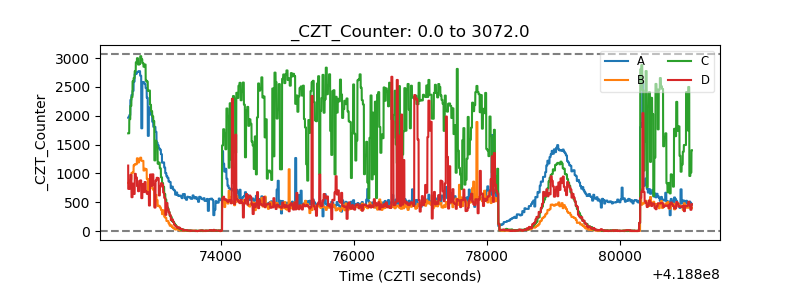 |
| +2.5 Volts monitor | 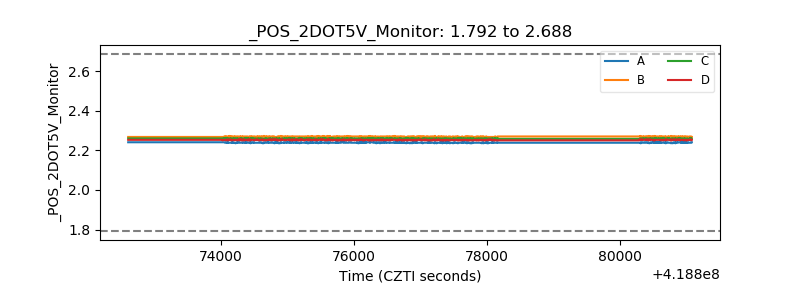 |
| +5 Volts monitor | 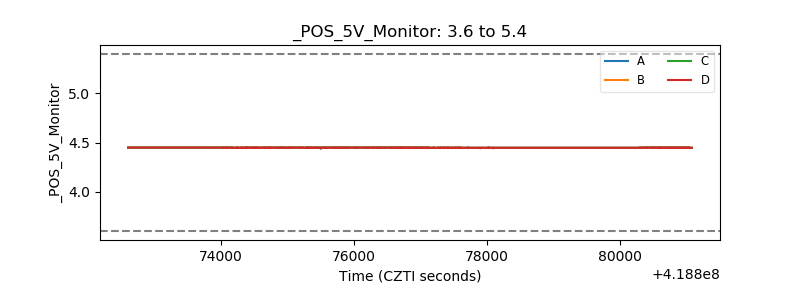 |
| _ROLL_ROT | 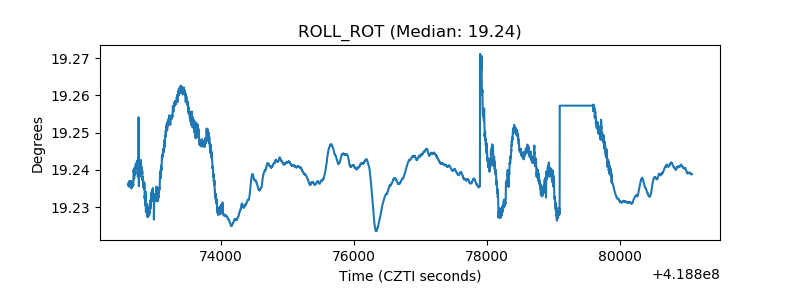 |
| _Roll_DEC | 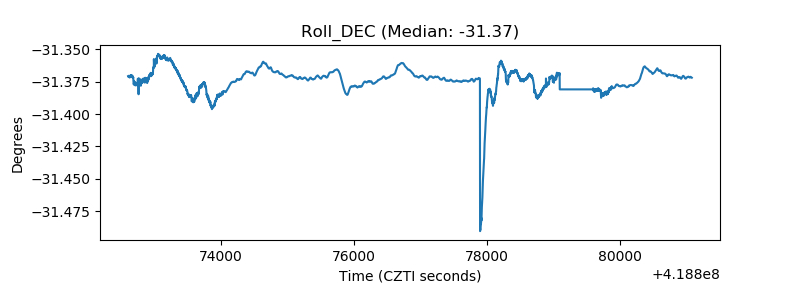 |
| _Roll_RA | 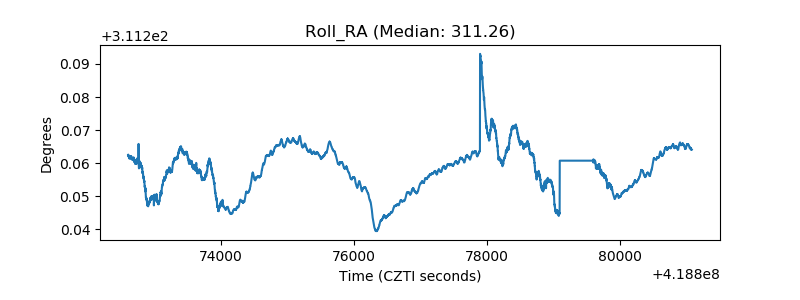 |
| Veto Counter | 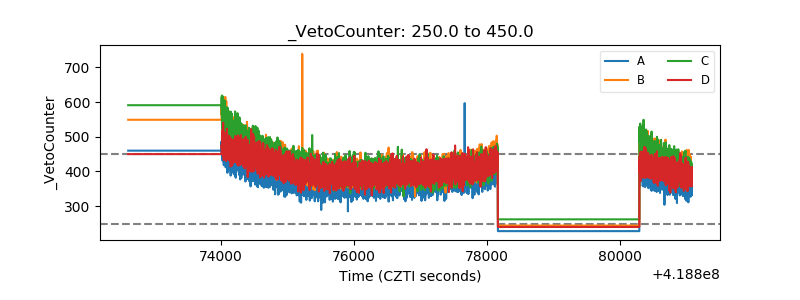 |