| Param | Original file | Final file |
|---|---|---|
| Filename | modeM0/AS1A12_066T01_9000005562_40738cztM0_level2.fits | modeM0/AS1A12_066T01_9000005562_40738cztM0_level2_quad_clean.evt |
| Size (bytes) | 498,778,560 | 73,465,920 |
| Size | 475.7 MB | 70.1 MB |
| Events in quadrant A | 2,780,627 | 577,269 |
| Events in quadrant B | 2,449,239 | 588,656 |
| Events in quadrant C | 9,945,805 | 256,734 |
| Events in quadrant D | 2,893,830 | 447,512 |
| Mode M0 | |||
|---|---|---|---|
| Quadrant | BADHDUFLAG | Total packets | Discarded packets |
| A | 0 | 11260 | 3 |
| B | 0 | 10817 | 2 |
| C | 0 | 32995 | 2 |
| D | 0 | 12211 | 2 |
| Mode M9 | |||
|---|---|---|---|
| Quadrant | BADHDUFLAG | Total packets | Discarded packets |
| A | 0 | 26 | 0 |
| B | 0 | 26 | 0 |
| C | 0 | 26 | 0 |
| D | 0 | 27 | 0 |
| Mode SS | |||
|---|---|---|---|
| Quadrant | BADHDUFLAG | Total packets | Discarded packets |
| A | 0 | 104 | 0 |
| B | 0 | 104 | 0 |
| C | 0 | 104 | 0 |
| D | 0 | 104 | 0 |
| Quadrant | Total seconds | Saturated seconds | Saturation percentage |
|---|---|---|---|
| A | 5047 | 26 | 0.515158% |
| B | 5047 | 33 | 0.653854% |
| C | 5047 | 3069 | 60.808401% |
| D | 5047 | 866 | 17.158708% |
Noise dominated data is calculated using 1-second bins in cleaned event files. If a bin has >2000 counts, and if more than 50% of those come from <1% of pixels, then it is considered to be noise-dominated and hence unusable.
| Quadrant | # 1 sec bins | Bins with >0 counts | Bins with >2000 counts | High rate bins dominated by noise | Noise dominated (total time) | Noise dominated (detector-on time) | Marked lightcurve |
|---|---|---|---|---|---|---|---|
| A | 7080 | 5048 | 23 | 23 | 0.32% | 0.46% | 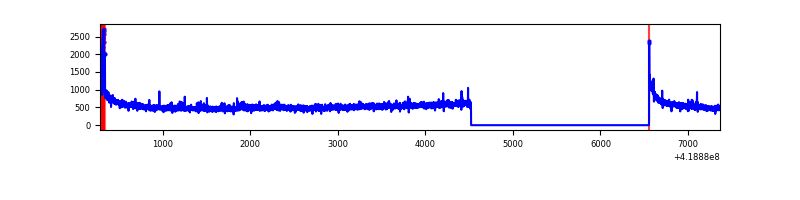 |
| B | 7080 | 5048 | 10 | 10 | 0.14% | 0.20% | 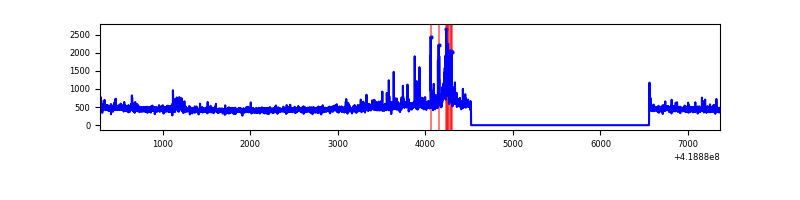 |
| C | 7080 | 5048 | 2987 | 2987 | 42.19% | 59.17% | 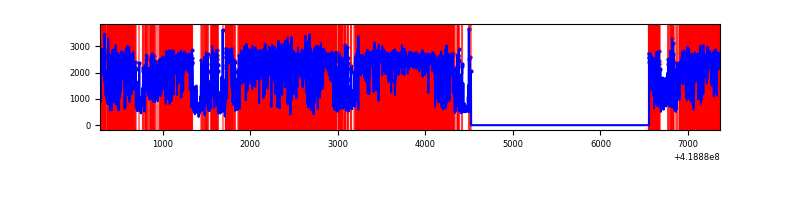 |
| D | 7080 | 5048 | 56 | 56 | 0.79% | 1.11% | 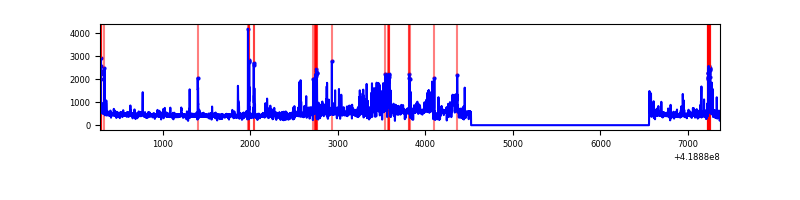 |
Top three noisy pixels from each quadrant. If the there are fewer than three noisy pixels in the level2.evt file, extra rows are filled as -1
| Pixel properties | Quadrant properties | ||||||
|---|---|---|---|---|---|---|---|
| Quadrant | DetID | PixID | Counts | Sigma | Mean | Median | Sigma |
| A | 10 | 83 | 493547 | 4265.92 | 563 | 551 | 115.6 |
| A | 13 | 248 | 52895 | 452.93 | 563 | 551 | 115.6 |
| A | 12 | 189 | 45286 | 387.09 | 563 | 551 | 115.6 |
| B | 0 | 229 | 57876 | 527.93 | 561 | 545 | 108.6 |
| B | 0 | 190 | 51645 | 470.55 | 561 | 545 | 108.6 |
| B | 5 | 32 | 49273 | 448.71 | 561 | 545 | 108.6 |
| C | 9 | 187 | 8235078 | 91741.36 | 380 | 382 | 89.8 |
| C | 15 | 214 | 153918 | 1710.52 | 380 | 382 | 89.8 |
| C | 14 | 254 | 62375 | 690.65 | 380 | 382 | 89.8 |
| D | 12 | 191 | 198831 | 1597.38 | 505 | 492 | 124.2 |
| D | 2 | 249 | 183887 | 1477.03 | 505 | 492 | 124.2 |
| D | 1 | 47 | 145995 | 1171.85 | 505 | 492 | 124.2 |
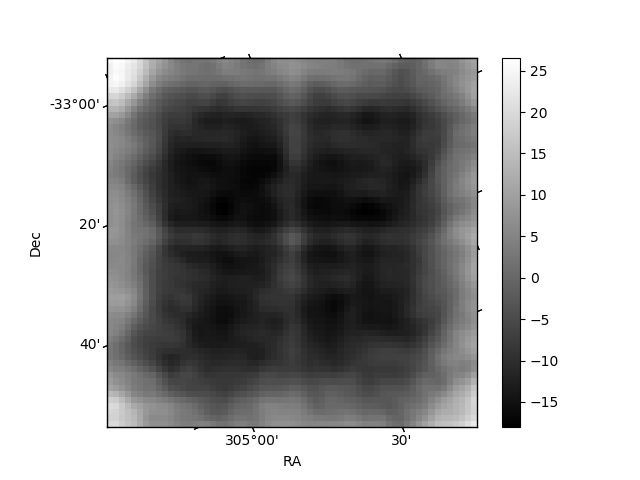
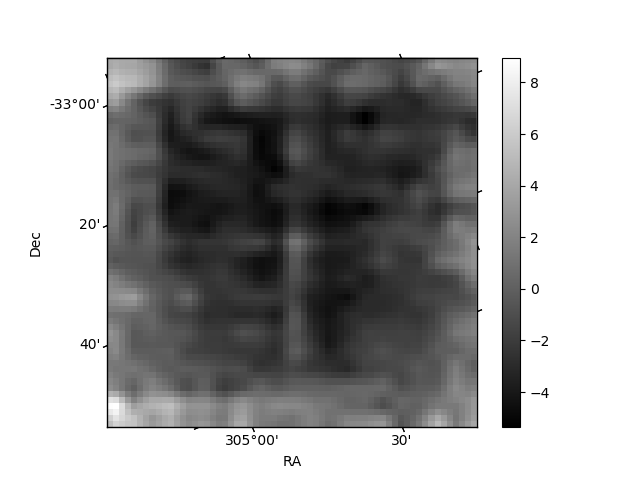
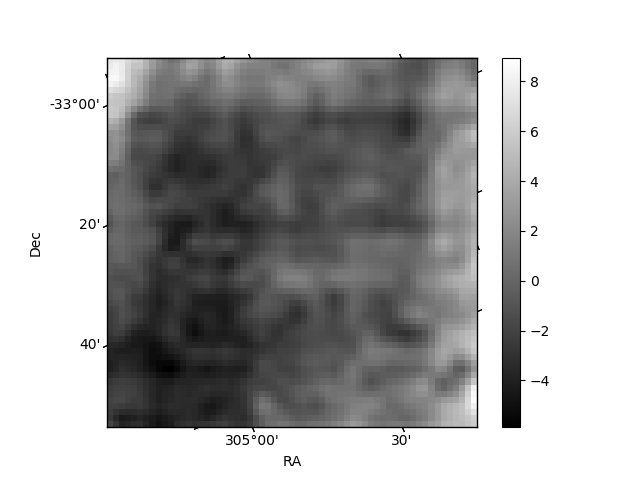
Histogram calculated using DETX and DETY for each event in the final _common_clean file
| Quadrant A | 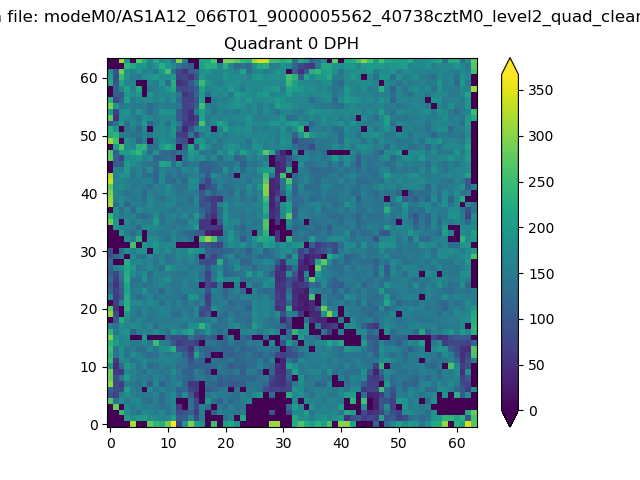 |
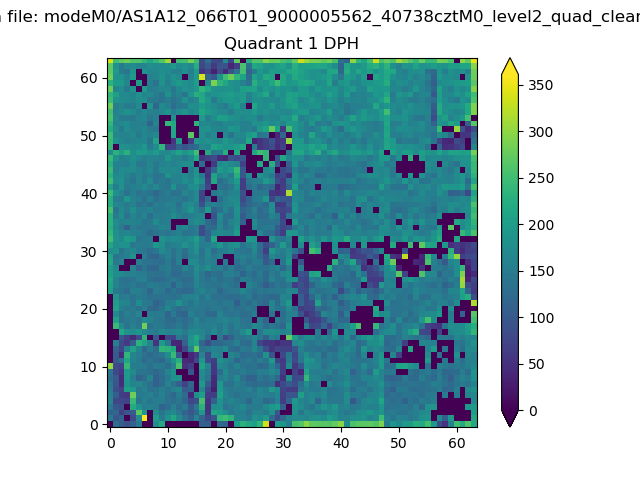 |
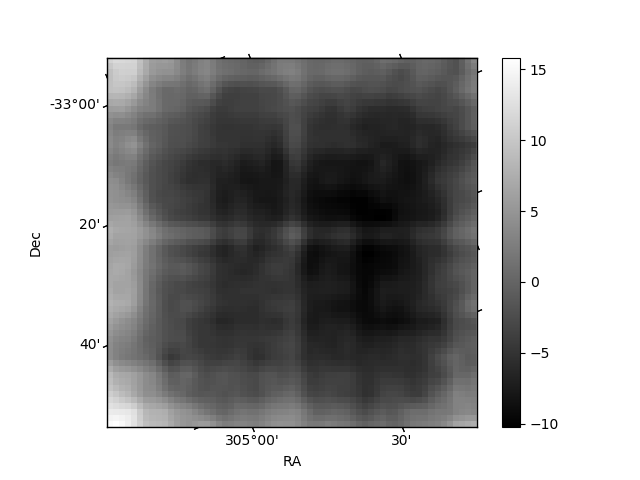
Quadrant B |
|---|---|---|---|
| Quadrant D | 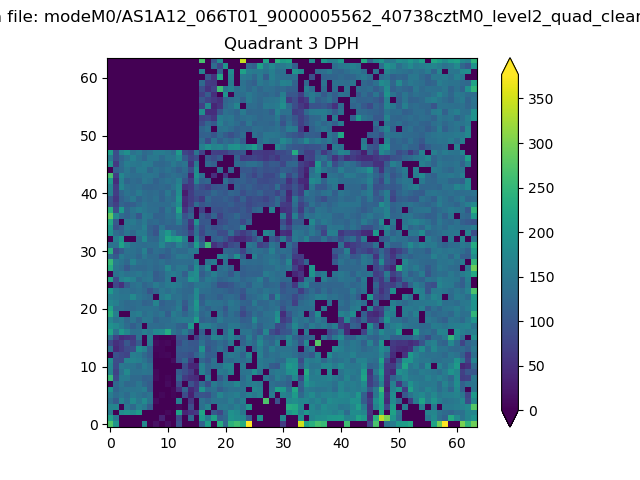 |
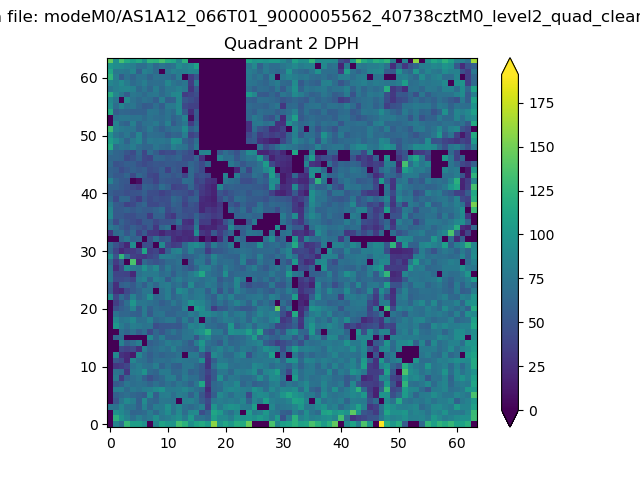 |
Quadrant C |
| Plot type | Count rate plots | Images |
|---|---|---|
| Comparison with Poisson distribution Blue bars denote a histogram of data divided into 1 sec bins. Red curve is a Poisson curve with rate = median count rate of data. |
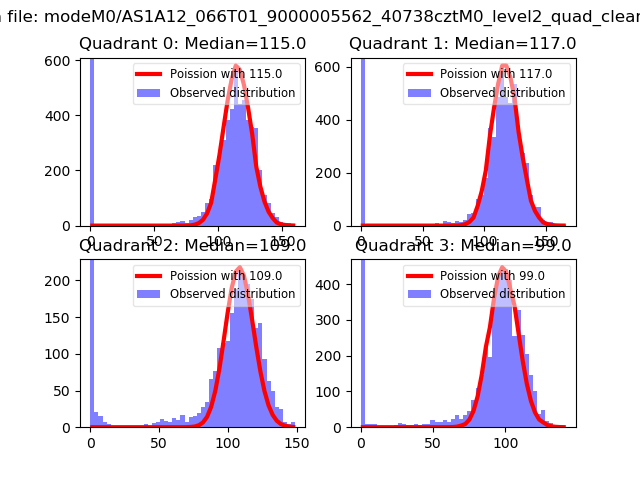 |
 |
| Quadrant-wise count rates Data is divided into 100 sec bins |
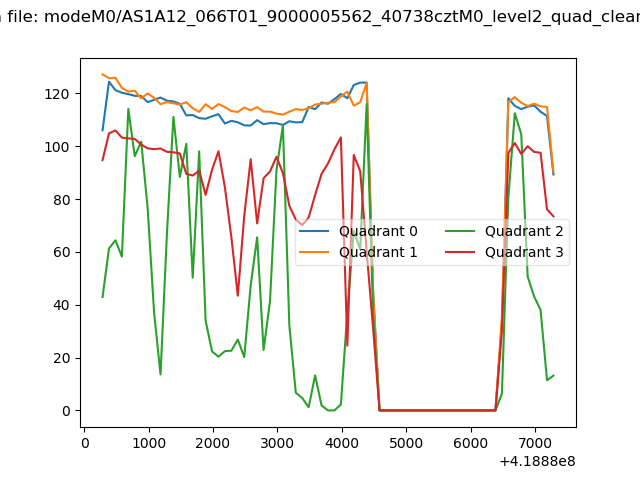 |
|
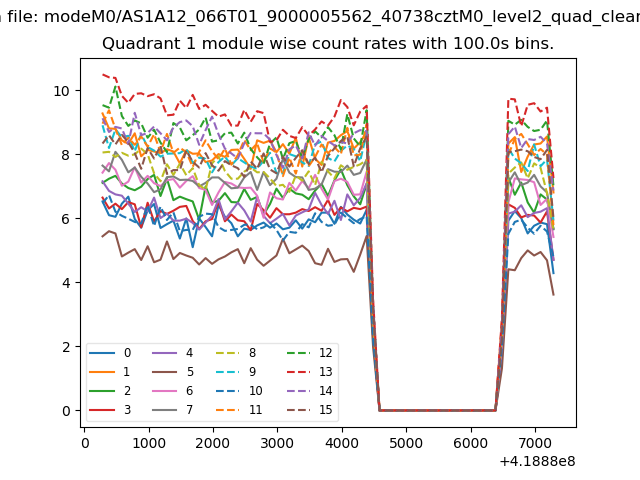
| Module-wise count rates for Quadrant A Data is divided into 100 sec bins |
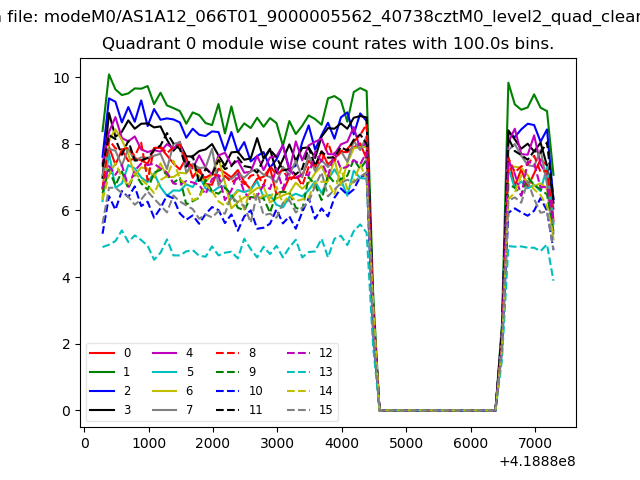 |
 |
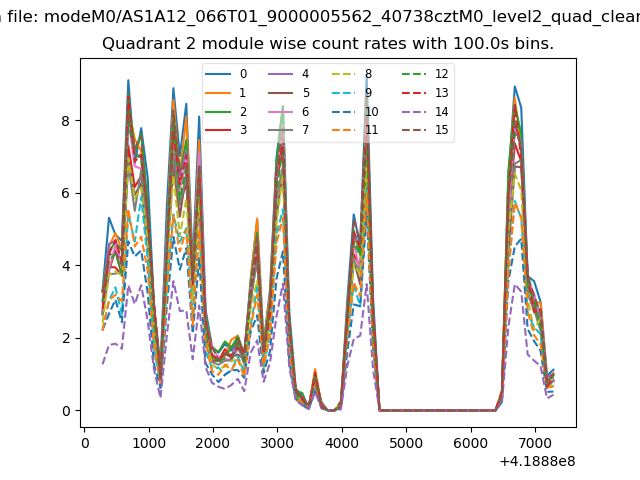
| Module-wise count rates for Quadrant B Data is divided into 100 sec bins |
 |
 |
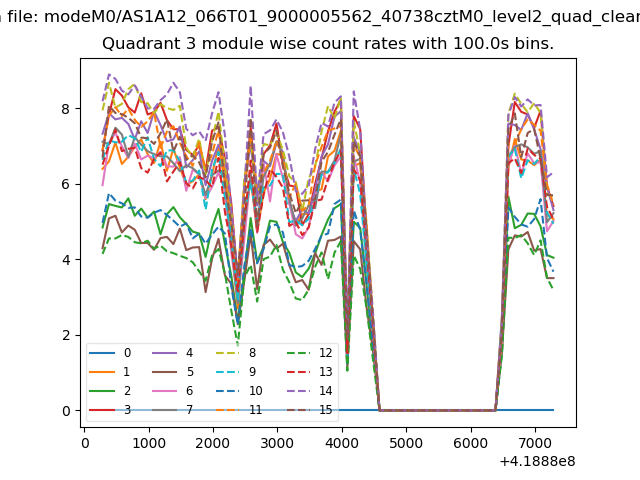
| Module-wise count rates for Quadrant C Data is divided into 100 sec bins |
 |
 |
| Module-wise count rates for Quadrant D Data is divided into 100 sec bins |
 |
 |
| Parameter | Plot |
|---|---|
| CZT HV Monitor | 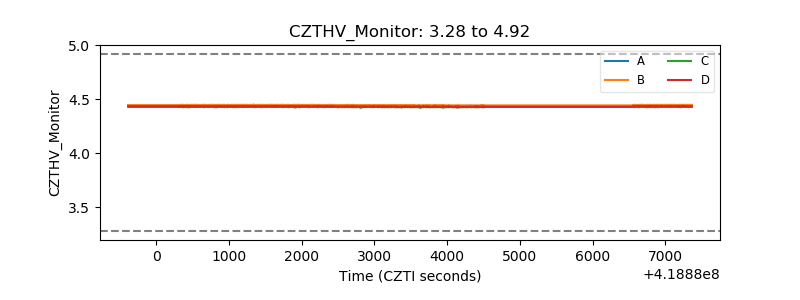 |
| D_VDD | 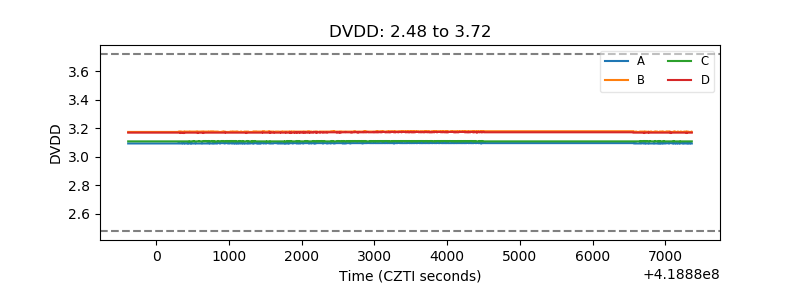 |
| Temperature 1 | 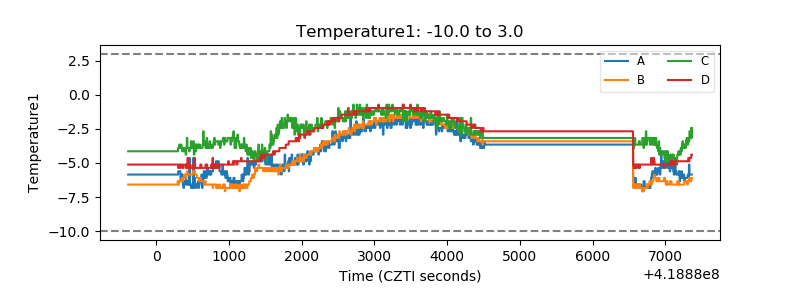 |
| Veto HV Monitor | 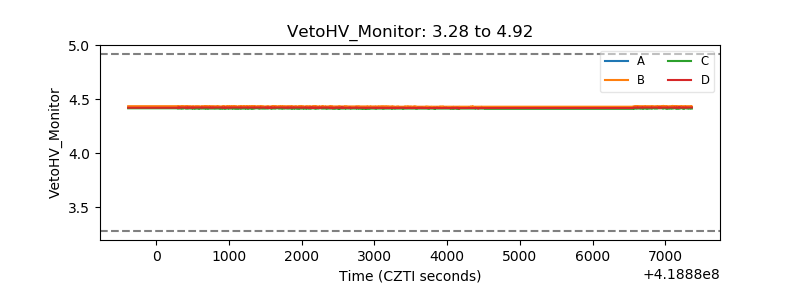 |
| Veto LLD | 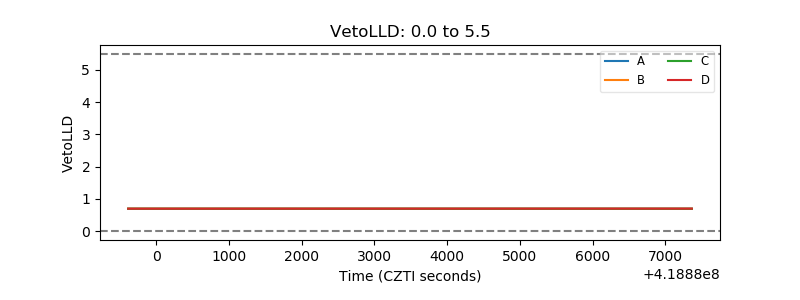 |
| Alpha Counter | 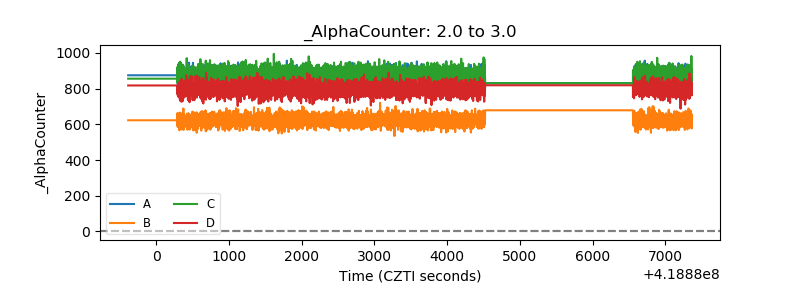 |
| _CPM_Rate | 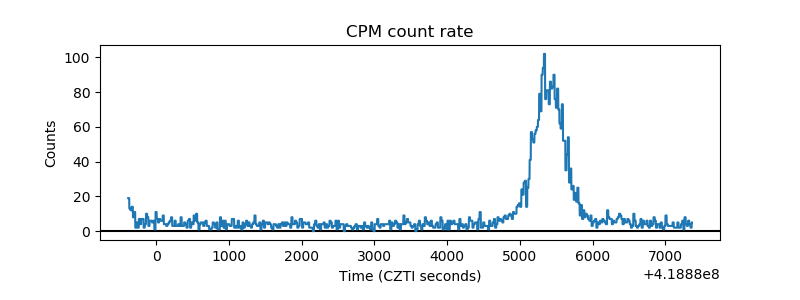 |
| CZT Counter | 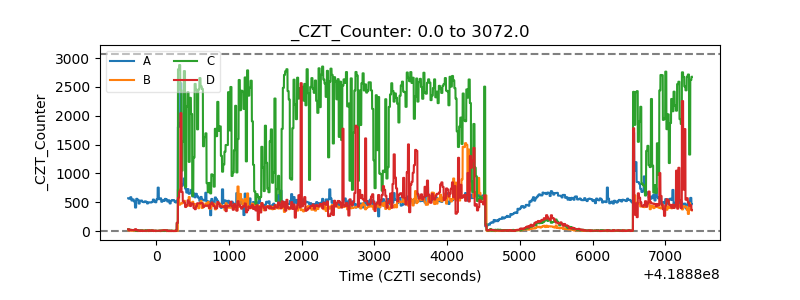 |
| +2.5 Volts monitor |  |
| +5 Volts monitor | 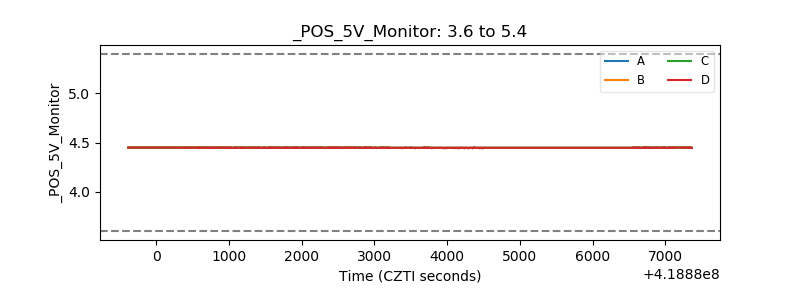 |
| _ROLL_ROT | 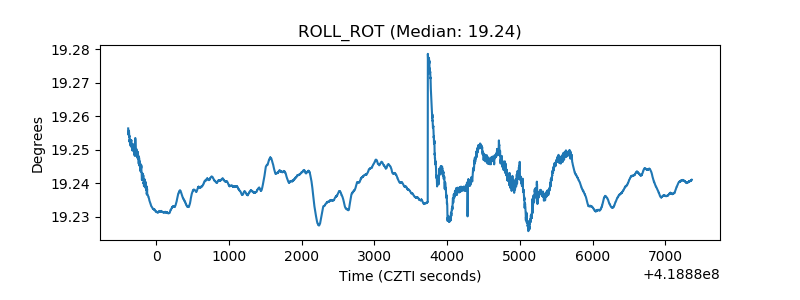 |
| _Roll_DEC | 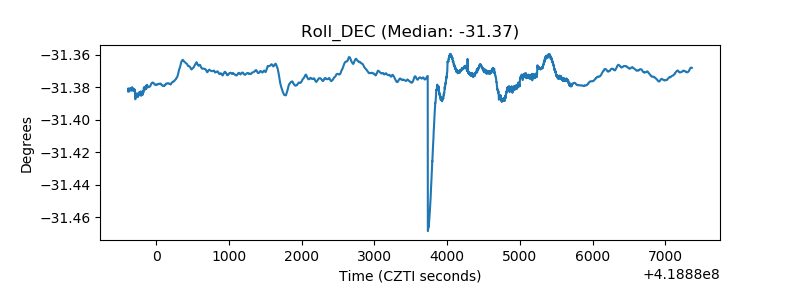 |
| _Roll_RA | 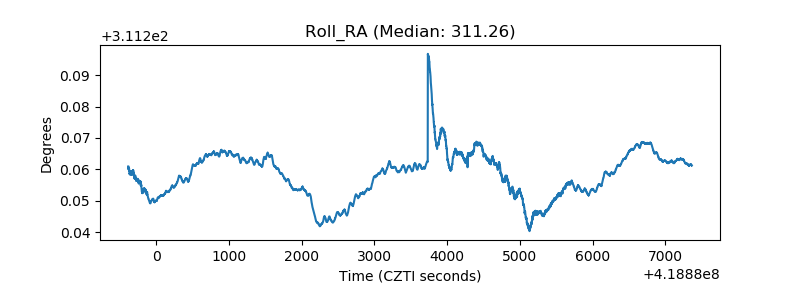 |
| Veto Counter | 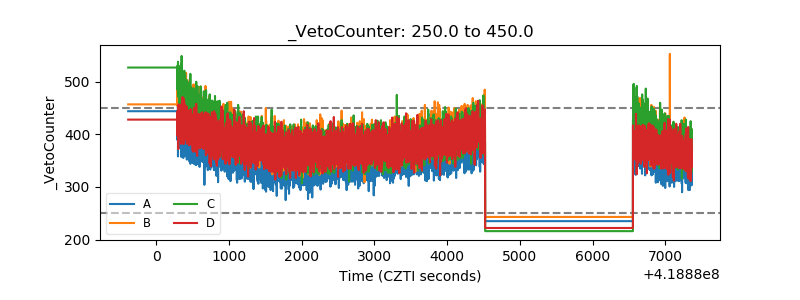 |