| Param | Original file | Final file |
|---|---|---|
| Filename | modeM0/AS1A12_066T01_9000005562_40740cztM0_level2.fits | modeM0/AS1A12_066T01_9000005562_40740cztM0_level2_quad_clean.evt |
| Size (bytes) | 510,249,600 | 78,932,160 |
| Size | 486.6 MB | 75.3 MB |
| Events in quadrant A | 2,883,673 | 607,346 |
| Events in quadrant B | 2,686,548 | 619,584 |
| Events in quadrant C | 9,529,706 | 346,552 |
| Events in quadrant D | 3,355,555 | 427,859 |
| Mode M0 | |||
|---|---|---|---|
| Quadrant | BADHDUFLAG | Total packets | Discarded packets |
| A | 0 | 11720 | 2 |
| B | 0 | 11703 | 1 |
| C | 0 | 32118 | 1 |
| D | 0 | 13860 | 1 |
| Mode M9 | |||
|---|---|---|---|
| Quadrant | BADHDUFLAG | Total packets | Discarded packets |
| A | 0 | 14 | 0 |
| B | 0 | 14 | 0 |
| C | 0 | 14 | 0 |
| D | 0 | 14 | 0 |
| Mode SS | |||
|---|---|---|---|
| Quadrant | BADHDUFLAG | Total packets | Discarded packets |
| A | 0 | 114 | 0 |
| B | 0 | 114 | 0 |
| C | 0 | 114 | 0 |
| D | 0 | 114 | 0 |
| Quadrant | Total seconds | Saturated seconds | Saturation percentage |
|---|---|---|---|
| A | 5543 | 6 | 0.108245% |
| B | 5543 | 19 | 0.342775% |
| C | 5543 | 2646 | 47.735883% |
| D | 5543 | 1336 | 24.102472% |
Noise dominated data is calculated using 1-second bins in cleaned event files. If a bin has >2000 counts, and if more than 50% of those come from <1% of pixels, then it is considered to be noise-dominated and hence unusable.
| Quadrant | # 1 sec bins | Bins with >0 counts | Bins with >2000 counts | High rate bins dominated by noise | Noise dominated (total time) | Noise dominated (detector-on time) | Marked lightcurve |
|---|---|---|---|---|---|---|---|
| A | 6976 | 5544 | 2 | 2 | 0.03% | 0.04% | 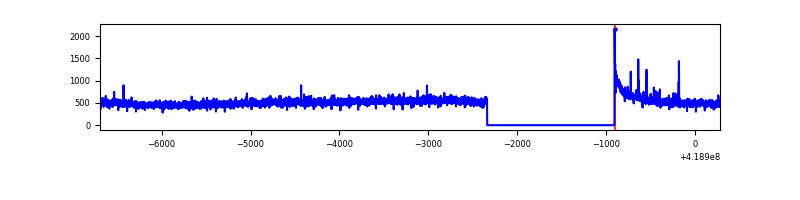 |
| B | 6976 | 5544 | 8 | 8 | 0.11% | 0.14% | 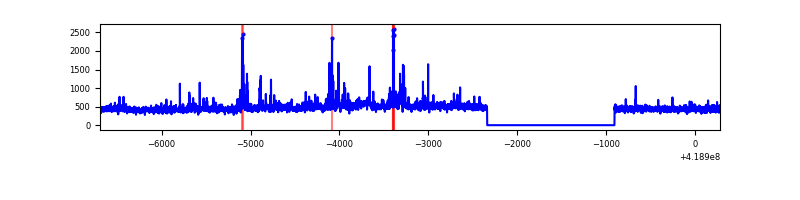 |
| C | 6975 | 5543 | 2549 | 2549 | 36.54% | 45.99% | 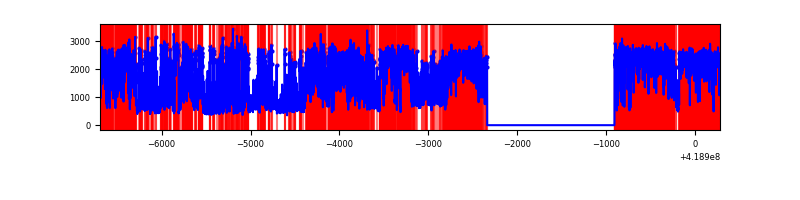 |
| D | 6976 | 5544 | 101 | 101 | 1.45% | 1.82% | 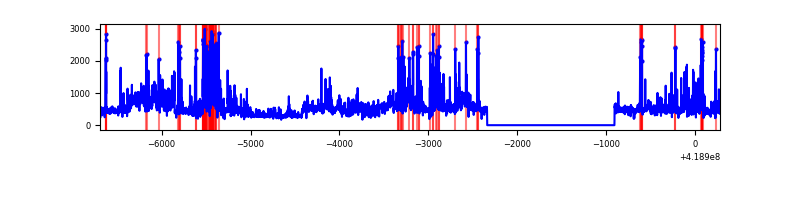 |
Top three noisy pixels from each quadrant. If the there are fewer than three noisy pixels in the level2.evt file, extra rows are filled as -1
| Pixel properties | Quadrant properties | ||||||
|---|---|---|---|---|---|---|---|
| Quadrant | DetID | PixID | Counts | Sigma | Mean | Median | Sigma |
| A | 10 | 83 | 440608 | 3461.61 | 617 | 603 | 127.1 |
| A | 12 | 189 | 35635 | 275.6 | 617 | 603 | 127.1 |
| A | 13 | 248 | 15528 | 117.42 | 617 | 603 | 127.1 |
| B | 4 | 170 | 91672 | 750.61 | 612 | 594 | 121.3 |
| B | 0 | 229 | 73205 | 598.42 | 612 | 594 | 121.3 |
| B | 0 | 190 | 35779 | 289.98 | 612 | 594 | 121.3 |
| C | 9 | 187 | 7425383 | 65342.45 | 482 | 485 | 113.6 |
| C | 15 | 214 | 189725 | 1665.4 | 482 | 485 | 113.6 |
| C | 12 | 249 | 14205 | 120.74 | 482 | 485 | 113.6 |
| D | 12 | 227 | 373420 | 2989.22 | 505 | 491 | 124.8 |
| D | 2 | 249 | 280708 | 2246.08 | 505 | 491 | 124.8 |
| D | 12 | 191 | 272532 | 2180.55 | 505 | 491 | 124.8 |
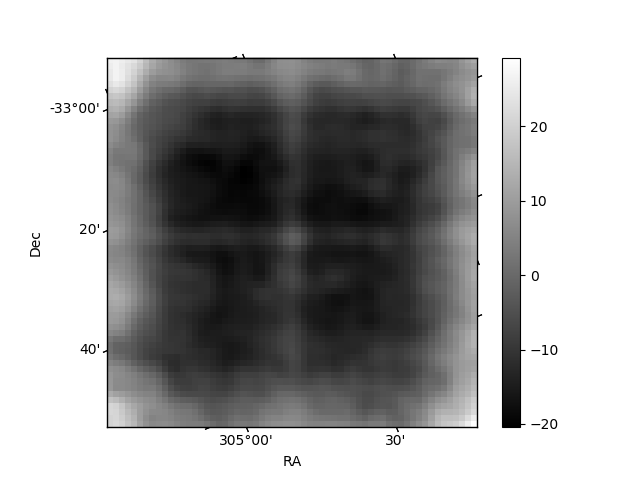
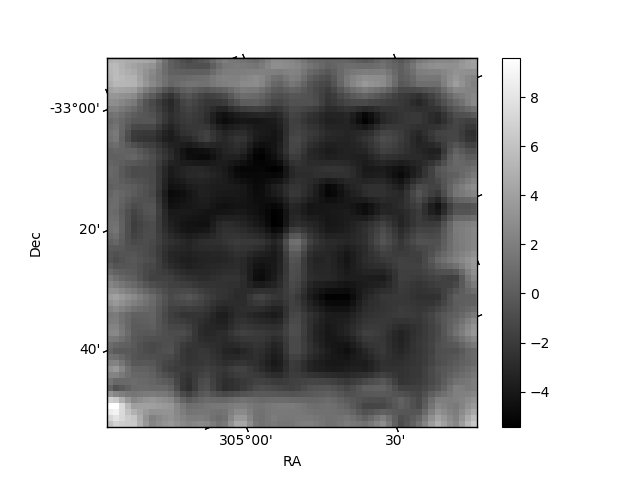
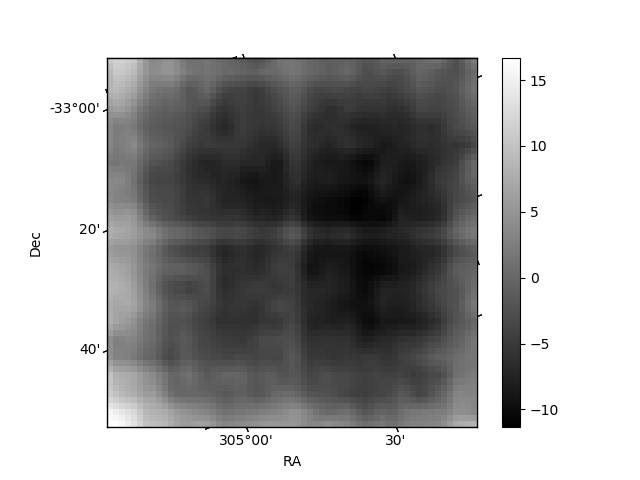
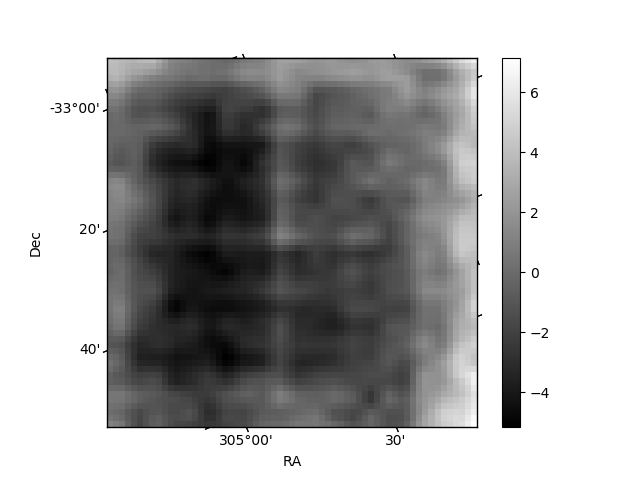
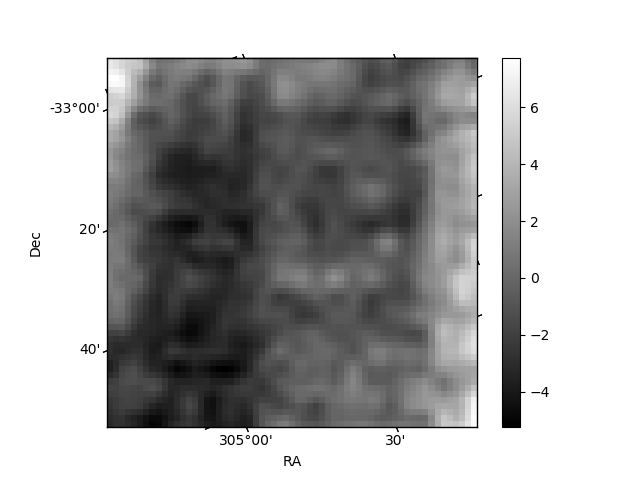
Histogram calculated using DETX and DETY for each event in the final _common_clean file
| Quadrant A | 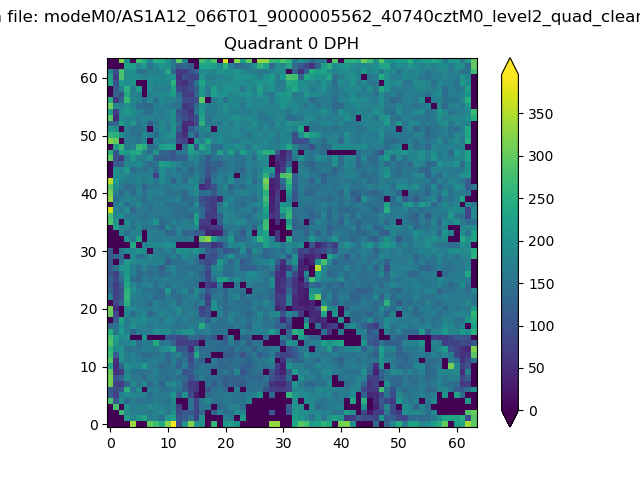 |
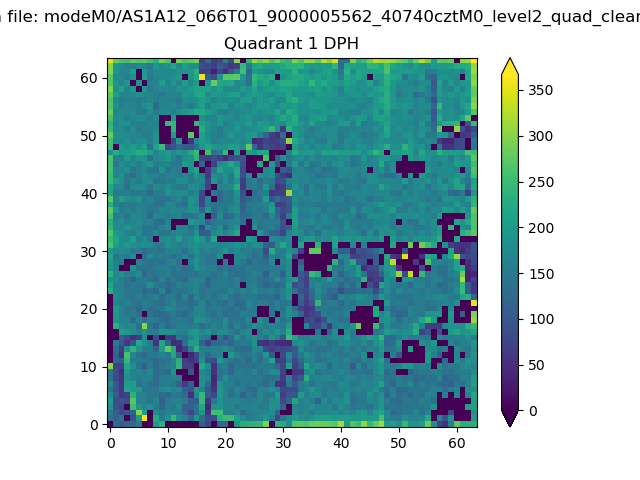 |
Quadrant B |
|---|---|---|---|
| Quadrant D | 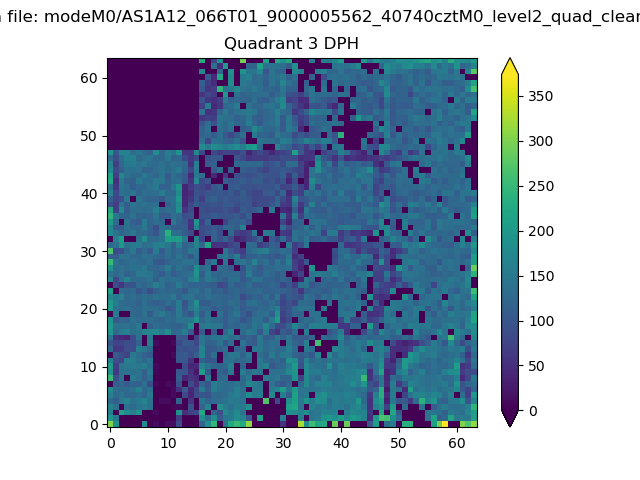 |
 |
Quadrant C |
| Plot type | Count rate plots | Images |
|---|---|---|
| Comparison with Poisson distribution Blue bars denote a histogram of data divided into 1 sec bins. Red curve is a Poisson curve with rate = median count rate of data. |
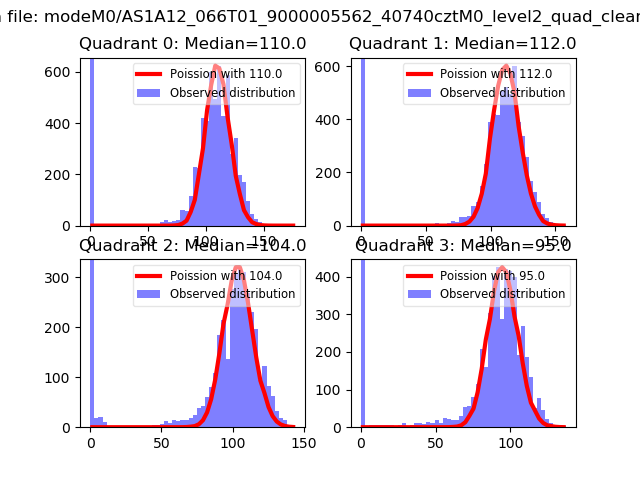 |
 |
| Quadrant-wise count rates Data is divided into 100 sec bins |
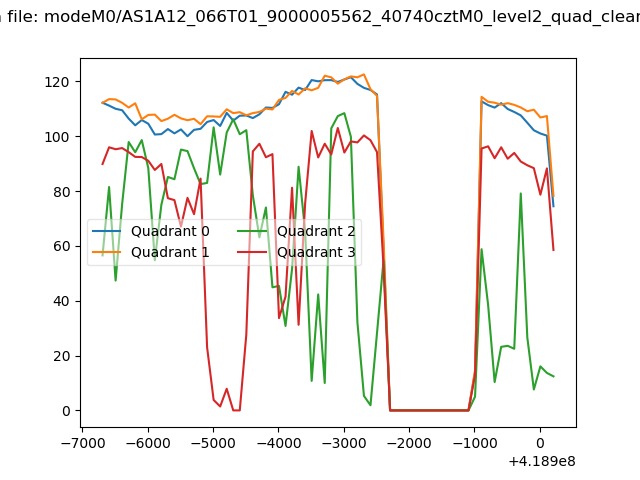 |
|
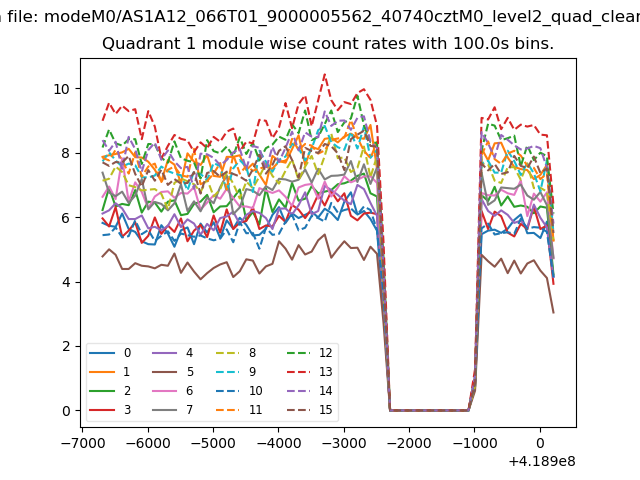
| Module-wise count rates for Quadrant A Data is divided into 100 sec bins |
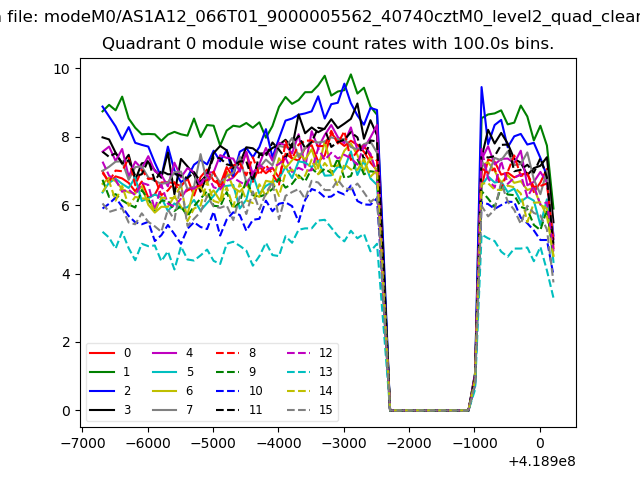 |
 |
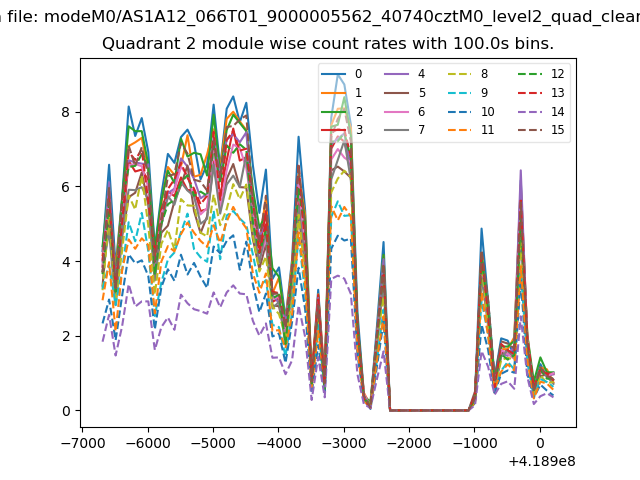
| Module-wise count rates for Quadrant B Data is divided into 100 sec bins |
 |
 |
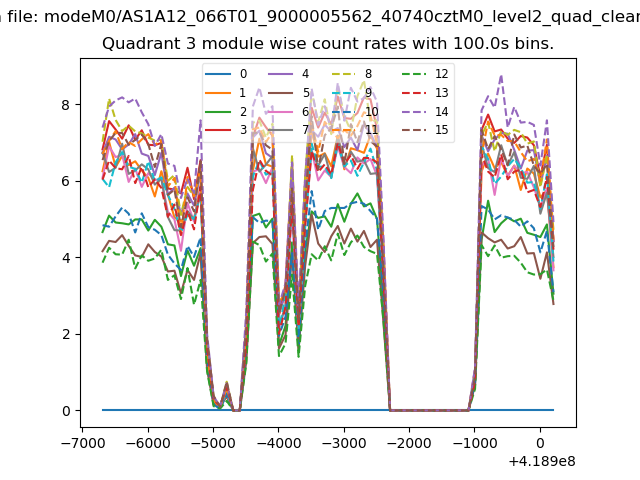
| Module-wise count rates for Quadrant C Data is divided into 100 sec bins |
 |
 |
| Module-wise count rates for Quadrant D Data is divided into 100 sec bins |
 |
 |
| Parameter | Plot |
|---|---|
| CZT HV Monitor |  |
| D_VDD | 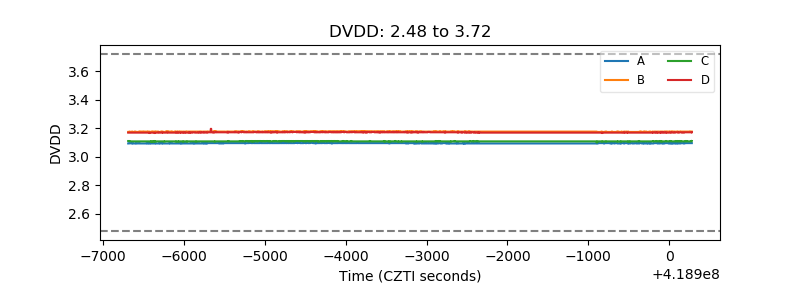 |
| Temperature 1 | 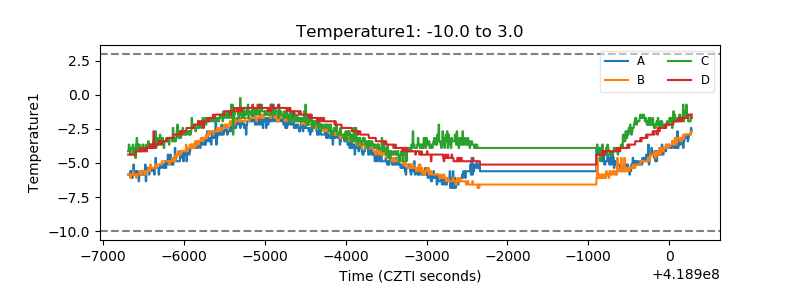 |
| Veto HV Monitor | 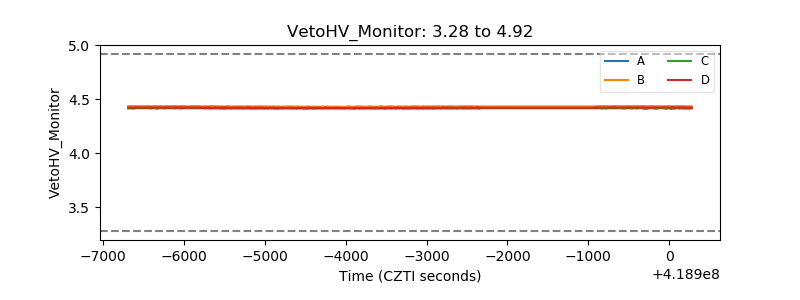 |
| Veto LLD | 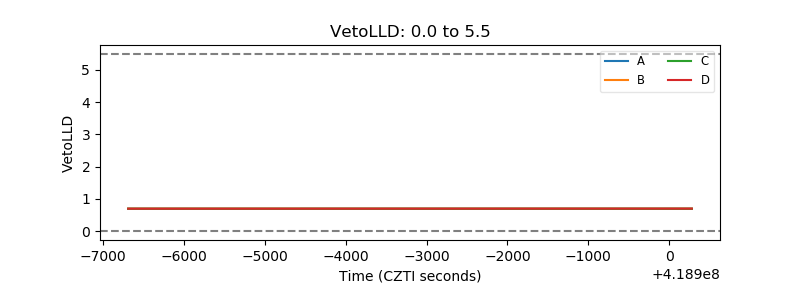 |
| Alpha Counter | 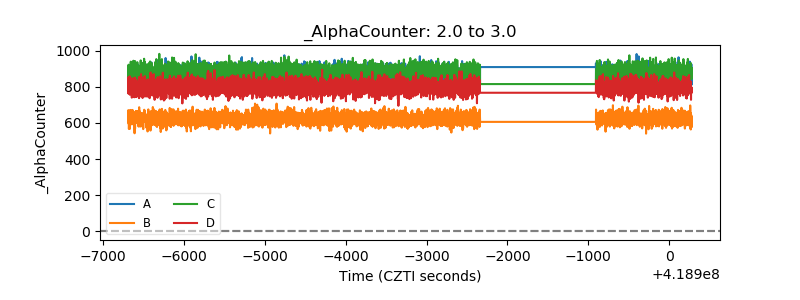 |
| _CPM_Rate | 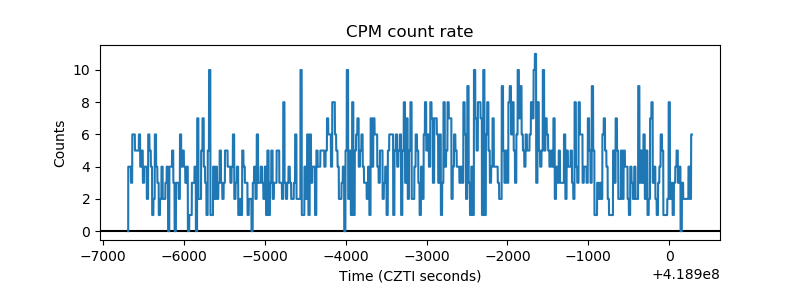 |
| CZT Counter | 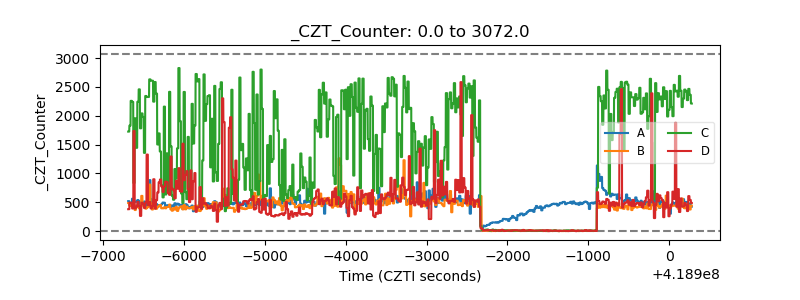 |
| +2.5 Volts monitor | 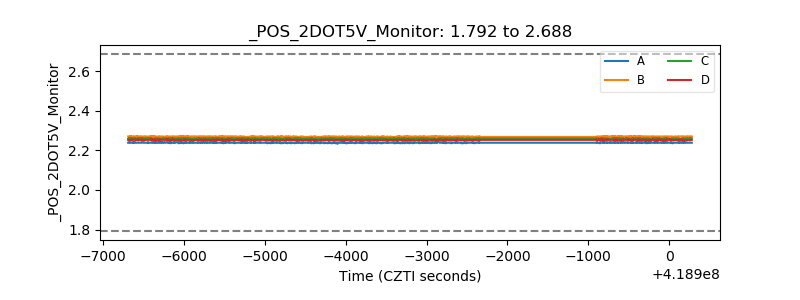 |
| +5 Volts monitor | 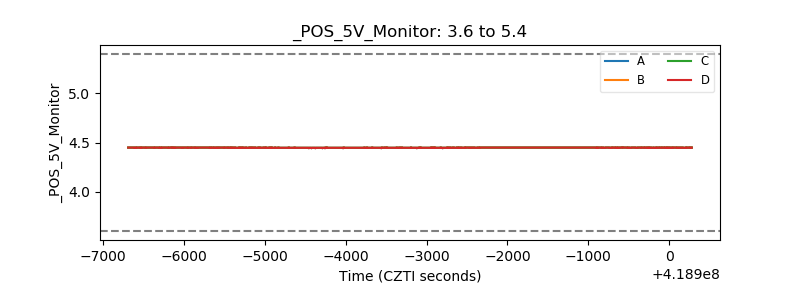 |
| _ROLL_ROT | 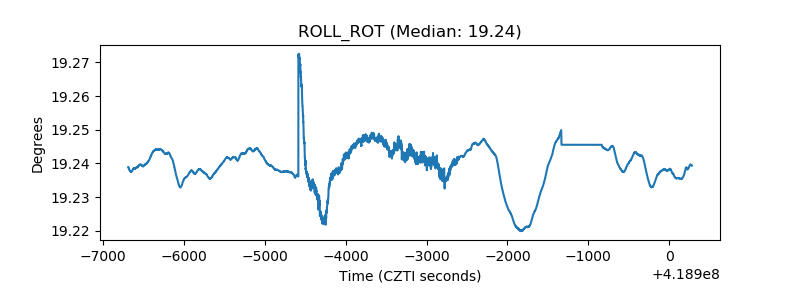 |
| _Roll_DEC | 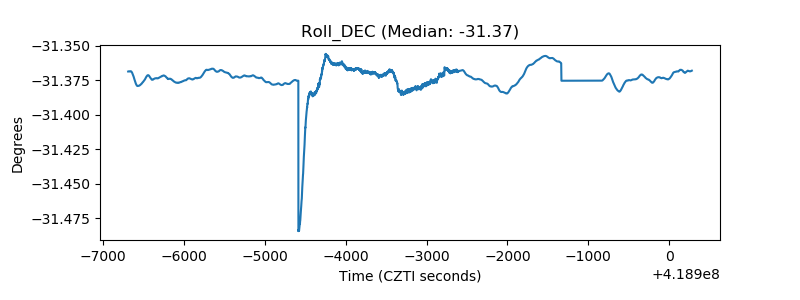 |
| _Roll_RA | 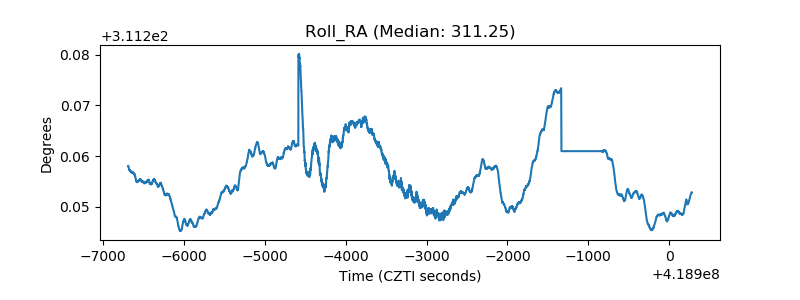 |
| Veto Counter | 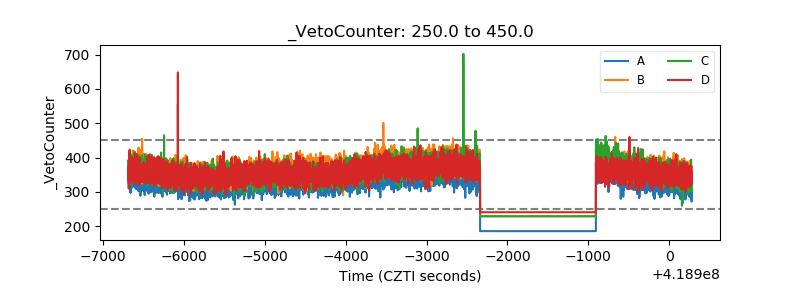 |