| Param | Original file | Final file |
|---|---|---|
| Filename | modeM0/AS1A12_066T01_9000005562_40741cztM0_level2.fits | modeM0/AS1A12_066T01_9000005562_40741cztM0_level2_quad_clean.evt |
| Size (bytes) | 587,309,760 | 83,355,840 |
| Size | 560.1 MB | 79.5 MB |
| Events in quadrant A | 3,240,153 | 642,869 |
| Events in quadrant B | 2,790,063 | 655,131 |
| Events in quadrant C | 10,097,281 | 351,227 |
| Events in quadrant D | 5,152,760 | 461,220 |
| Mode M0 | |||
|---|---|---|---|
| Quadrant | BADHDUFLAG | Total packets | Discarded packets |
| A | 0 | 13026 | 3 |
| B | 0 | 12196 | 1 |
| C | 0 | 34005 | 1 |
| D | 0 | 19275 | 1 |
| Mode M9 | |||
|---|---|---|---|
| Quadrant | BADHDUFLAG | Total packets | Discarded packets |
| A | 0 | 13 | 0 |
| B | 0 | 13 | 0 |
| C | 0 | 13 | 0 |
| D | 0 | 13 | 0 |
| Mode SS | |||
|---|---|---|---|
| Quadrant | BADHDUFLAG | Total packets | Discarded packets |
| A | 0 | 120 | 0 |
| B | 0 | 120 | 0 |
| C | 0 | 120 | 0 |
| D | 0 | 120 | 0 |
| Quadrant | Total seconds | Saturated seconds | Saturation percentage |
|---|---|---|---|
| A | 5910 | 12 | 0.203046% |
| B | 5910 | 17 | 0.287648% |
| C | 5910 | 2948 | 49.881557% |
| D | 5910 | 1471 | 24.890017% |
Noise dominated data is calculated using 1-second bins in cleaned event files. If a bin has >2000 counts, and if more than 50% of those come from <1% of pixels, then it is considered to be noise-dominated and hence unusable.
| Quadrant | # 1 sec bins | Bins with >0 counts | Bins with >2000 counts | High rate bins dominated by noise | Noise dominated (total time) | Noise dominated (detector-on time) | Marked lightcurve |
|---|---|---|---|---|---|---|---|
| A | 7194 | 5912 | 3 | 3 | 0.04% | 0.05% | 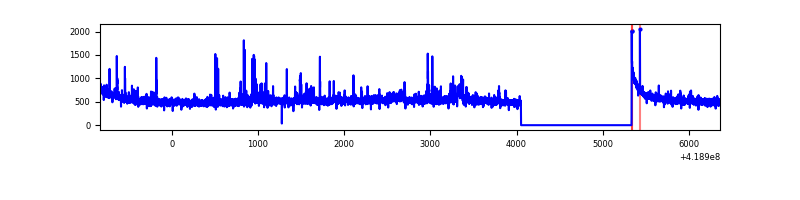 |
| B | 7194 | 5912 | 6 | 6 | 0.08% | 0.10% | 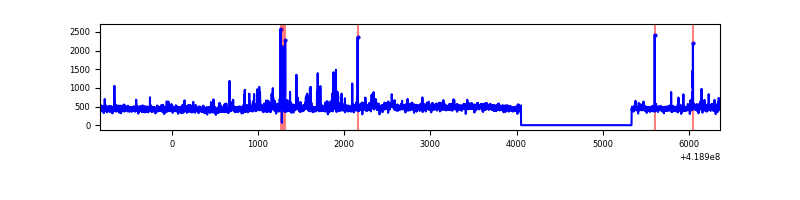 |
| C | 7194 | 5911 | 2843 | 2843 | 39.52% | 48.10% | 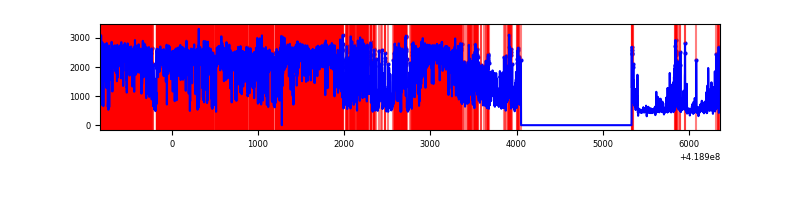 |
| D | 7194 | 5911 | 366 | 366 | 5.09% | 6.19% | 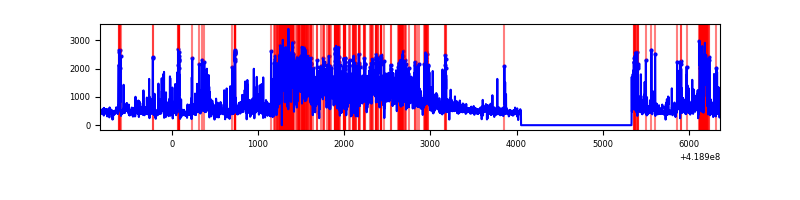 |
Top three noisy pixels from each quadrant. If the there are fewer than three noisy pixels in the level2.evt file, extra rows are filled as -1
| Pixel properties | Quadrant properties | ||||||
|---|---|---|---|---|---|---|---|
| Quadrant | DetID | PixID | Counts | Sigma | Mean | Median | Sigma |
| A | 10 | 83 | 514630 | 3775.37 | 659 | 645 | 136.1 |
| A | 12 | 189 | 68385 | 497.57 | 659 | 645 | 136.1 |
| A | 13 | 248 | 67772 | 493.07 | 659 | 645 | 136.1 |
| B | 0 | 229 | 110171 | 854.04 | 653 | 634 | 128.3 |
| B | 0 | 190 | 45616 | 350.72 | 653 | 634 | 128.3 |
| B | 0 | 230 | 28907 | 220.44 | 653 | 634 | 128.3 |
| C | 9 | 187 | 7748984 | 64350.81 | 512 | 516 | 120.4 |
| C | 15 | 214 | 204674 | 1695.53 | 512 | 516 | 120.4 |
| C | 14 | 254 | 107278 | 886.66 | 512 | 516 | 120.4 |
| D | 12 | 227 | 1221110 | 8456.75 | 578 | 561 | 144.3 |
| D | 2 | 249 | 524645 | 3631.19 | 578 | 561 | 144.3 |
| D | 12 | 128 | 364569 | 2522.08 | 578 | 561 | 144.3 |
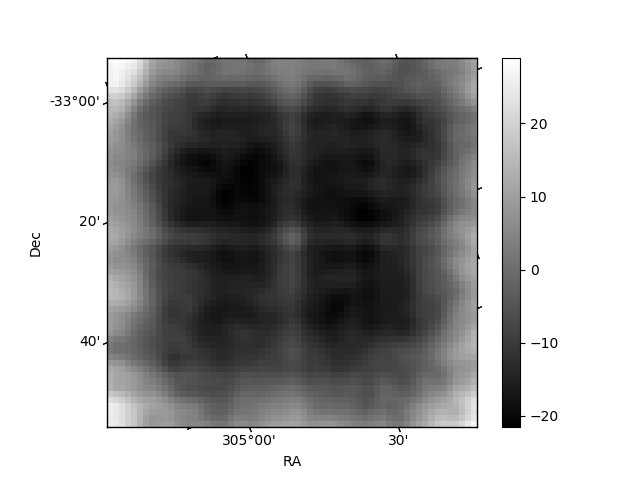
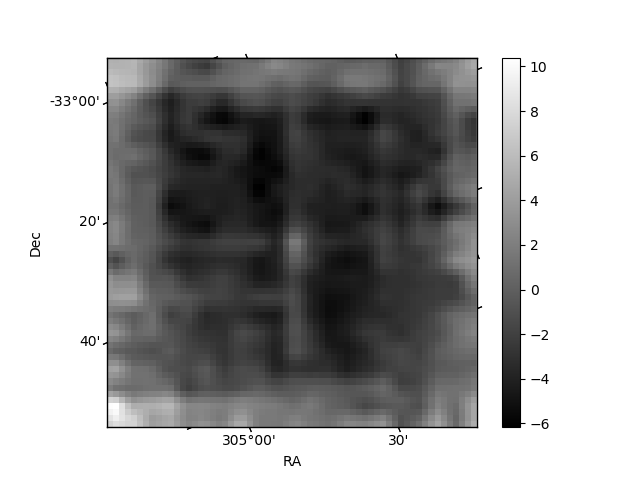
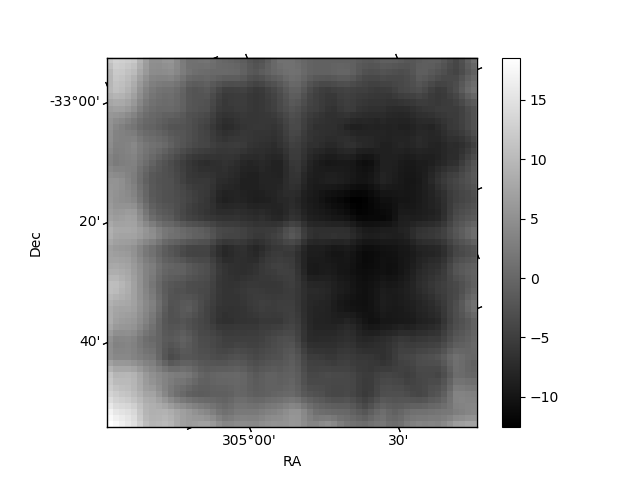
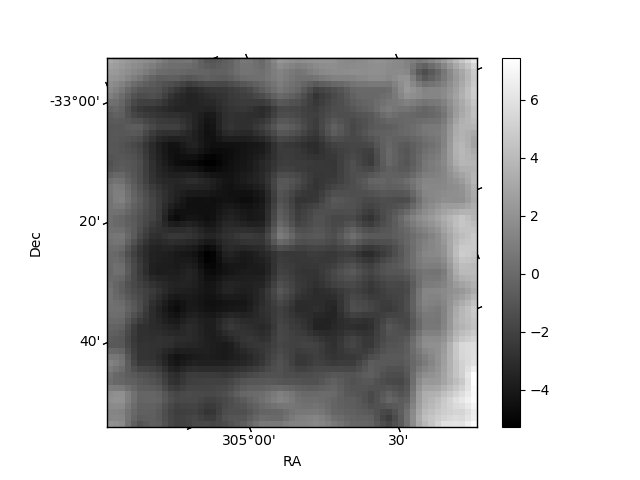
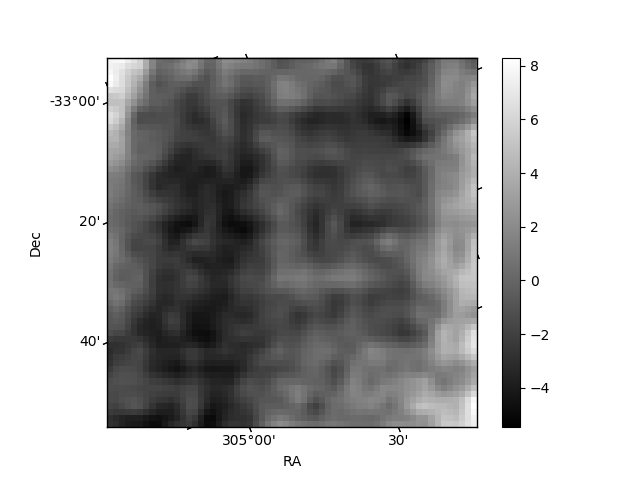
Histogram calculated using DETX and DETY for each event in the final _common_clean file
| Quadrant A | 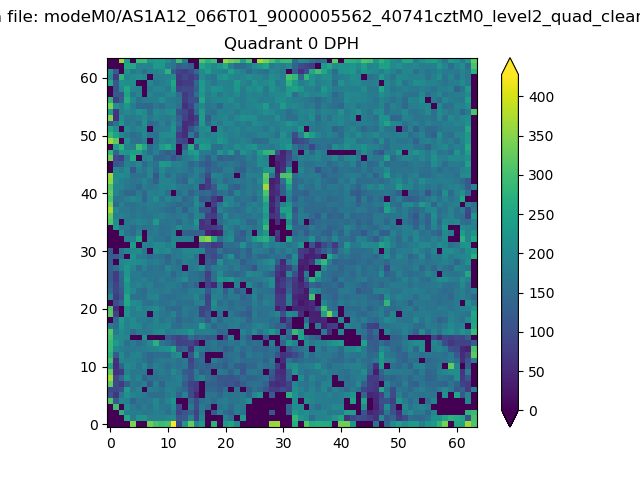 |
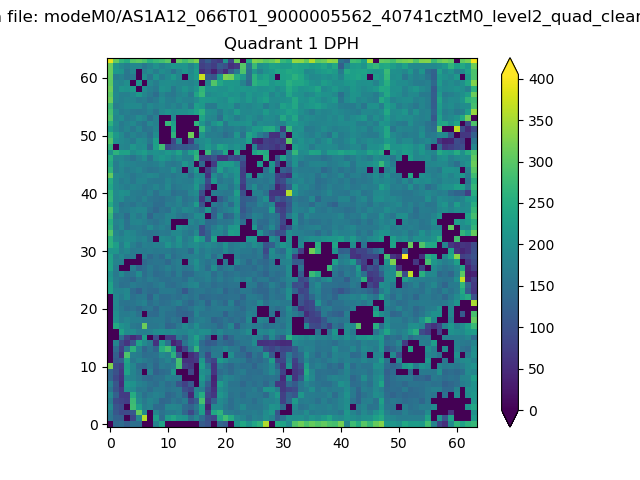 |
Quadrant B |
|---|---|---|---|
| Quadrant D | 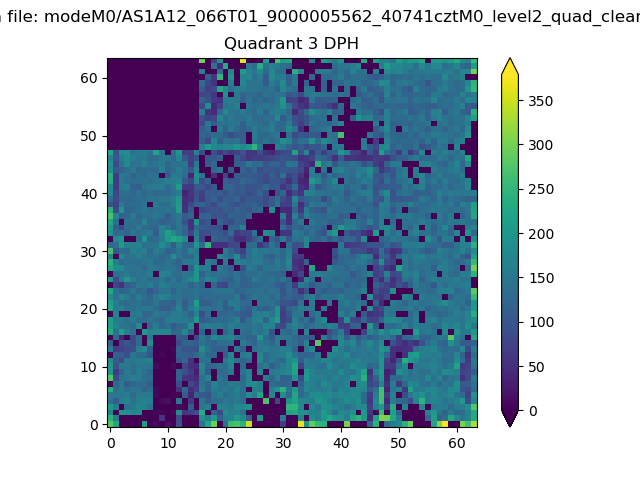 |
 |
Quadrant C |
| Plot type | Count rate plots | Images |
|---|---|---|
| Comparison with Poisson distribution Blue bars denote a histogram of data divided into 1 sec bins. Red curve is a Poisson curve with rate = median count rate of data. |
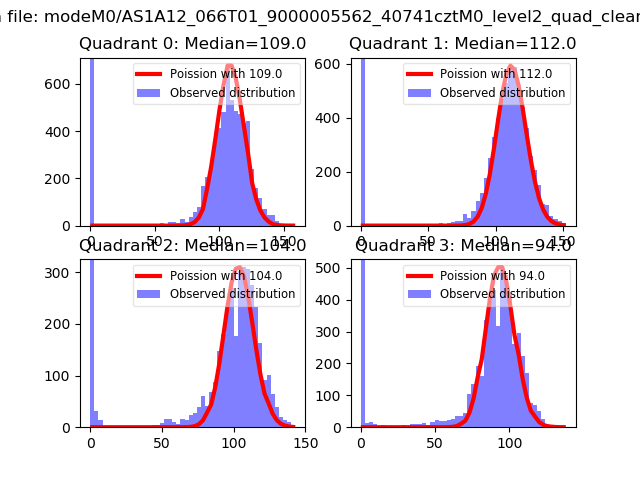 |
 |
| Quadrant-wise count rates Data is divided into 100 sec bins |
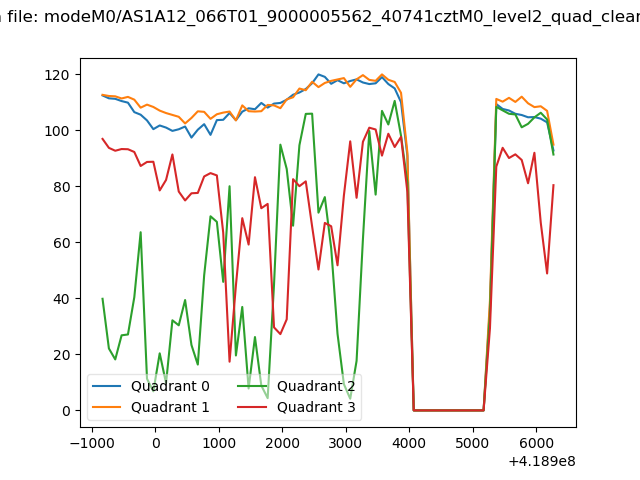 |
|
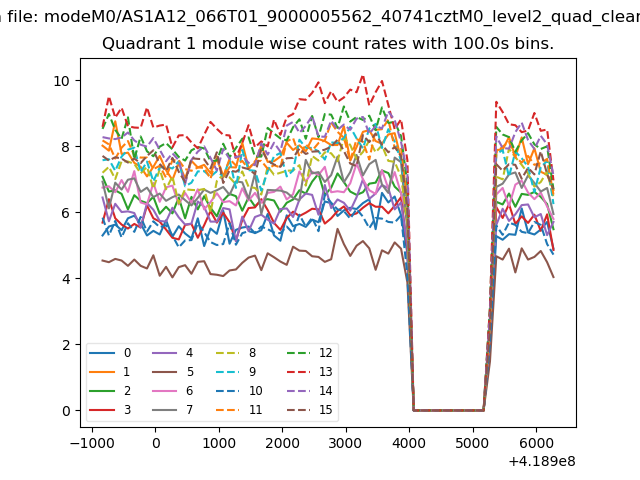
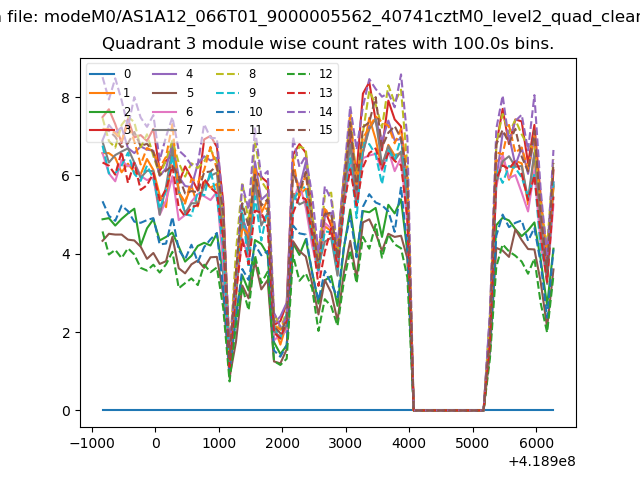
| Module-wise count rates for Quadrant A Data is divided into 100 sec bins |
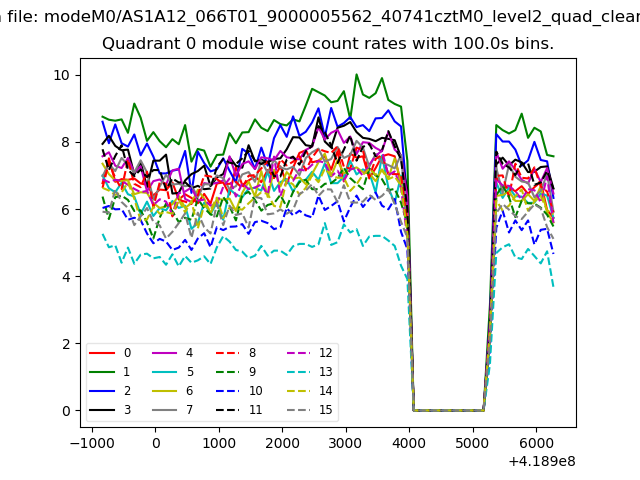 |
 |
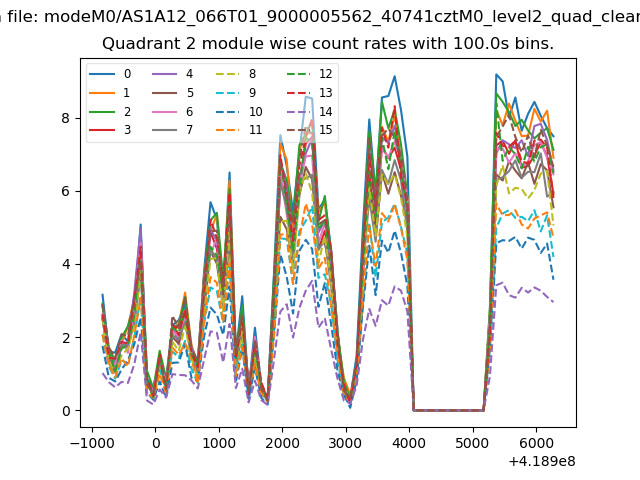
| Module-wise count rates for Quadrant B Data is divided into 100 sec bins |
 |
 |
| Module-wise count rates for Quadrant C Data is divided into 100 sec bins |
 |
 |
| Module-wise count rates for Quadrant D Data is divided into 100 sec bins |
 |
 |
| Parameter | Plot |
|---|---|
| CZT HV Monitor | 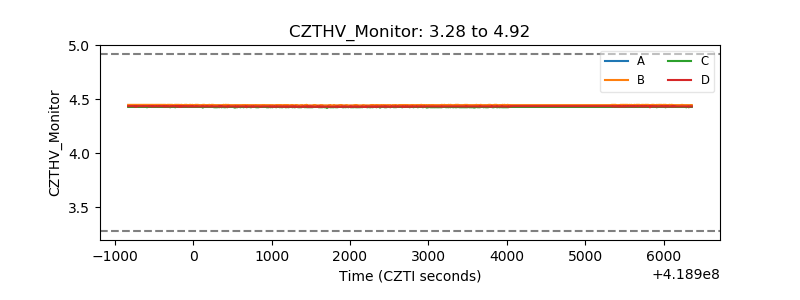 |
| D_VDD | 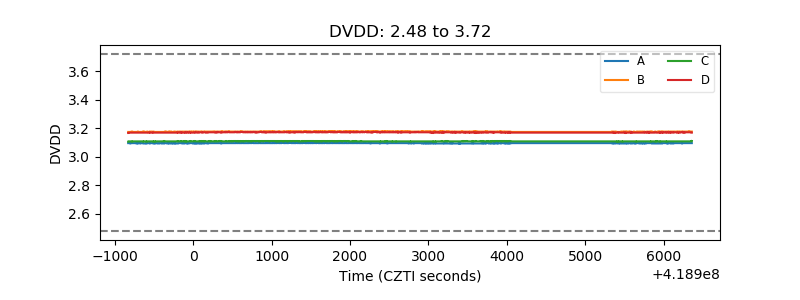 |
| Temperature 1 | 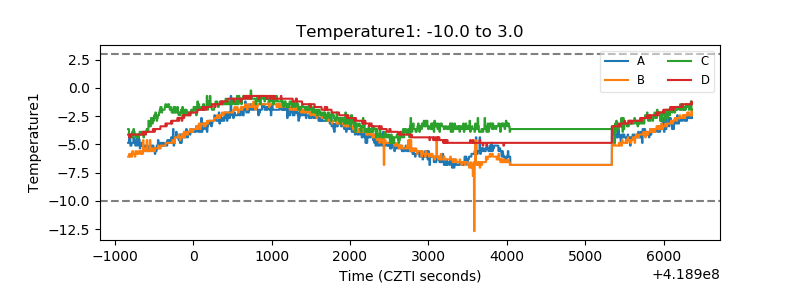 |
| Veto HV Monitor | 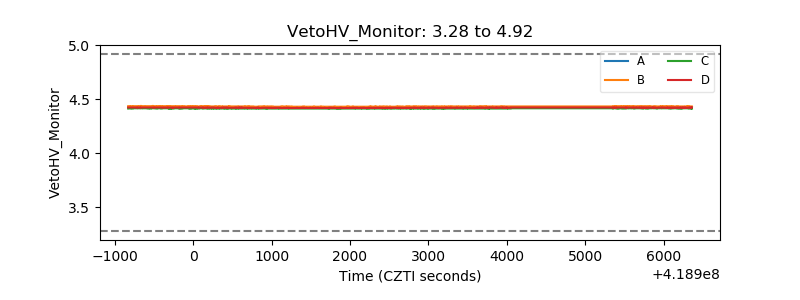 |
| Veto LLD | 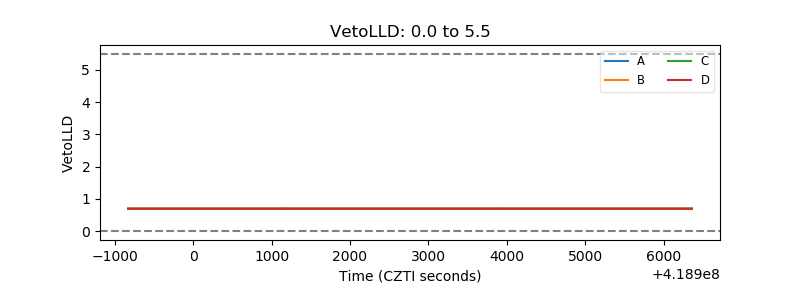 |
| Alpha Counter | 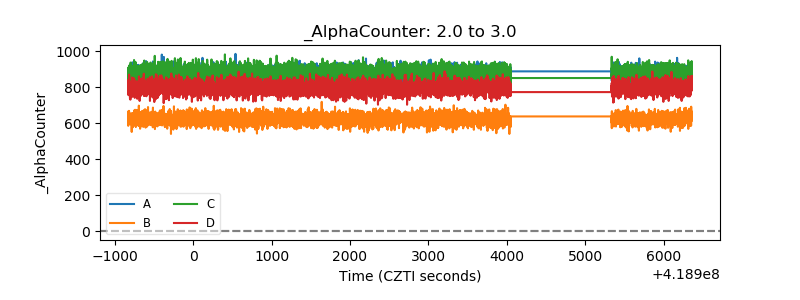 |
| _CPM_Rate | 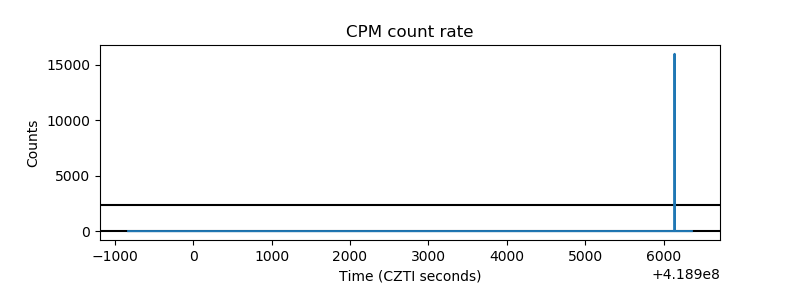 |
| CZT Counter | 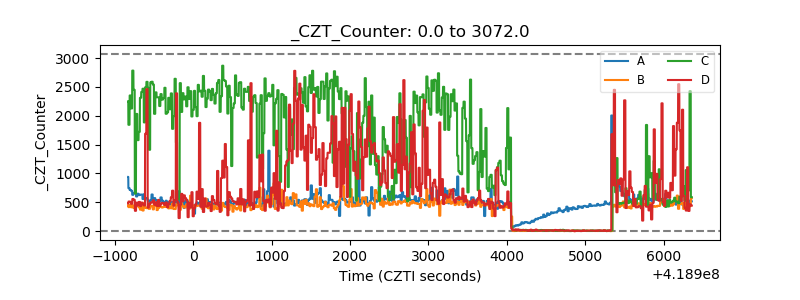 |
| +2.5 Volts monitor | 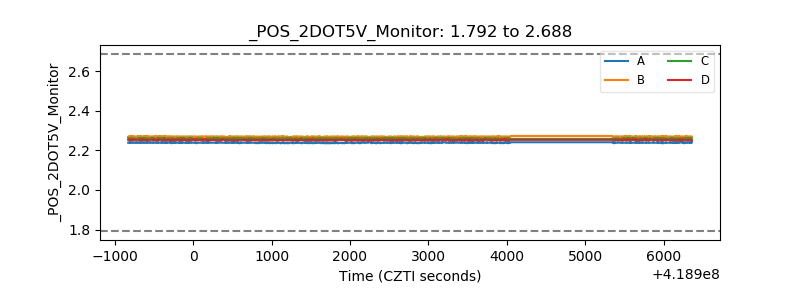 |
| +5 Volts monitor | 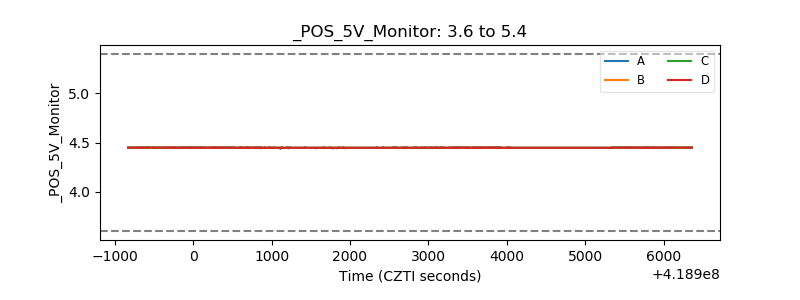 |
| _ROLL_ROT | 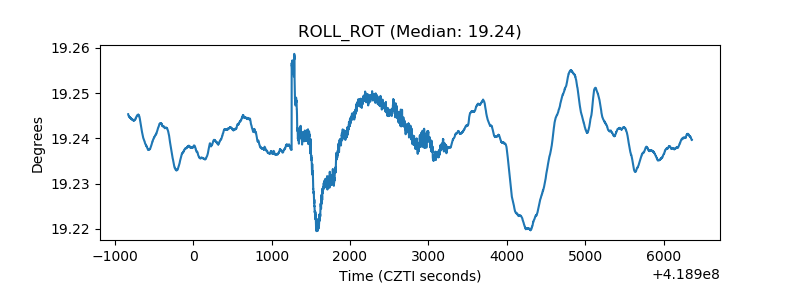 |
| _Roll_DEC | 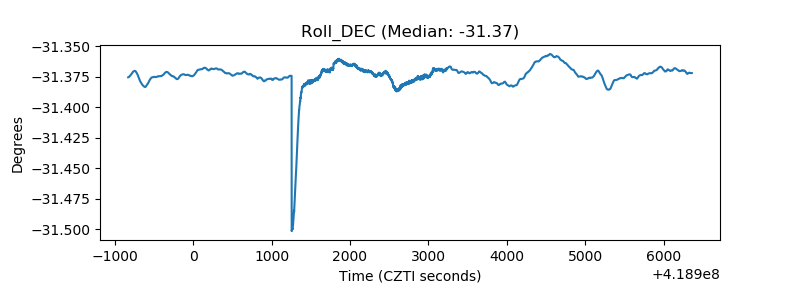 |
| _Roll_RA | 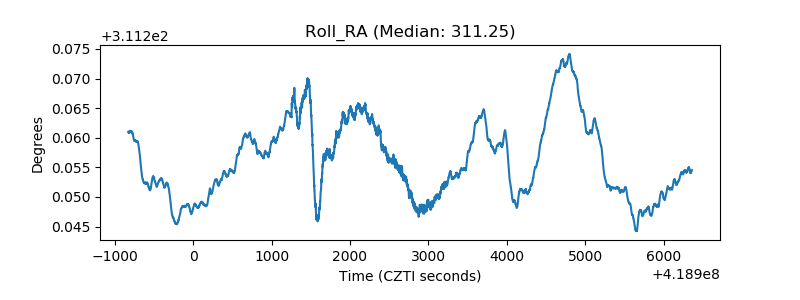 |
| Veto Counter | 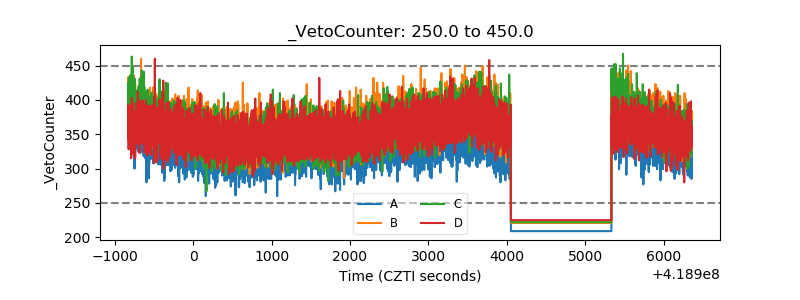 |