| Param | Original file | Final file |
|---|---|---|
| Filename | modeM0/AS1A12_066T01_9000005562_40744cztM0_level2.fits | modeM0/AS1A12_066T01_9000005562_40744cztM0_level2_quad_clean.evt |
| Size (bytes) | 1,309,109,760 | 232,332,480 |
| Size | 1.2 GB | 221.6 MB |
| Events in quadrant A | 8,773,470 | 1,664,267 |
| Events in quadrant B | 7,676,454 | 1,685,406 |
| Events in quadrant C | 17,358,347 | 1,369,366 |
| Events in quadrant D | 13,456,583 | 1,248,766 |
| Mode M0 | |||
|---|---|---|---|
| Quadrant | BADHDUFLAG | Total packets | Discarded packets |
| A | 0 | 35111 | 4 |
| B | 0 | 33045 | 3 |
| C | 0 | 62093 | 3 |
| D | 0 | 50655 | 3 |
| Mode M9 | |||
|---|---|---|---|
| Quadrant | BADHDUFLAG | Total packets | Discarded packets |
| A | 0 | 42 | 0 |
| B | 0 | 42 | 0 |
| C | 0 | 42 | 0 |
| D | 0 | 42 | 0 |
| Mode SS | |||
|---|---|---|---|
| Quadrant | BADHDUFLAG | Total packets | Discarded packets |
| A | 0 | 316 | 0 |
| B | 0 | 316 | 0 |
| C | 0 | 316 | 0 |
| D | 0 | 316 | 0 |
| Quadrant | Total seconds | Saturated seconds | Saturation percentage |
|---|---|---|---|
| A | 15440 | 34 | 0.220207% |
| B | 15440 | 159 | 1.029793% |
| C | 15440 | 2665 | 17.260363% |
| D | 15440 | 2840 | 18.393782% |
Noise dominated data is calculated using 1-second bins in cleaned event files. If a bin has >2000 counts, and if more than 50% of those come from <1% of pixels, then it is considered to be noise-dominated and hence unusable.
| Quadrant | # 1 sec bins | Bins with >0 counts | Bins with >2000 counts | High rate bins dominated by noise | Noise dominated (total time) | Noise dominated (detector-on time) | Marked lightcurve |
|---|---|---|---|---|---|---|---|
| A | 19618 | 15443 | 13 | 13 | 0.07% | 0.08% | 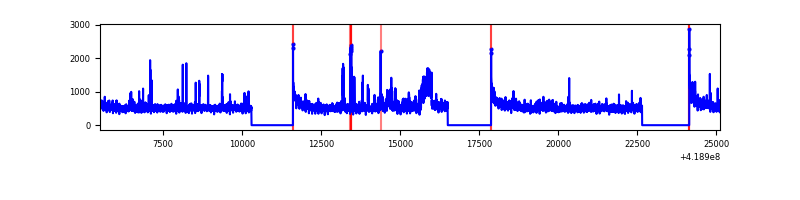 |
| B | 19618 | 15443 | 83 | 83 | 0.42% | 0.54% | 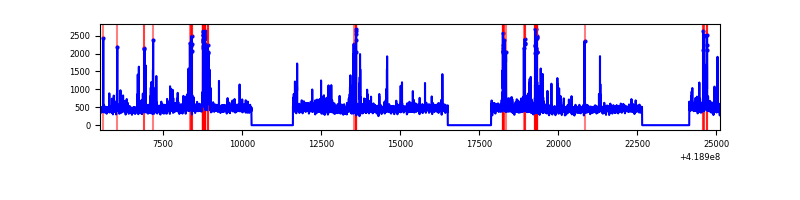 |
| C | 19618 | 15442 | 2553 | 2553 | 13.01% | 16.53% | 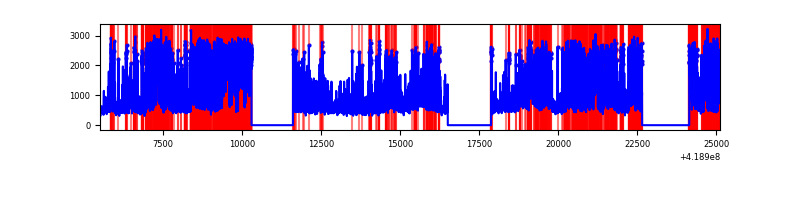 |
| D | 19618 | 15443 | 837 | 837 | 4.27% | 5.42% | 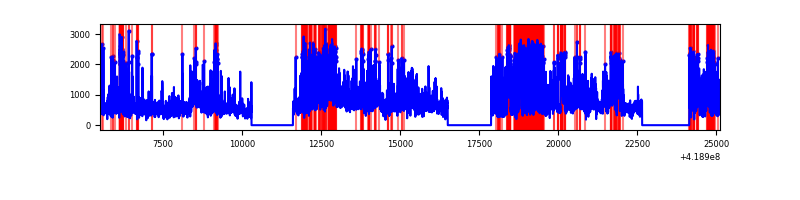 |
Top three noisy pixels from each quadrant. If the there are fewer than three noisy pixels in the level2.evt file, extra rows are filled as -1
| Pixel properties | Quadrant properties | ||||||
|---|---|---|---|---|---|---|---|
| Quadrant | DetID | PixID | Counts | Sigma | Mean | Median | Sigma |
| A | 10 | 83 | 1291795 | 3690.81 | 1715 | 1679 | 349.5 |
| A | 6 | 10 | 412821 | 1176.21 | 1715 | 1679 | 349.5 |
| A | 12 | 189 | 397911 | 1133.55 | 1715 | 1679 | 349.5 |
| B | 0 | 229 | 454881 | 1396.29 | 1698 | 1649 | 324.6 |
| B | 15 | 85 | 203112 | 620.65 | 1698 | 1649 | 324.6 |
| B | 4 | 170 | 138002 | 420.07 | 1698 | 1649 | 324.6 |
| C | 9 | 187 | 10167541 | 27997.42 | 1565 | 1575 | 363.1 |
| C | 15 | 214 | 613261 | 1684.6 | 1565 | 1575 | 363.1 |
| C | 14 | 254 | 404975 | 1110.98 | 1565 | 1575 | 363.1 |
| D | 12 | 128 | 5298224 | 13728.19 | 1545 | 1501 | 385.8 |
| D | 2 | 249 | 496692 | 1283.45 | 1545 | 1501 | 385.8 |
| D | 12 | 191 | 482375 | 1246.34 | 1545 | 1501 | 385.8 |
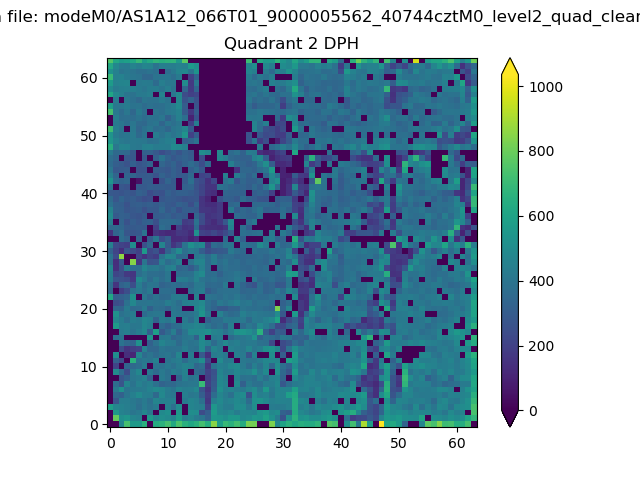
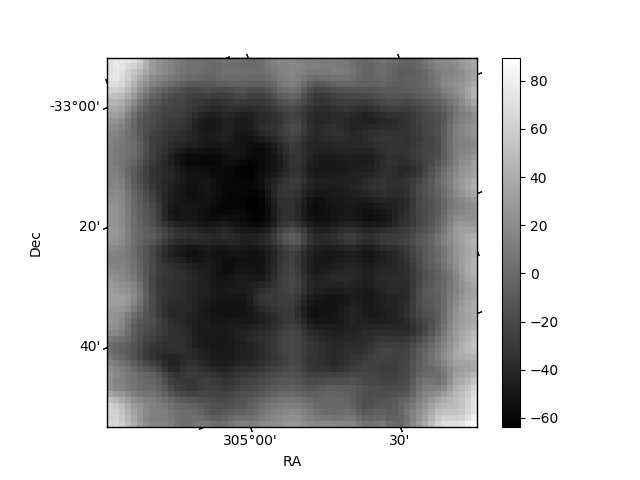
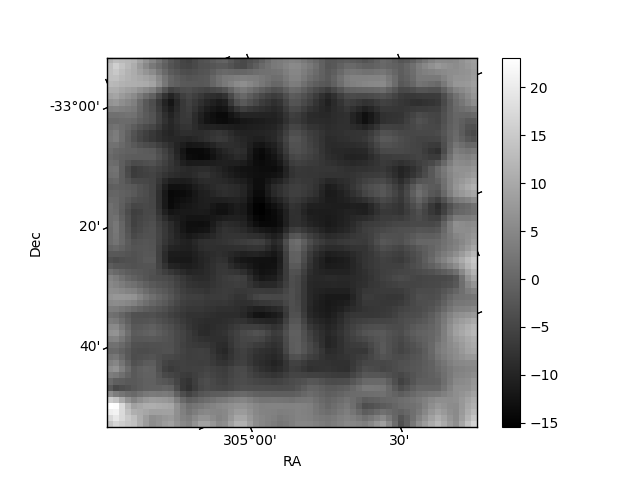
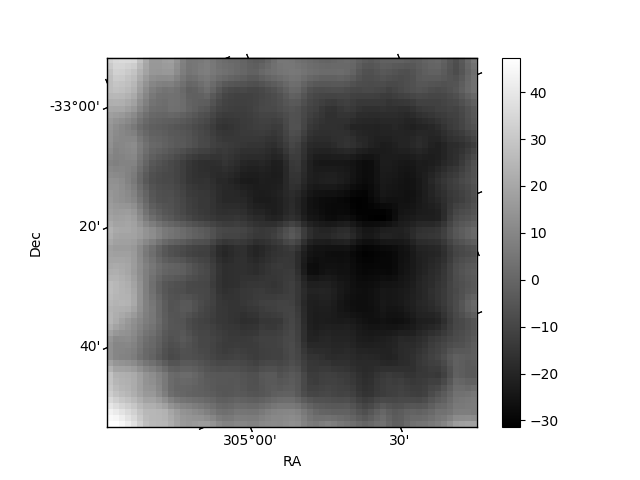
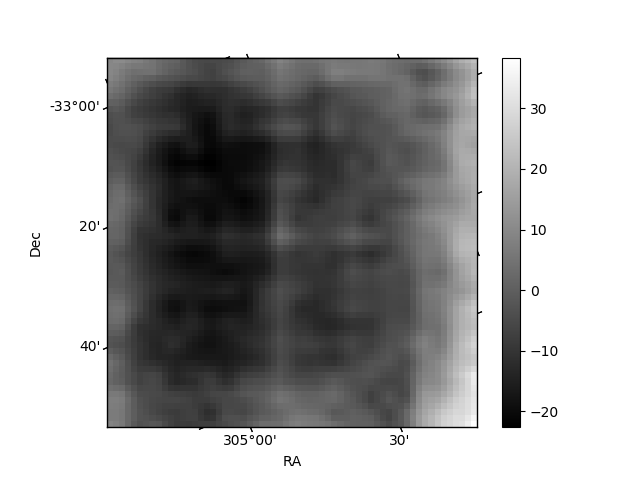
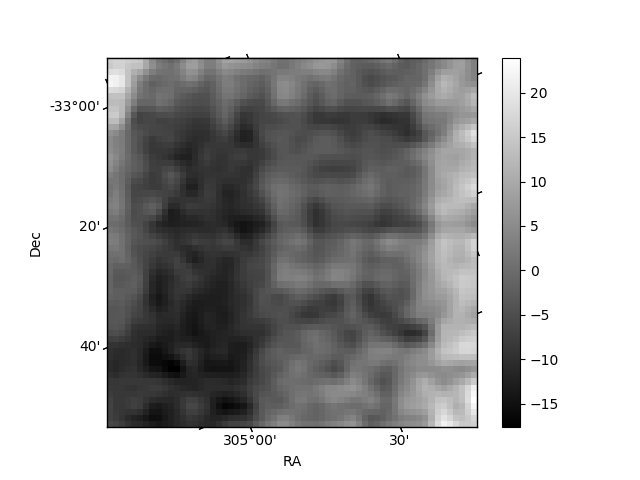
Histogram calculated using DETX and DETY for each event in the final _common_clean file
| Quadrant A | 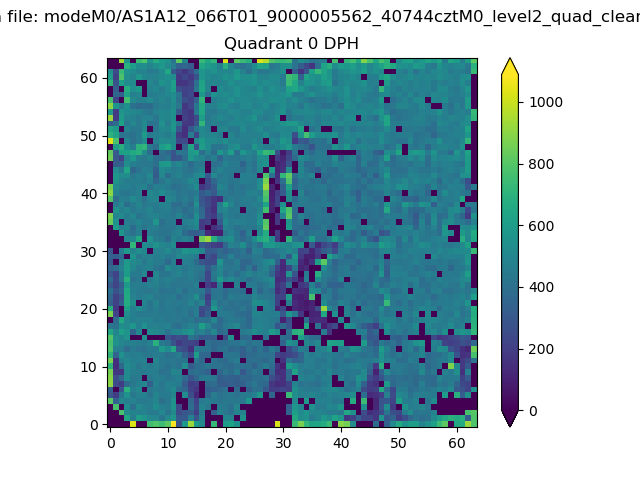 |
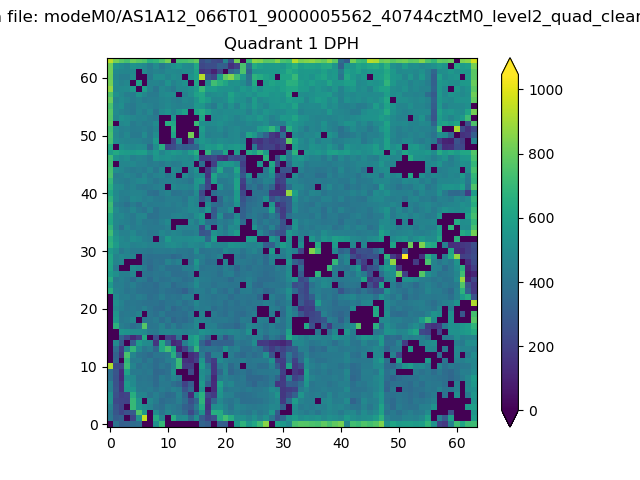 |
Quadrant B |
|---|---|---|---|
| Quadrant D | 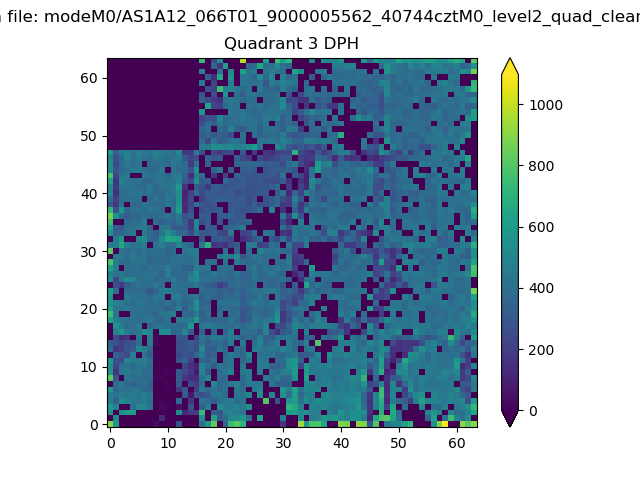 |
 |
Quadrant C |
| Plot type | Count rate plots | Images |
|---|---|---|
| Comparison with Poisson distribution Blue bars denote a histogram of data divided into 1 sec bins. Red curve is a Poisson curve with rate = median count rate of data. |
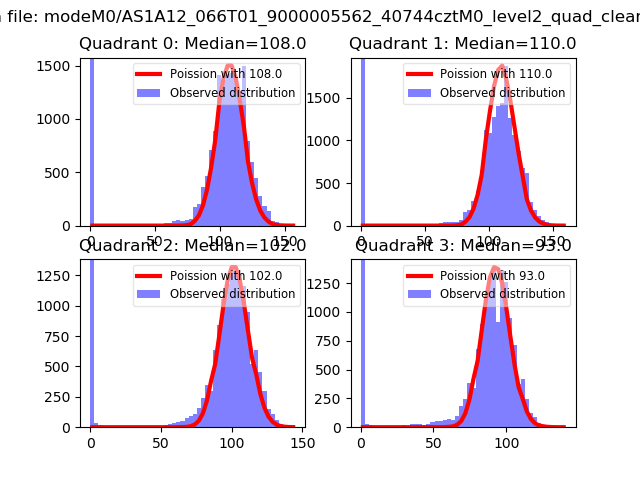 |
 |
| Quadrant-wise count rates Data is divided into 100 sec bins |
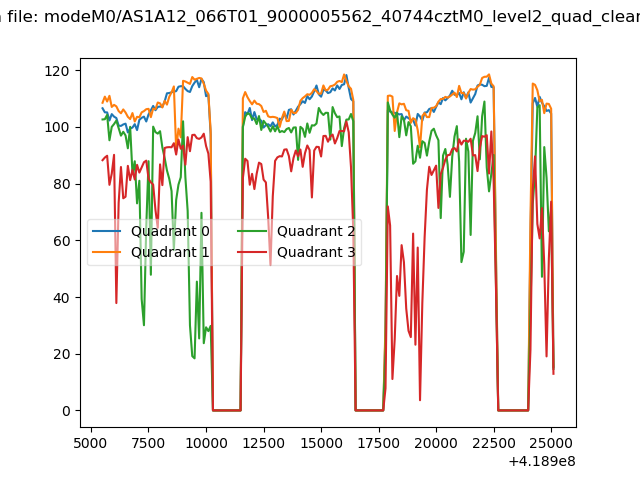 |
|
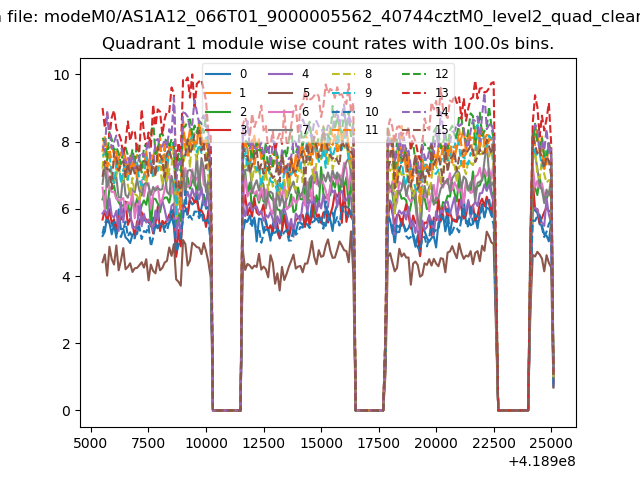
| Module-wise count rates for Quadrant A Data is divided into 100 sec bins |
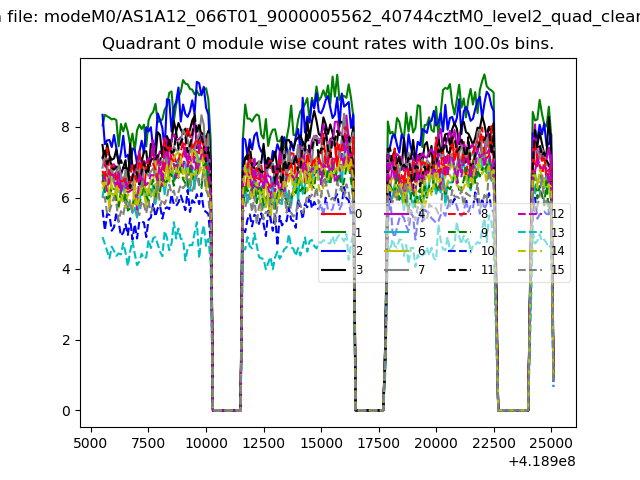 |
 |
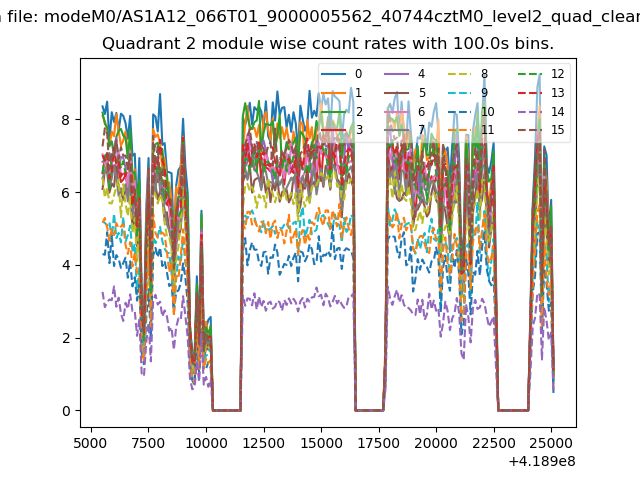
| Module-wise count rates for Quadrant B Data is divided into 100 sec bins |
 |
 |
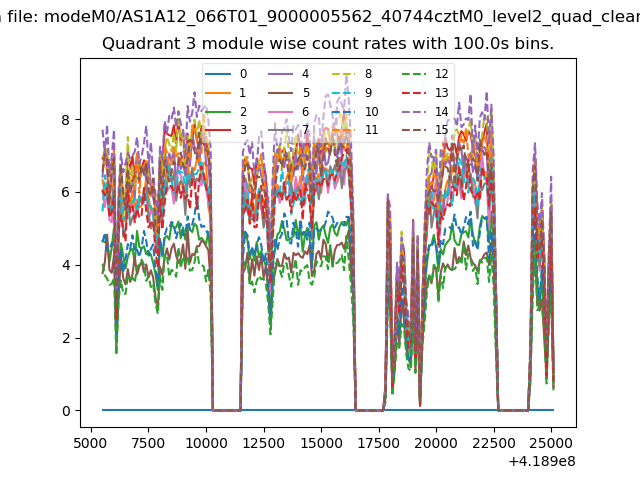
| Module-wise count rates for Quadrant C Data is divided into 100 sec bins |
 |
 |
| Module-wise count rates for Quadrant D Data is divided into 100 sec bins |
 |
 |
| Parameter | Plot |
|---|---|
| CZT HV Monitor | 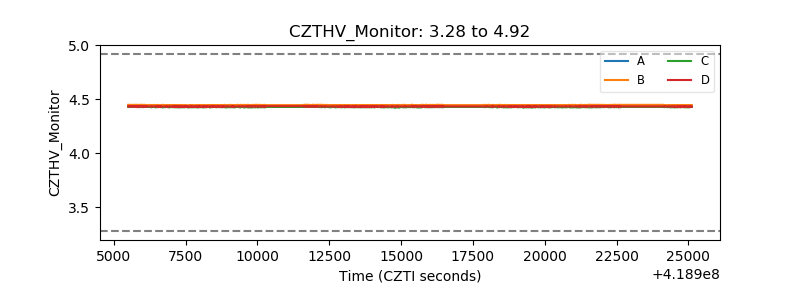 |
| D_VDD | 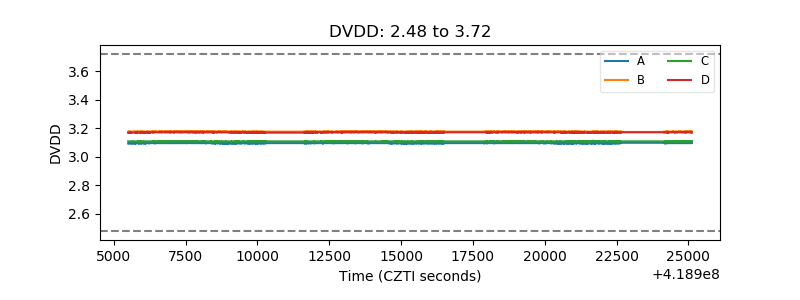 |
| Temperature 1 | 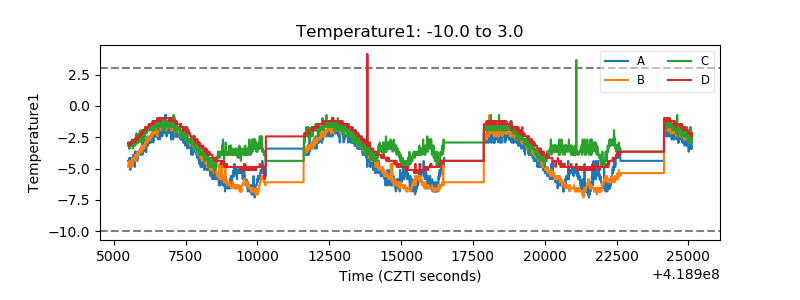 |
| Veto HV Monitor | 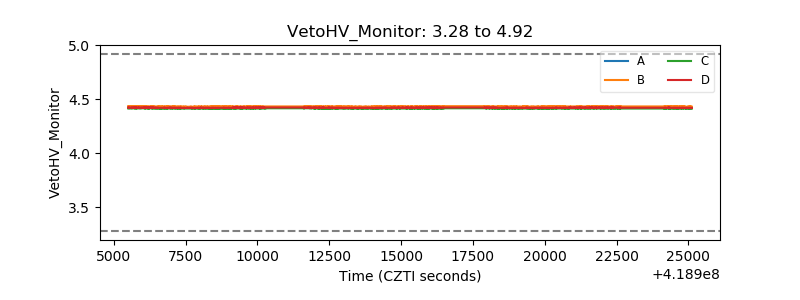 |
| Veto LLD | 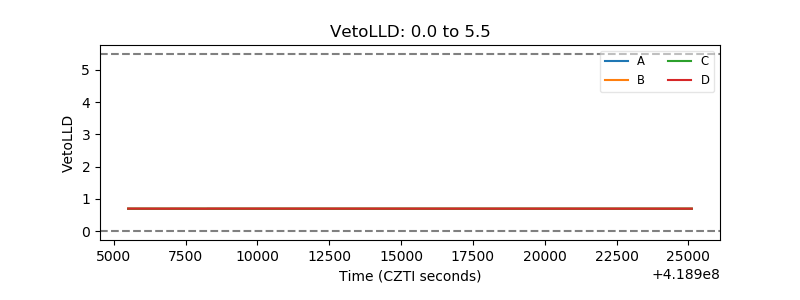 |
| Alpha Counter | 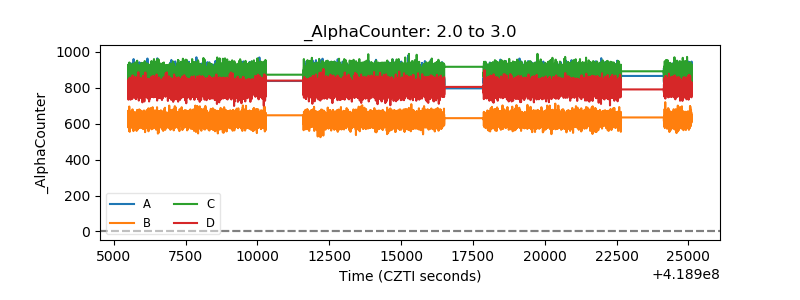 |
| _CPM_Rate | 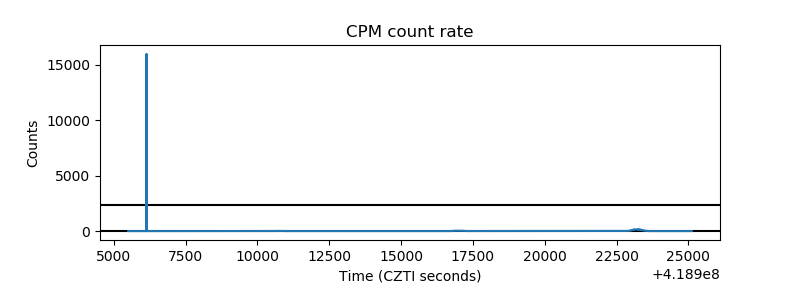 |
| CZT Counter | 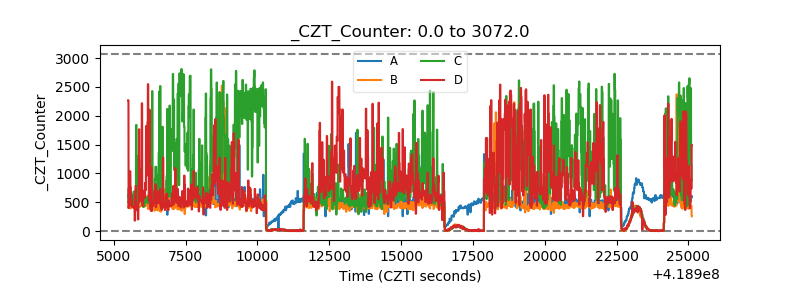 |
| +2.5 Volts monitor | 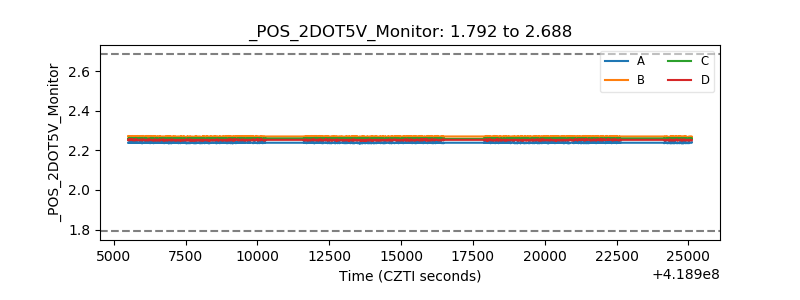 |
| +5 Volts monitor | 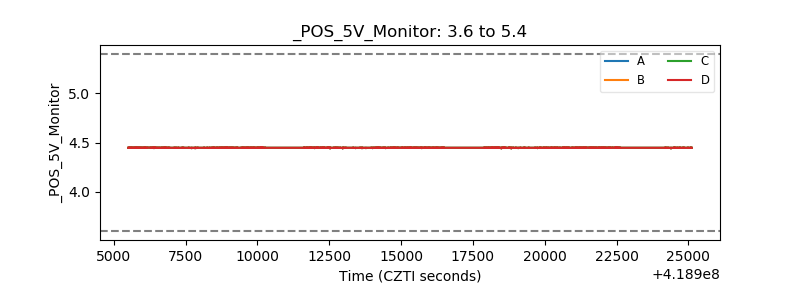 |
| _ROLL_ROT | 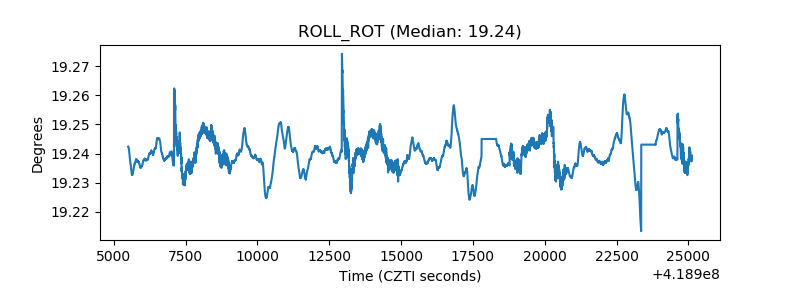 |
| _Roll_DEC | 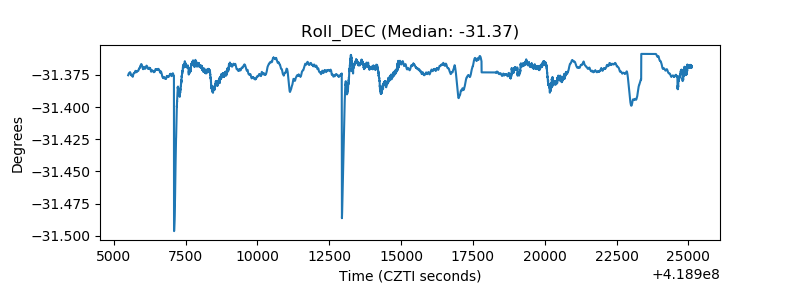 |
| _Roll_RA | 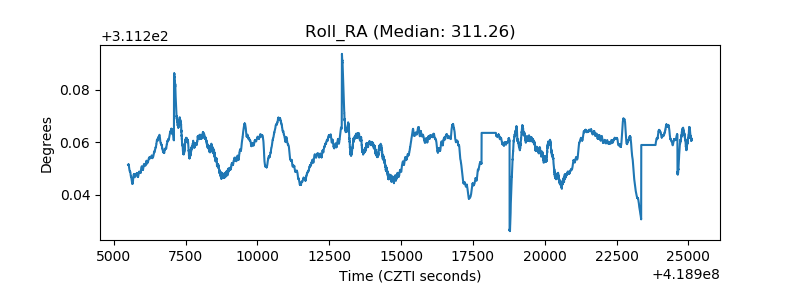 |
| Veto Counter | 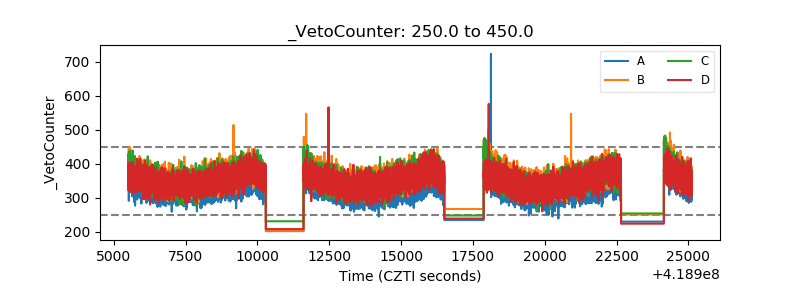 |