| Param | Original file | Final file |
|---|---|---|
| Filename | modeM0/AS1A12_066T01_9000005562_40745cztM0_level2.fits | modeM0/AS1A12_066T01_9000005562_40745cztM0_level2_quad_clean.evt |
| Size (bytes) | 514,794,240 | 84,637,440 |
| Size | 490.9 MB | 80.7 MB |
| Events in quadrant A | 3,225,609 | 620,624 |
| Events in quadrant B | 2,632,021 | 626,613 |
| Events in quadrant C | 7,482,083 | 452,267 |
| Events in quadrant D | 5,282,913 | 473,251 |
| Mode M0 | |||
|---|---|---|---|
| Quadrant | BADHDUFLAG | Total packets | Discarded packets |
| A | 0 | 12957 | 3 |
| B | 0 | 11610 | 2 |
| C | 0 | 25995 | 2 |
| D | 0 | 19629 | 2 |
| Mode M9 | |||
|---|---|---|---|
| Quadrant | BADHDUFLAG | Total packets | Discarded packets |
| A | 0 | 19 | 0 |
| B | 0 | 19 | 0 |
| C | 0 | 19 | 0 |
| D | 0 | 20 | 0 |
| Mode SS | |||
|---|---|---|---|
| Quadrant | BADHDUFLAG | Total packets | Discarded packets |
| A | 0 | 112 | 0 |
| B | 0 | 112 | 0 |
| C | 0 | 112 | 0 |
| D | 0 | 112 | 0 |
| Quadrant | Total seconds | Saturated seconds | Saturation percentage |
|---|---|---|---|
| A | 5573 | 29 | 0.520366% |
| B | 5573 | 24 | 0.430648% |
| C | 5573 | 1656 | 29.714696% |
| D | 5573 | 1112 | 19.953346% |
Noise dominated data is calculated using 1-second bins in cleaned event files. If a bin has >2000 counts, and if more than 50% of those come from <1% of pixels, then it is considered to be noise-dominated and hence unusable.
| Quadrant | # 1 sec bins | Bins with >0 counts | Bins with >2000 counts | High rate bins dominated by noise | Noise dominated (total time) | Noise dominated (detector-on time) | Marked lightcurve |
|---|---|---|---|---|---|---|---|
| A | 7186 | 5574 | 14 | 14 | 0.19% | 0.25% | 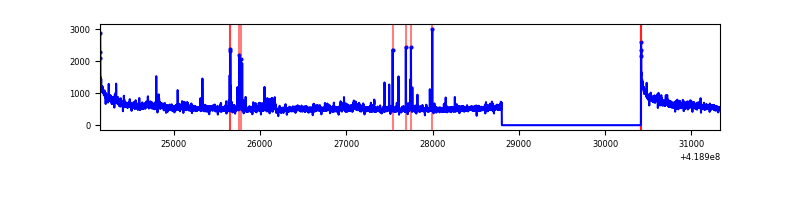 |
| B | 7186 | 5574 | 9 | 9 | 0.13% | 0.16% | 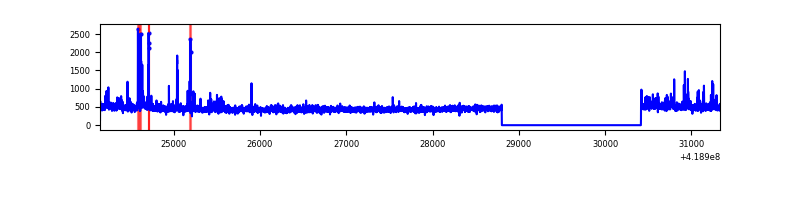 |
| C | 7186 | 5574 | 1597 | 1597 | 22.22% | 28.65% | 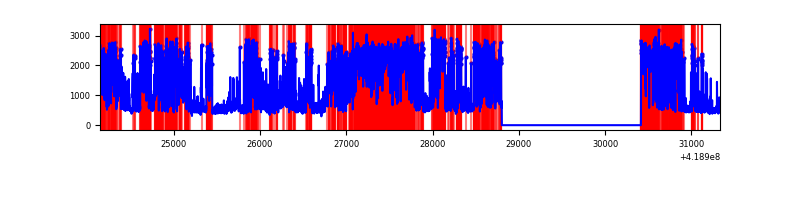 |
| D | 7186 | 5574 | 197 | 197 | 2.74% | 3.53% | 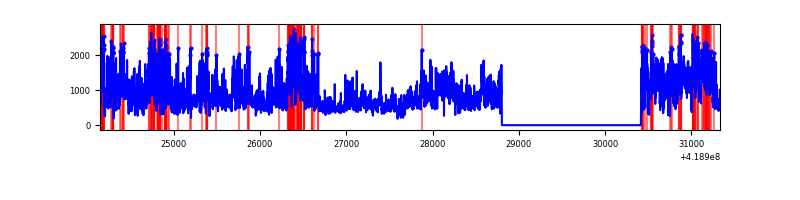 |
Top three noisy pixels from each quadrant. If the there are fewer than three noisy pixels in the level2.evt file, extra rows are filled as -1
| Pixel properties | Quadrant properties | ||||||
|---|---|---|---|---|---|---|---|
| Quadrant | DetID | PixID | Counts | Sigma | Mean | Median | Sigma |
| A | 10 | 83 | 544252 | 4222.99 | 623 | 609 | 128.7 |
| A | 12 | 189 | 99983 | 771.93 | 623 | 609 | 128.7 |
| A | 6 | 10 | 85911 | 662.62 | 623 | 609 | 128.7 |
| B | 15 | 85 | 77176 | 628.4 | 618 | 599 | 121.9 |
| B | 4 | 170 | 35499 | 286.39 | 618 | 599 | 121.9 |
| B | 0 | 190 | 33313 | 268.45 | 618 | 599 | 121.9 |
| C | 9 | 187 | 5073749 | 40189.91 | 536 | 537 | 126.2 |
| C | 15 | 214 | 211501 | 1671.25 | 536 | 537 | 126.2 |
| C | 0 | 10 | 56599 | 444.12 | 536 | 537 | 126.2 |
| D | 12 | 128 | 2363003 | 17115.55 | 557 | 541 | 138.0 |
| D | 12 | 191 | 183039 | 1322.16 | 557 | 541 | 138.0 |
| D | 13 | 249 | 139647 | 1007.79 | 557 | 541 | 138.0 |
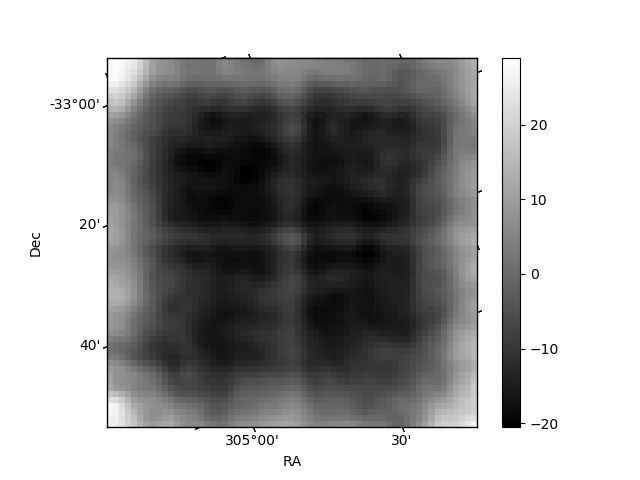
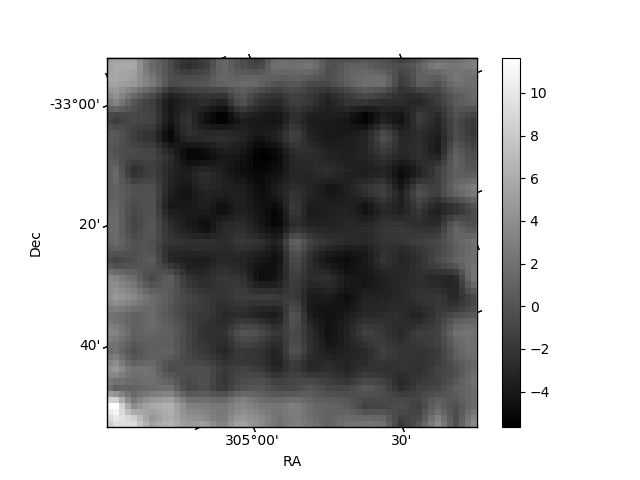
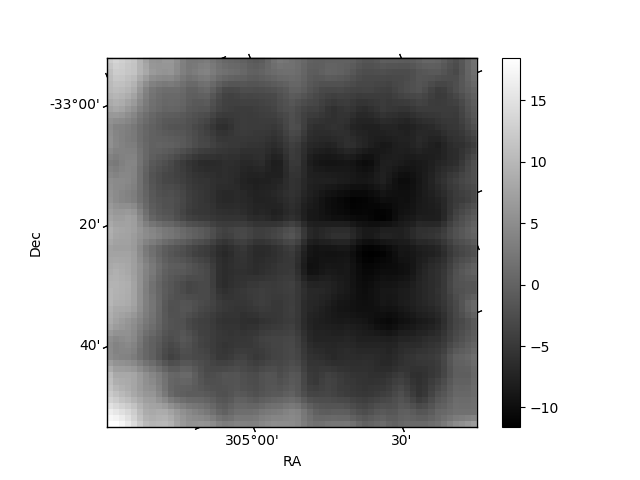
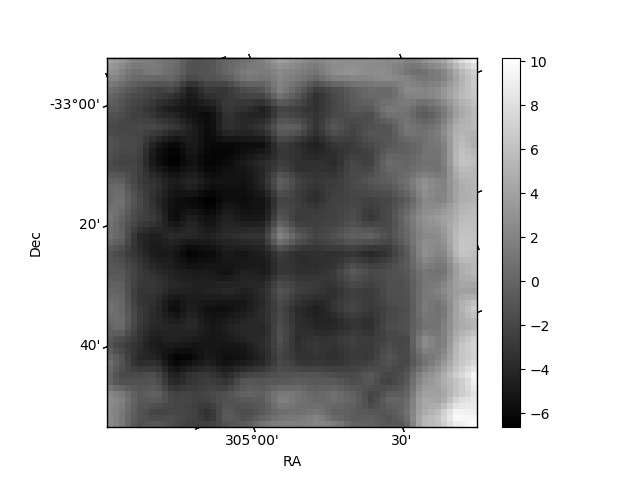
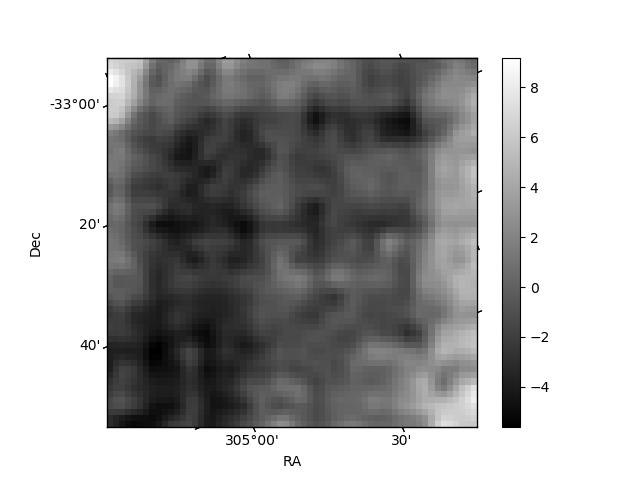
Histogram calculated using DETX and DETY for each event in the final _common_clean file
| Quadrant A | 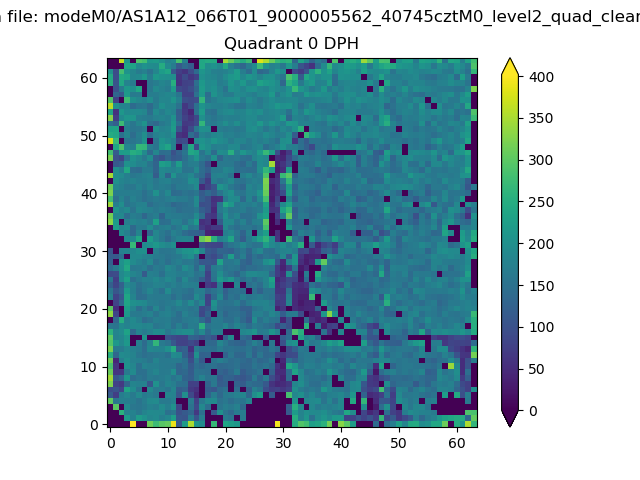 |
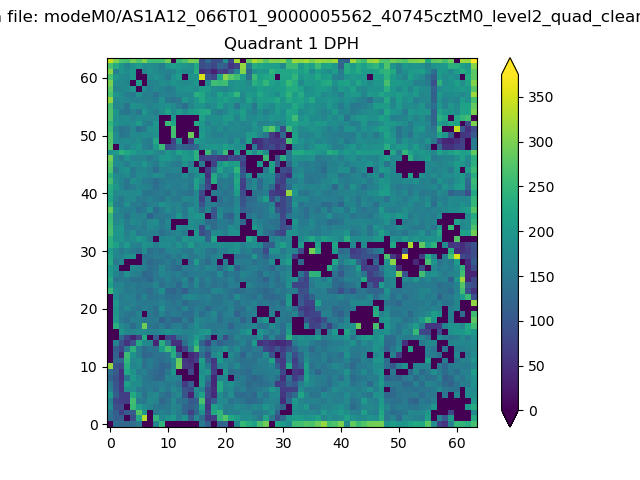 |
Quadrant B |
|---|---|---|---|
| Quadrant D | 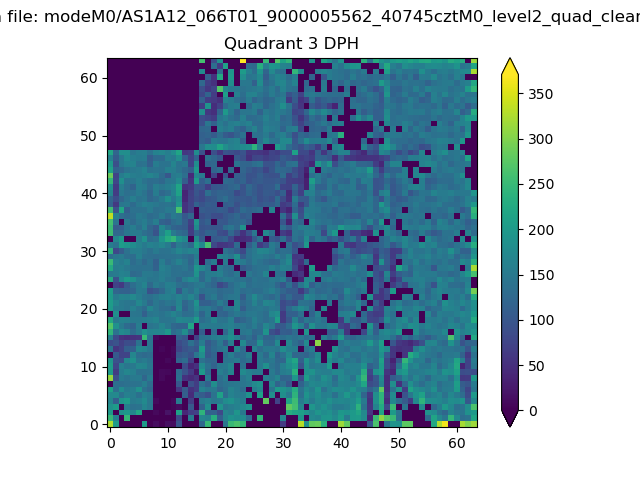 |
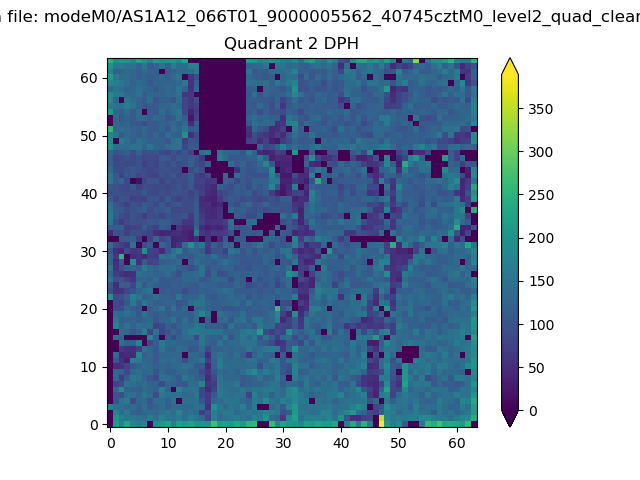 |
Quadrant C |
| Plot type | Count rate plots | Images |
|---|---|---|
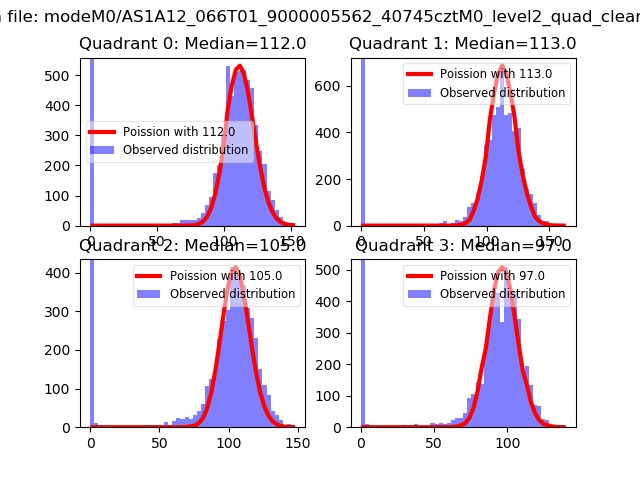
| Comparison with Poisson distribution Blue bars denote a histogram of data divided into 1 sec bins. Red curve is a Poisson curve with rate = median count rate of data. |
 |
 |
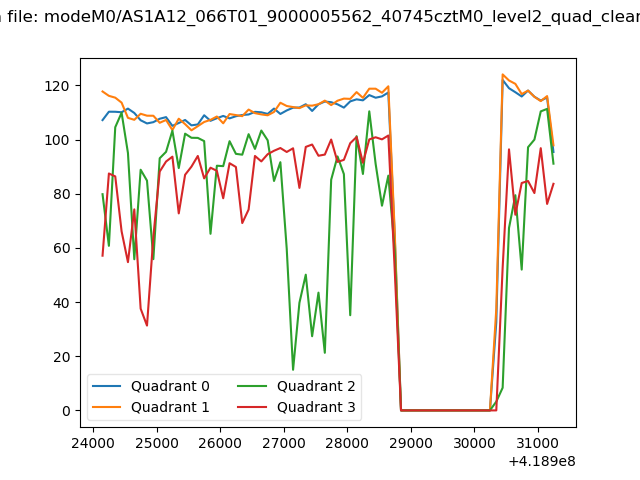
| Quadrant-wise count rates Data is divided into 100 sec bins |
 |
|
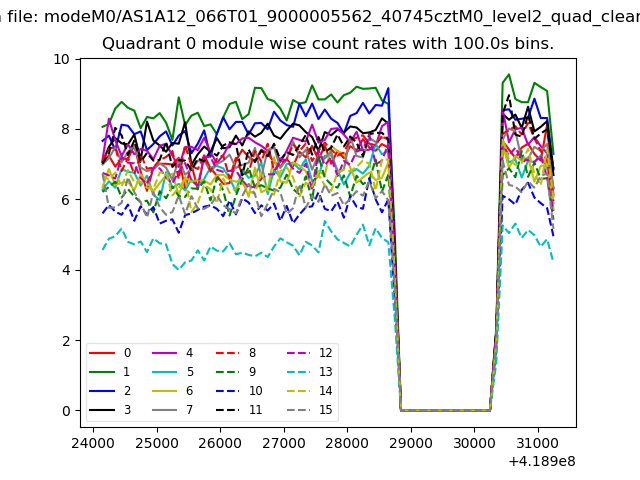
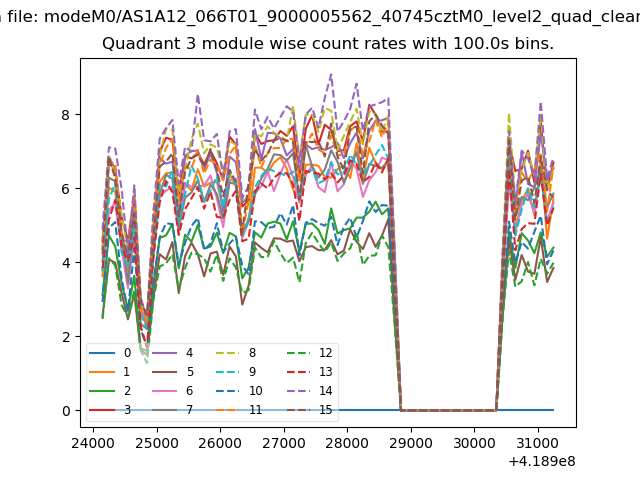
| Module-wise count rates for Quadrant A Data is divided into 100 sec bins |
 |
 |
| Module-wise count rates for Quadrant B Data is divided into 100 sec bins |
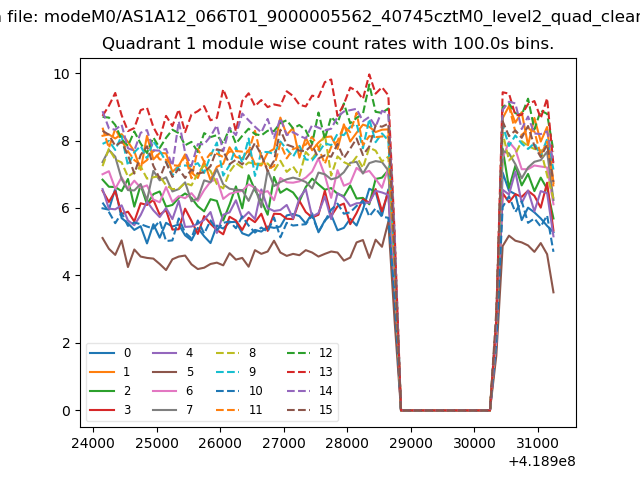 |
 |
| Module-wise count rates for Quadrant C Data is divided into 100 sec bins |
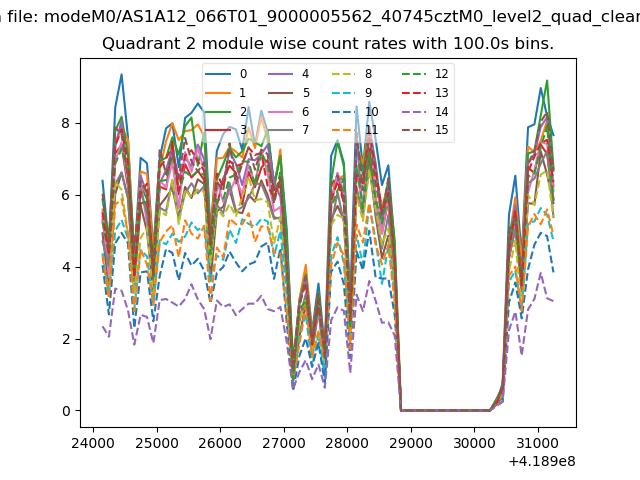 |
 |
| Module-wise count rates for Quadrant D Data is divided into 100 sec bins |
 |
 |
| Parameter | Plot |
|---|---|
| CZT HV Monitor | 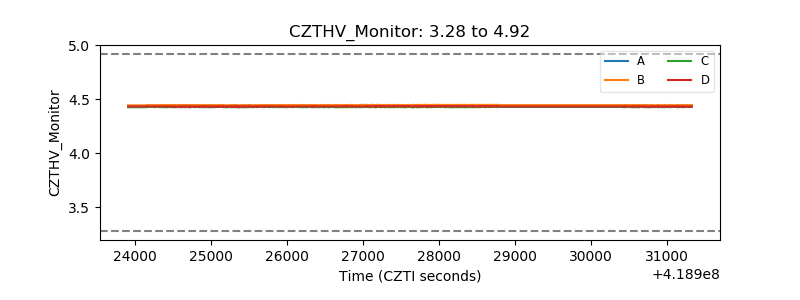 |
| D_VDD | 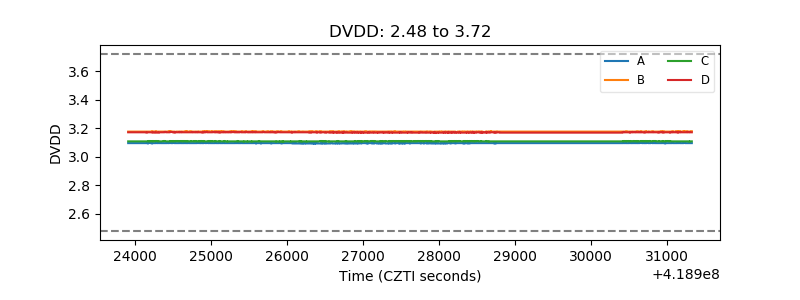 |
| Temperature 1 | 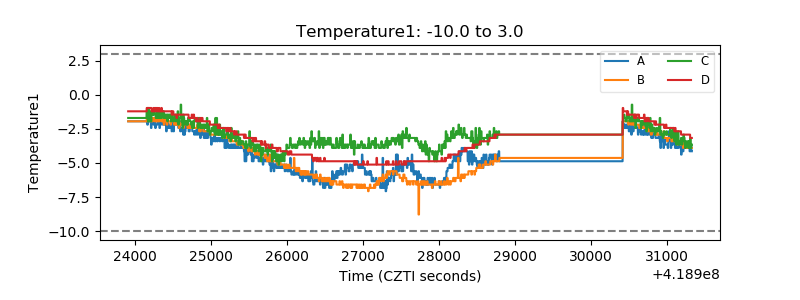 |
| Veto HV Monitor |  |
| Veto LLD | 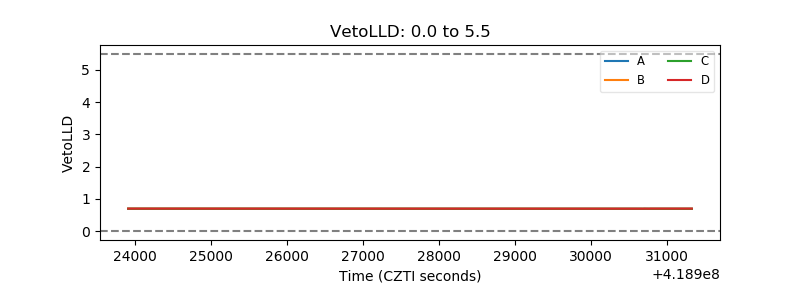 |
| Alpha Counter | 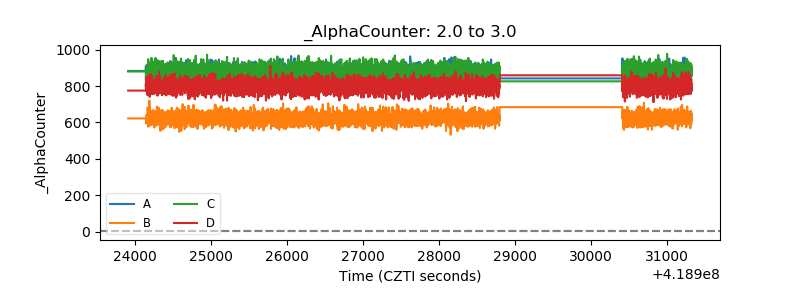 |
| _CPM_Rate | 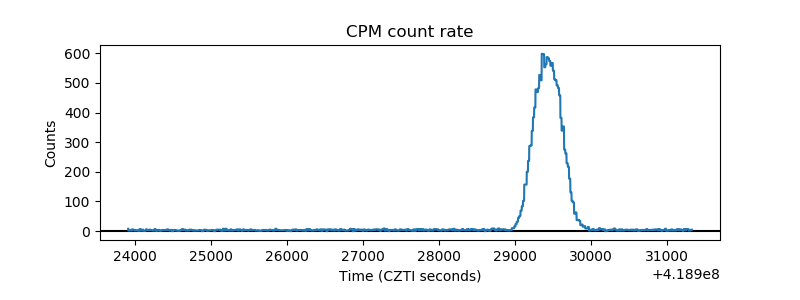 |
| CZT Counter | 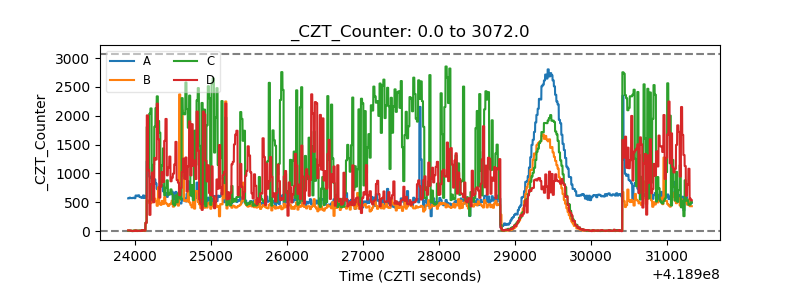 |
| +2.5 Volts monitor |  |
| +5 Volts monitor | 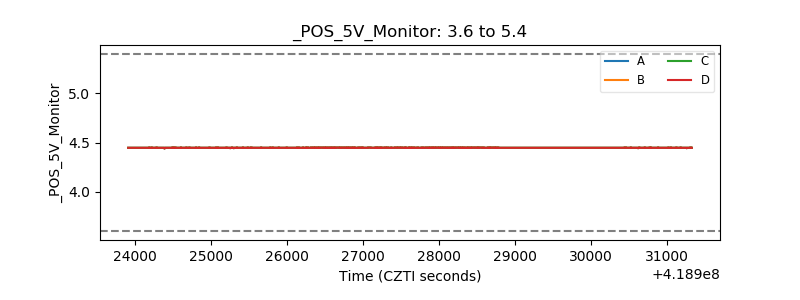 |
| _ROLL_ROT | 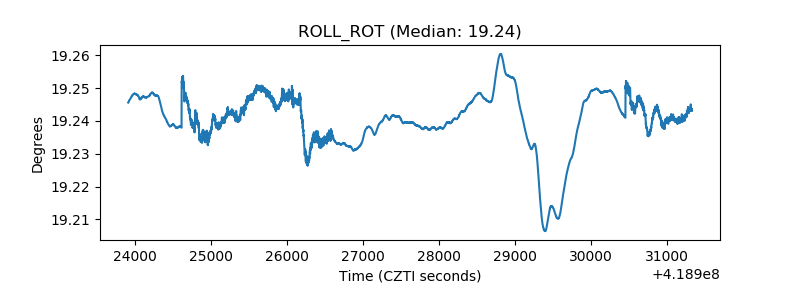 |
| _Roll_DEC | 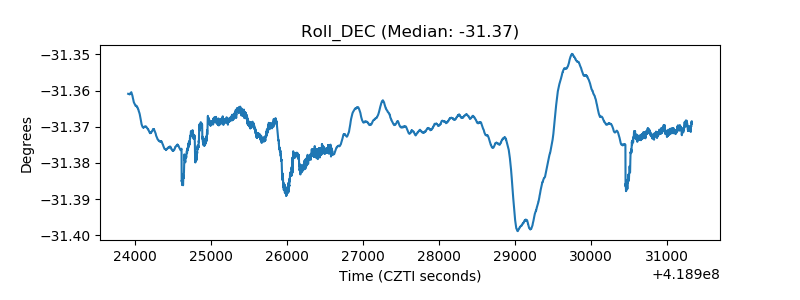 |
| _Roll_RA | 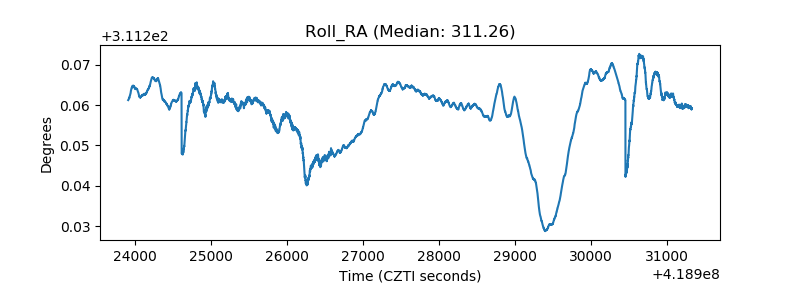 |
| Veto Counter | 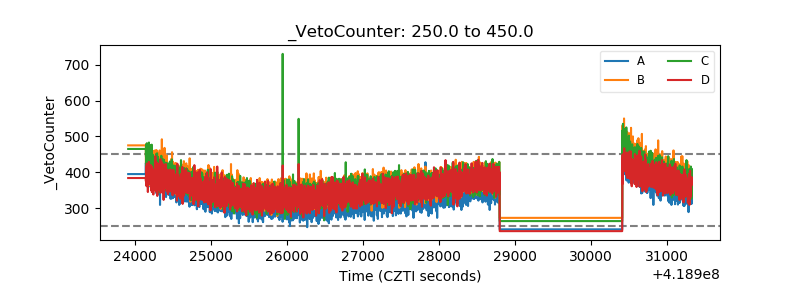 |