| Param | Original file | Final file |
|---|---|---|
| Filename | modeM0/AS1A12_066T01_9000005562_40747cztM0_level2.fits | modeM0/AS1A12_066T01_9000005562_40747cztM0_level2_quad_clean.evt |
| Size (bytes) | 187,007,040 | 33,307,200 |
| Size | 178.3 MB | 31.8 MB |
| Events in quadrant A | 1,249,735 | 244,567 |
| Events in quadrant B | 1,022,030 | 245,459 |
| Events in quadrant C | 2,429,283 | 191,962 |
| Events in quadrant D | 2,052,681 | 172,054 |
| Mode M0 | |||
|---|---|---|---|
| Quadrant | BADHDUFLAG | Total packets | Discarded packets |
| A | 0 | 5043 | 1 |
| B | 0 | 4464 | 1 |
| C | 0 | 8652 | 1 |
| D | 0 | 7590 | 1 |
| Mode M9 | |||
|---|---|---|---|
| Quadrant | BADHDUFLAG | Total packets | Discarded packets |
| A | 0 | 8 | 0 |
| B | 0 | 8 | 0 |
| C | 0 | 8 | 0 |
| D | 0 | 9 | 0 |
| Mode SS | |||
|---|---|---|---|
| Quadrant | BADHDUFLAG | Total packets | Discarded packets |
| A | 0 | 42 | 0 |
| B | 0 | 42 | 0 |
| C | 0 | 42 | 0 |
| D | 0 | 42 | 0 |
| Quadrant | Total seconds | Saturated seconds | Saturation percentage |
|---|---|---|---|
| A | 2137 | 9 | 0.421151% |
| B | 2137 | 8 | 0.374357% |
| C | 2137 | 440 | 20.589612% |
| D | 2137 | 575 | 26.906879% |
Noise dominated data is calculated using 1-second bins in cleaned event files. If a bin has >2000 counts, and if more than 50% of those come from <1% of pixels, then it is considered to be noise-dominated and hence unusable.
| Quadrant | # 1 sec bins | Bins with >0 counts | Bins with >2000 counts | High rate bins dominated by noise | Noise dominated (total time) | Noise dominated (detector-on time) | Marked lightcurve |
|---|---|---|---|---|---|---|---|
| A | 2137 | 2137 | 3 | 3 | 0.14% | 0.14% | 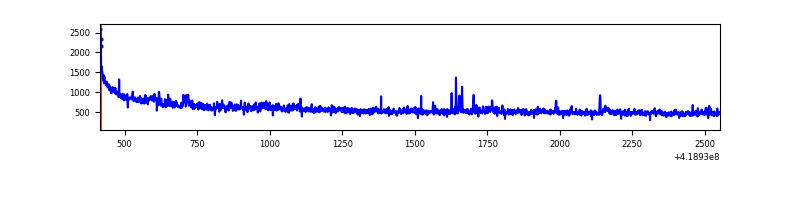 |
| B | 2137 | 2137 | 0 | 0 | 0.00% | 0.00% | 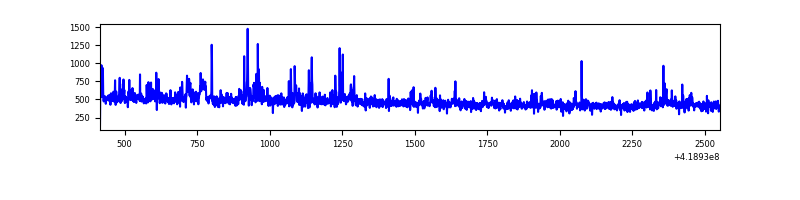 |
| C | 2137 | 2137 | 439 | 439 | 20.54% | 20.54% | 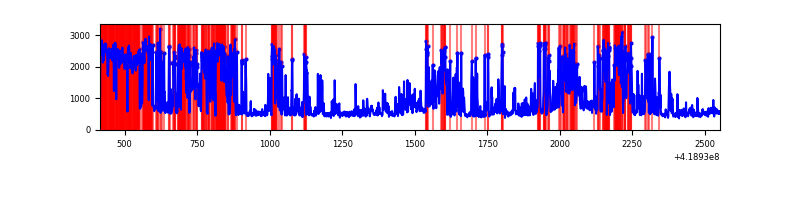 |
| D | 2137 | 2137 | 91 | 91 | 4.26% | 4.26% | 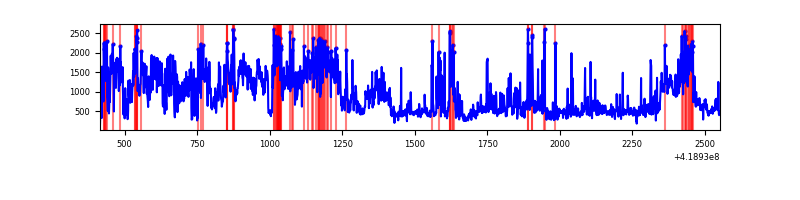 |
Top three noisy pixels from each quadrant. If the there are fewer than three noisy pixels in the level2.evt file, extra rows are filled as -1
| Pixel properties | Quadrant properties | ||||||
|---|---|---|---|---|---|---|---|
| Quadrant | DetID | PixID | Counts | Sigma | Mean | Median | Sigma |
| A | 10 | 83 | 236300 | 4612.84 | 241 | 236 | 51.2 |
| A | 12 | 189 | 34439 | 668.35 | 241 | 236 | 51.2 |
| A | 6 | 10 | 29133 | 564.67 | 241 | 236 | 51.2 |
| B | 0 | 190 | 23564 | 488.06 | 238 | 231 | 47.8 |
| B | 0 | 229 | 17271 | 356.43 | 238 | 231 | 47.8 |
| B | 4 | 171 | 16305 | 336.22 | 238 | 231 | 47.8 |
| C | 9 | 187 | 1474246 | 29255.47 | 210 | 210 | 50.4 |
| C | 15 | 214 | 85222 | 1687.25 | 210 | 210 | 50.4 |
| C | 0 | 10 | 47056 | 929.76 | 210 | 210 | 50.4 |
| D | 12 | 128 | 833728 | 15906.4 | 204 | 198 | 52.4 |
| D | 12 | 191 | 83121 | 1582.43 | 204 | 198 | 52.4 |
| D | 10 | 199 | 78837 | 1500.68 | 204 | 198 | 52.4 |
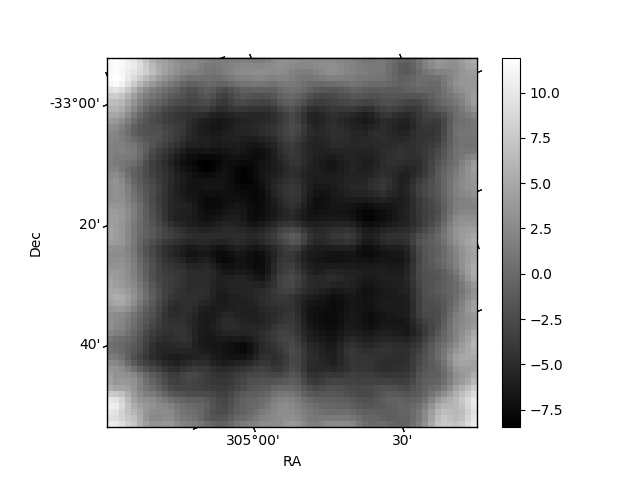
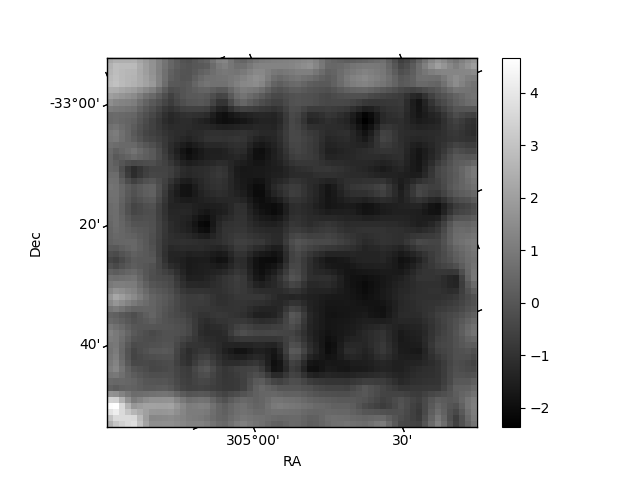
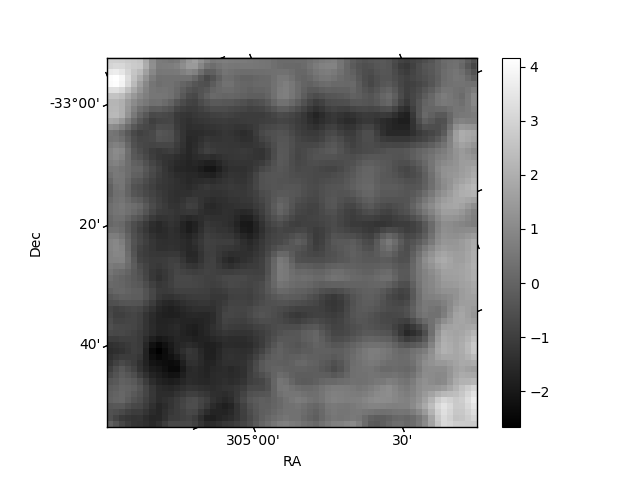
Histogram calculated using DETX and DETY for each event in the final _common_clean file
| Quadrant A | 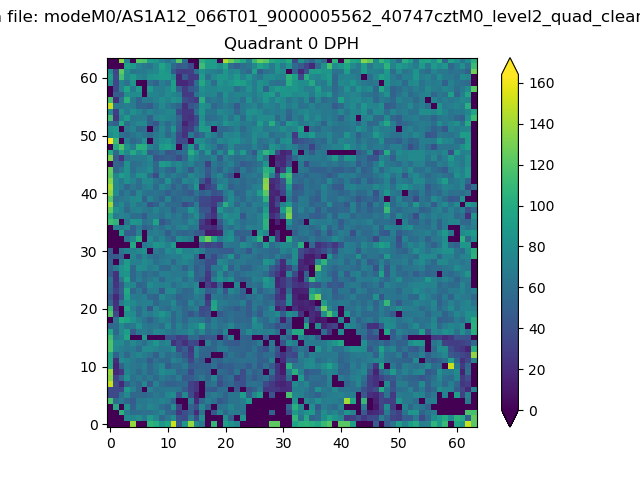 |
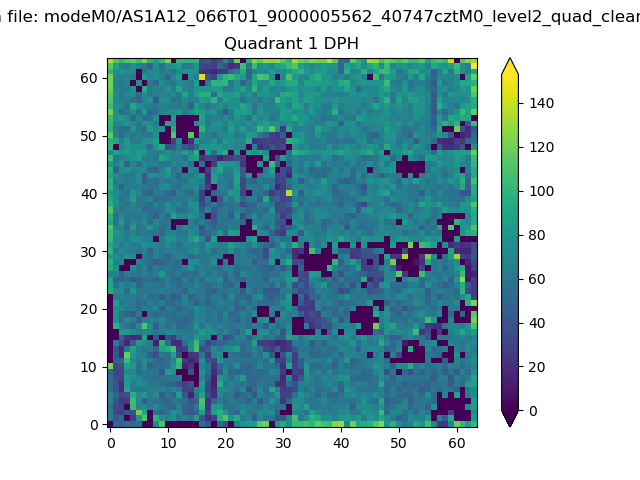 |
Quadrant B |
|---|---|---|---|
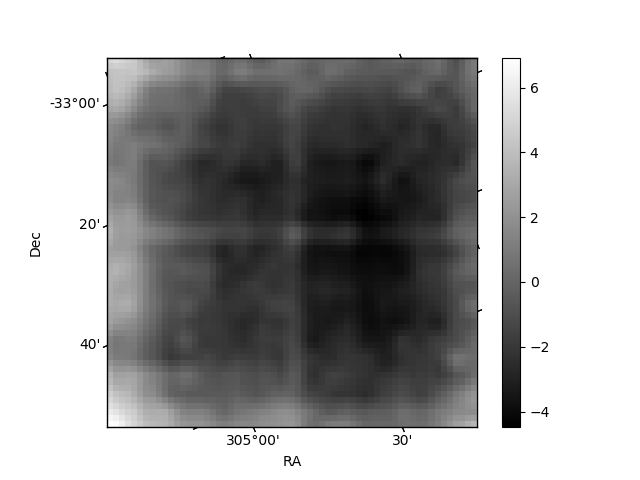
| Quadrant D | 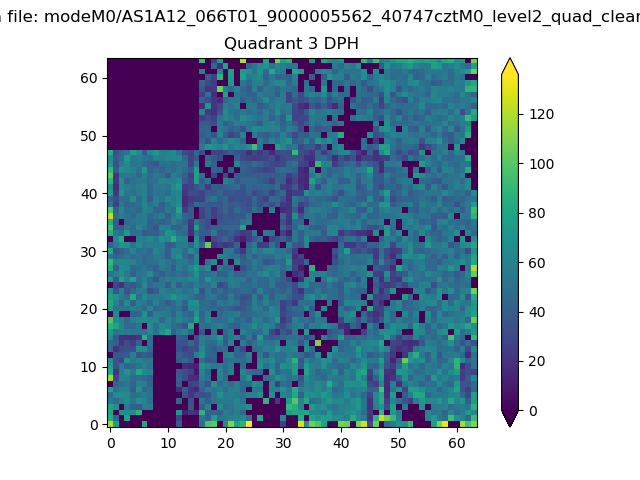 |
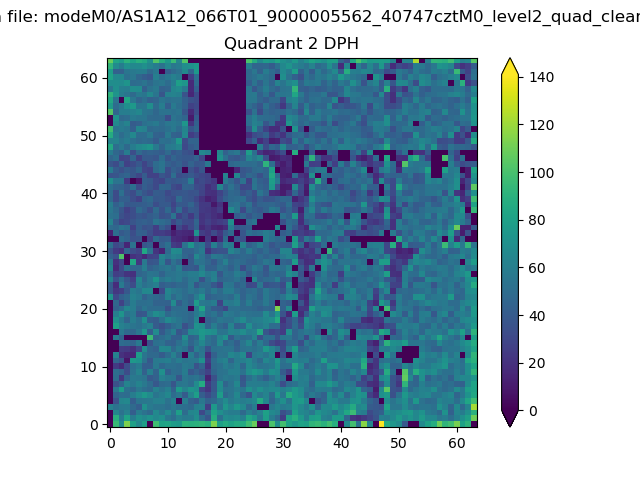 |
Quadrant C |
| Plot type | Count rate plots | Images |
|---|---|---|
| Comparison with Poisson distribution Blue bars denote a histogram of data divided into 1 sec bins. Red curve is a Poisson curve with rate = median count rate of data. |
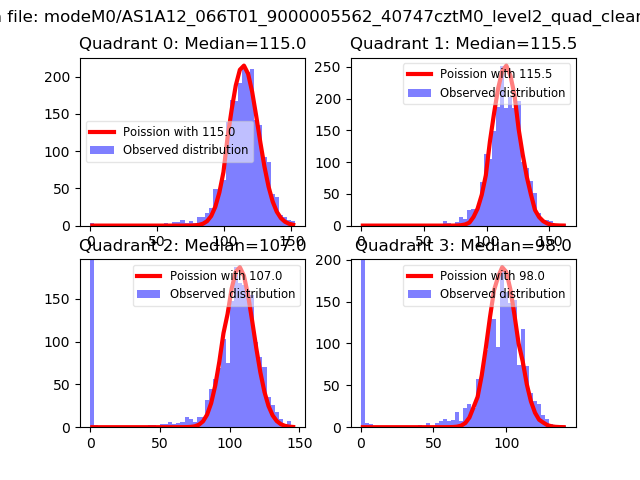 |
 |
| Quadrant-wise count rates Data is divided into 100 sec bins |
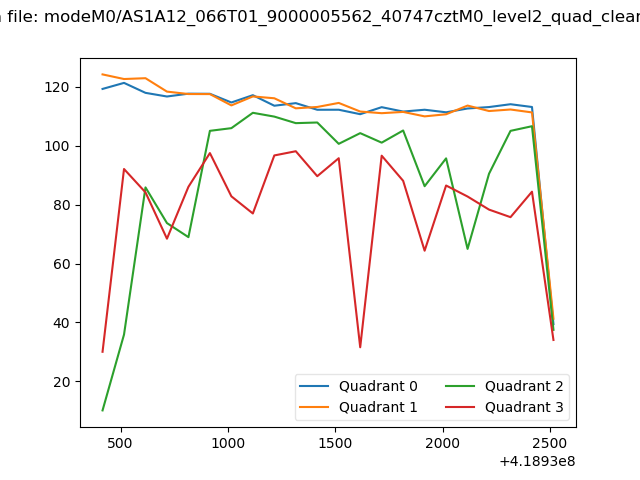 |
|
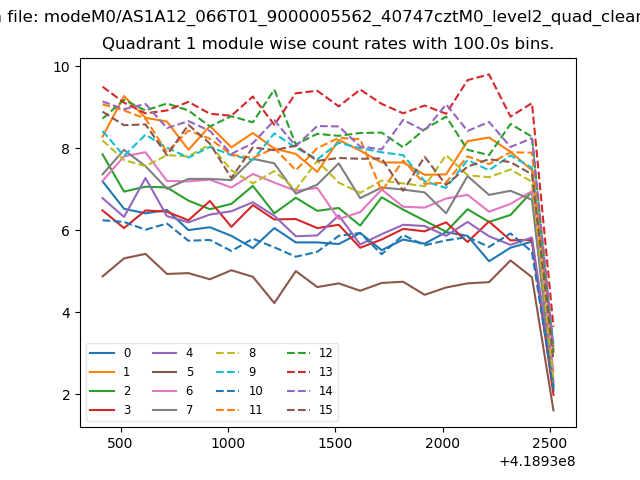
| Module-wise count rates for Quadrant A Data is divided into 100 sec bins |
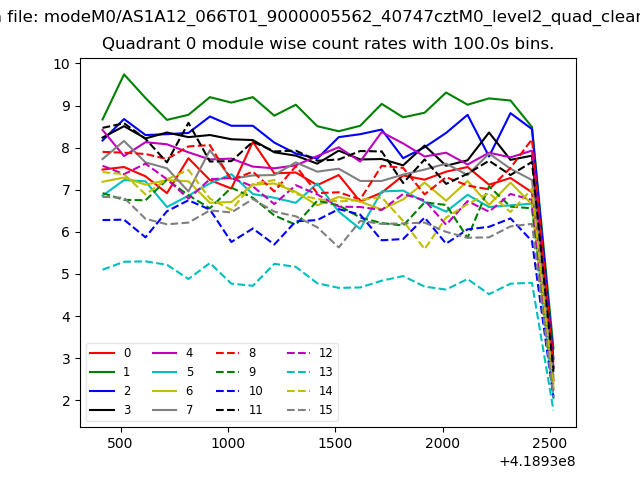 |
 |
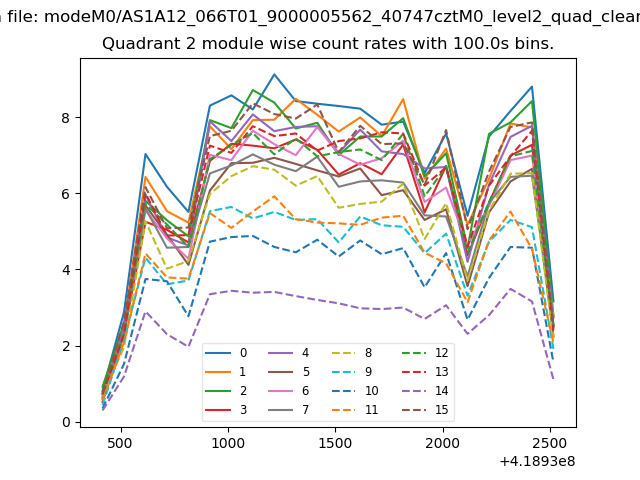
| Module-wise count rates for Quadrant B Data is divided into 100 sec bins |
 |
 |
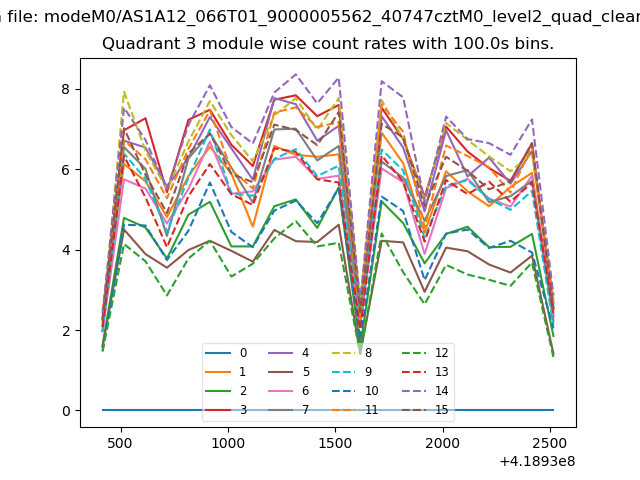
| Module-wise count rates for Quadrant C Data is divided into 100 sec bins |
 |
 |
| Module-wise count rates for Quadrant D Data is divided into 100 sec bins |
 |
 |
| Parameter | Plot |
|---|---|
| CZT HV Monitor | 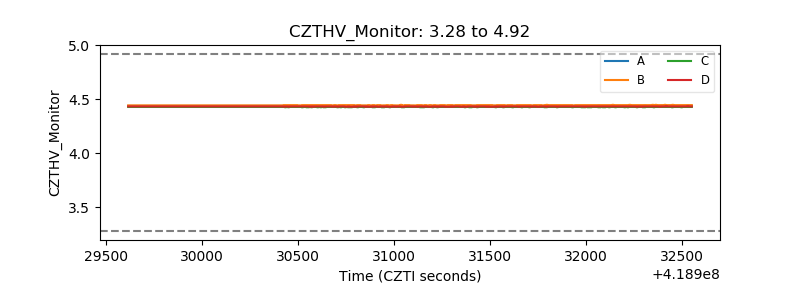 |
| D_VDD | 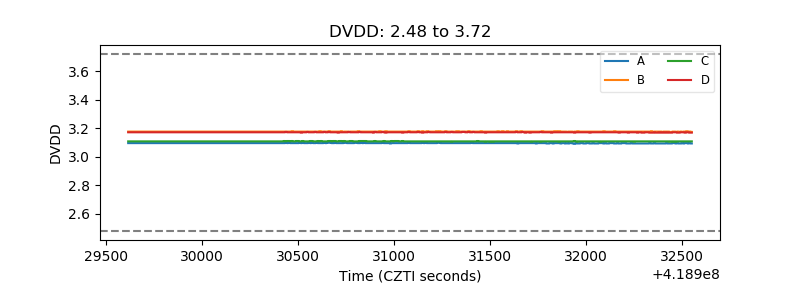 |
| Temperature 1 | 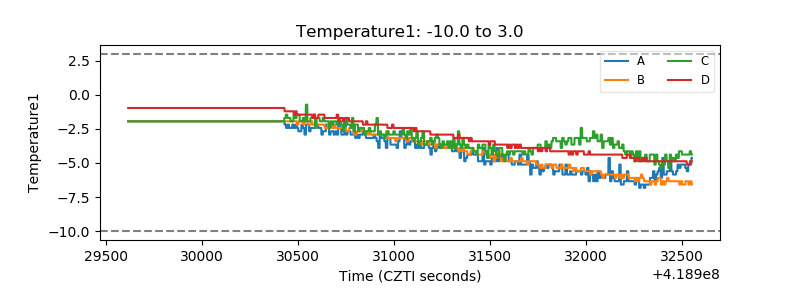 |
| Veto HV Monitor | 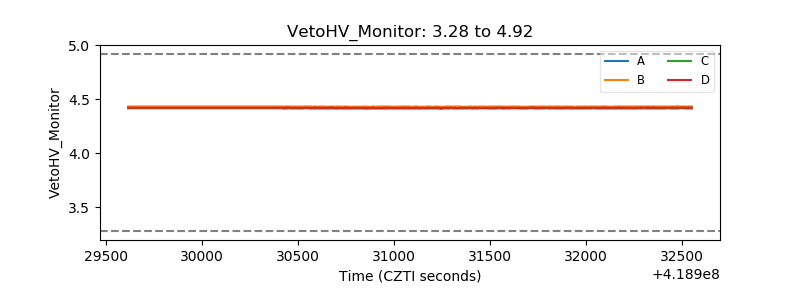 |
| Veto LLD | 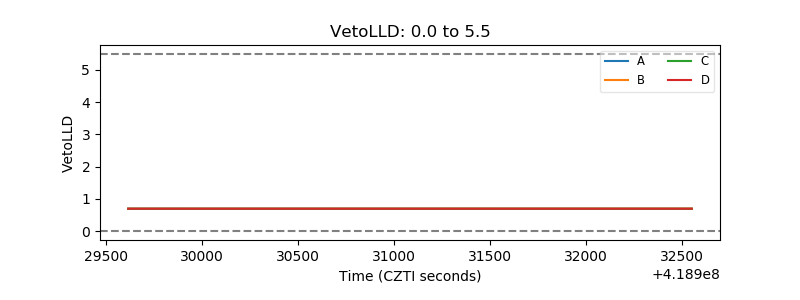 |
| Alpha Counter | 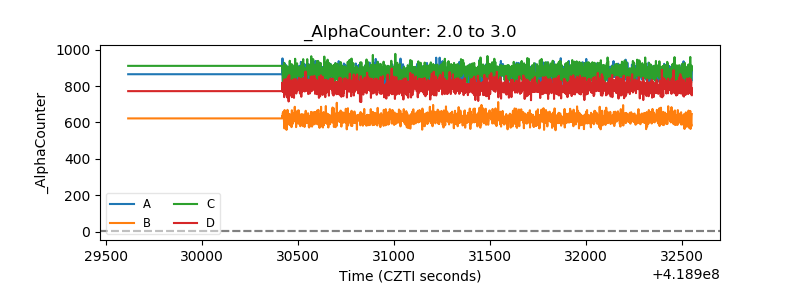 |
| _CPM_Rate | 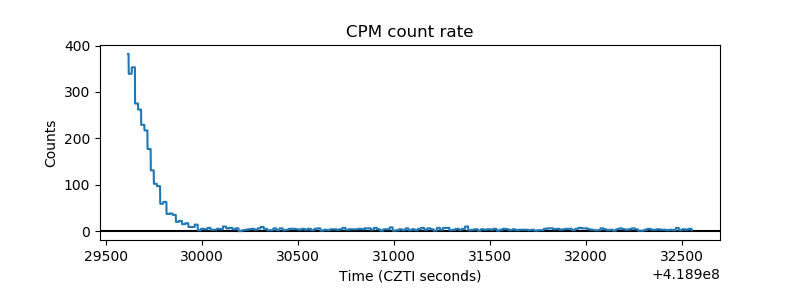 |
| CZT Counter | 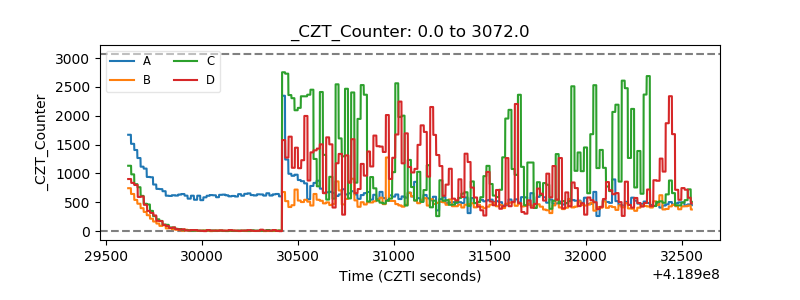 |
| +2.5 Volts monitor | 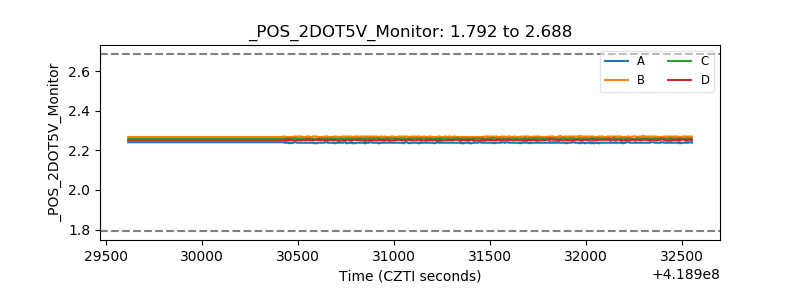 |
| +5 Volts monitor | 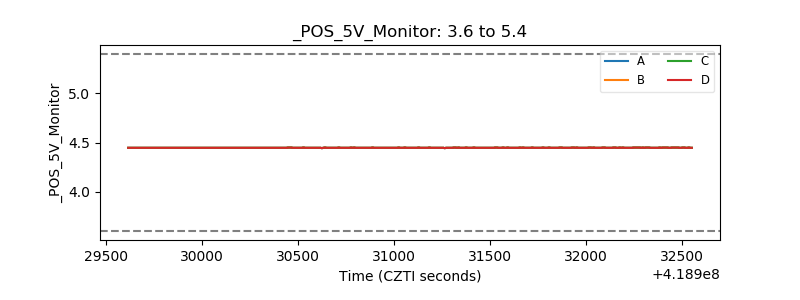 |
| _ROLL_ROT | 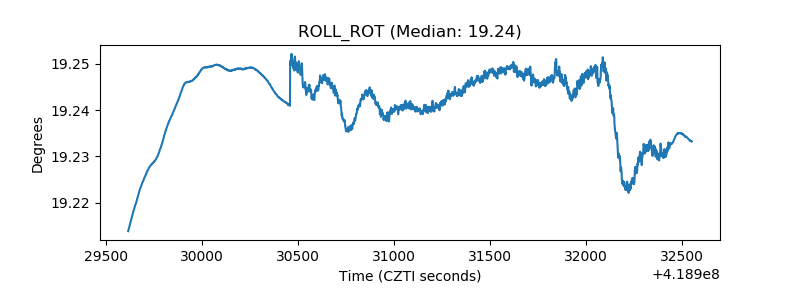 |
| _Roll_DEC | 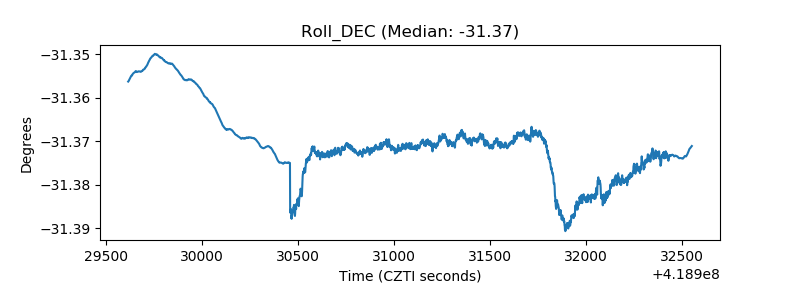 |
| _Roll_RA | 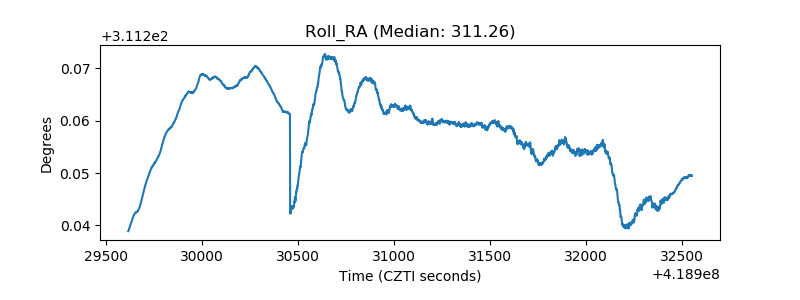 |
| Veto Counter | 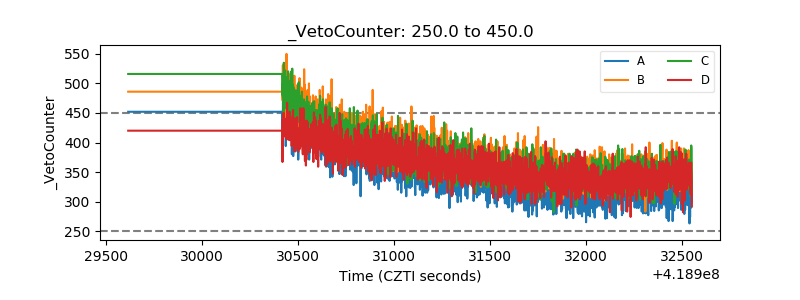 |