| Param | Original file | Final file |
|---|---|---|
| Filename | modeM0/AS1A12_068T02_9000005564_40747cztM0_level2.fits | modeM0/AS1A12_068T02_9000005564_40747cztM0_level2_quad_clean.evt |
| Size (bytes) | 190,005,120 | 35,781,120 |
| Size | 181.2 MB | 34.1 MB |
| Events in quadrant A | 1,279,120 | 253,900 |
| Events in quadrant B | 1,051,192 | 265,842 |
| Events in quadrant C | 2,450,454 | 216,463 |
| Events in quadrant D | 2,081,259 | 189,745 |
| Mode M0 | |||
|---|---|---|---|
| Quadrant | BADHDUFLAG | Total packets | Discarded packets |
| A | 0 | 5114 | 2 |
| B | 0 | 4487 | 1 |
| C | 0 | 8742 | 1 |
| D | 0 | 7660 | 6 |
| Mode SS | |||
|---|---|---|---|
| Quadrant | BADHDUFLAG | Total packets | Discarded packets |
| A | 0 | 46 | 0 |
| B | 0 | 46 | 0 |
| C | 0 | 46 | 0 |
| D | 0 | 46 | 0 |
| Mode M9 | |||
|---|---|---|---|
| Quadrant | BADHDUFLAG | Total packets | Discarded packets |
| A | 0 | 17 | 0 |
| B | 0 | 17 | 0 |
| C | 0 | 17 | 0 |
| D | 0 | 17 | 0 |
| Quadrant | Total seconds | Saturated seconds | Saturation percentage |
|---|---|---|---|
| A | 2175 | 13 | 0.597701% |
| B | 2175 | 7 | 0.321839% |
| C | 2175 | 403 | 18.528736% |
| D | 2174 | 468 | 21.527139% |
Noise dominated data is calculated using 1-second bins in cleaned event files. If a bin has >2000 counts, and if more than 50% of those come from <1% of pixels, then it is considered to be noise-dominated and hence unusable.
| Quadrant | # 1 sec bins | Bins with >0 counts | Bins with >2000 counts | High rate bins dominated by noise | Noise dominated (total time) | Noise dominated (detector-on time) | Marked lightcurve |
|---|---|---|---|---|---|---|---|
| A | 3938 | 2176 | 6 | 6 | 0.15% | 0.28% | 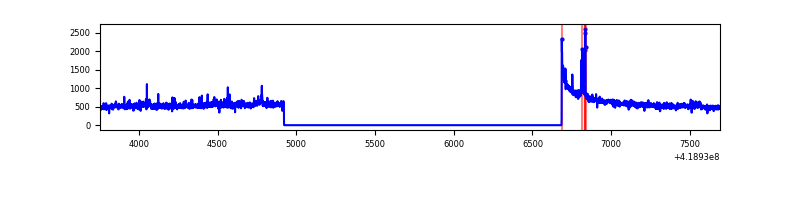 |
| B | 3938 | 2176 | 2 | 2 | 0.05% | 0.09% | 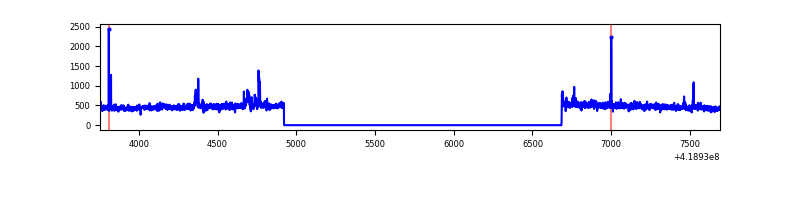 |
| C | 3938 | 2176 | 397 | 397 | 10.08% | 18.24% | 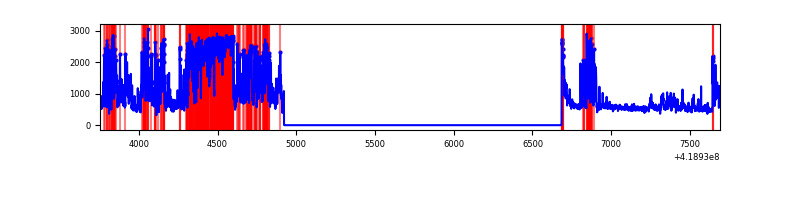 |
| D | 3938 | 2176 | 207 | 207 | 5.26% | 9.51% | 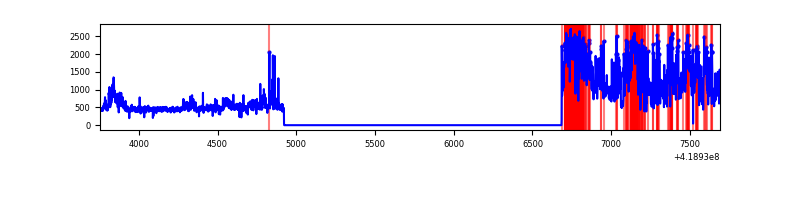 |
Top three noisy pixels from each quadrant. If the there are fewer than three noisy pixels in the level2.evt file, extra rows are filled as -1
| Pixel properties | Quadrant properties | ||||||
|---|---|---|---|---|---|---|---|
| Quadrant | DetID | PixID | Counts | Sigma | Mean | Median | Sigma |
| A | 10 | 83 | 212240 | 3957.0 | 255 | 250 | 53.6 |
| A | 12 | 189 | 33327 | 617.41 | 255 | 250 | 53.6 |
| A | 13 | 248 | 23641 | 436.62 | 255 | 250 | 53.6 |
| B | 0 | 229 | 25670 | 500.61 | 255 | 248 | 50.8 |
| B | 5 | 255 | 7979 | 152.24 | 255 | 248 | 50.8 |
| B | 12 | 111 | 6239 | 117.98 | 255 | 248 | 50.8 |
| C | 9 | 187 | 1420431 | 25948.64 | 229 | 230 | 54.7 |
| C | 15 | 214 | 88259 | 1608.39 | 229 | 230 | 54.7 |
| C | 0 | 10 | 36092 | 655.24 | 229 | 230 | 54.7 |
| D | 12 | 128 | 782246 | 13545.46 | 227 | 220 | 57.7 |
| D | 2 | 249 | 244845 | 4237.15 | 227 | 220 | 57.7 |
| D | 2 | 250 | 78528 | 1356.37 | 227 | 220 | 57.7 |
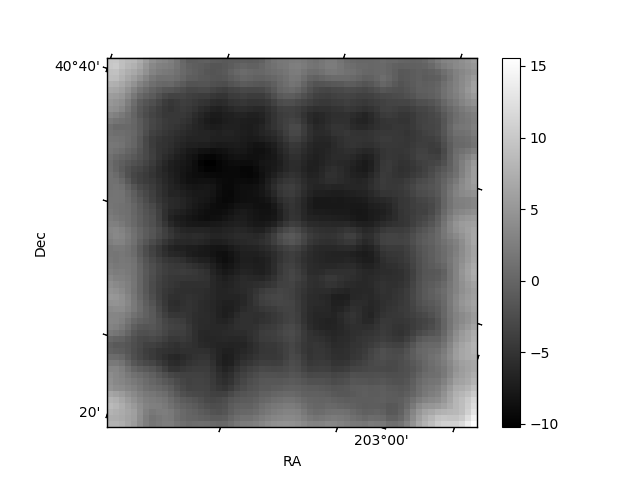
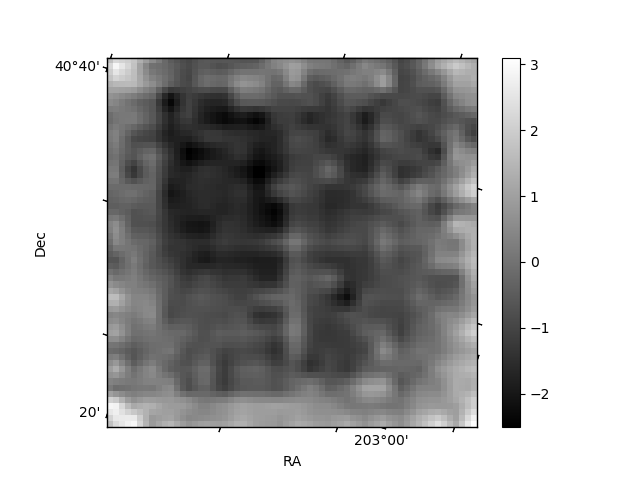
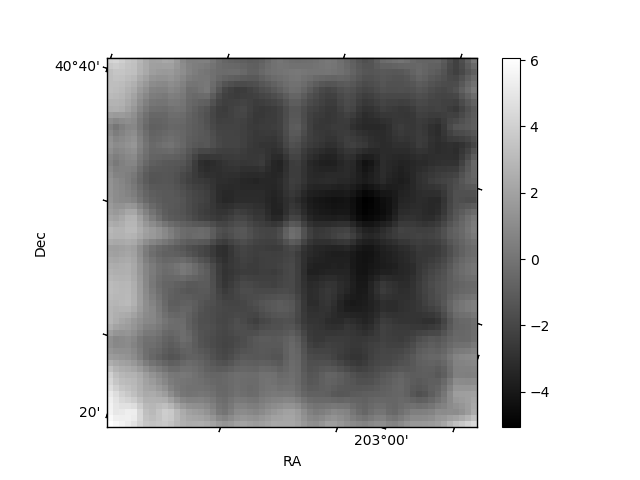
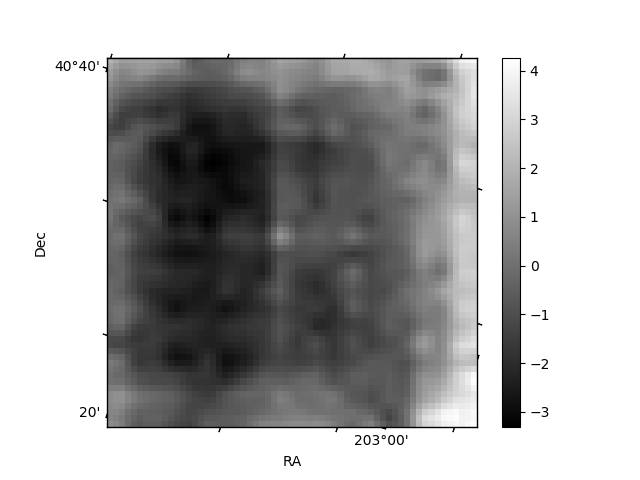
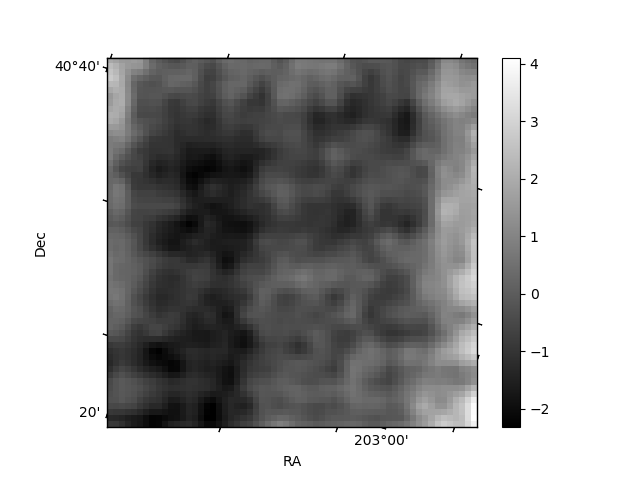
Histogram calculated using DETX and DETY for each event in the final _common_clean file
| Quadrant A | 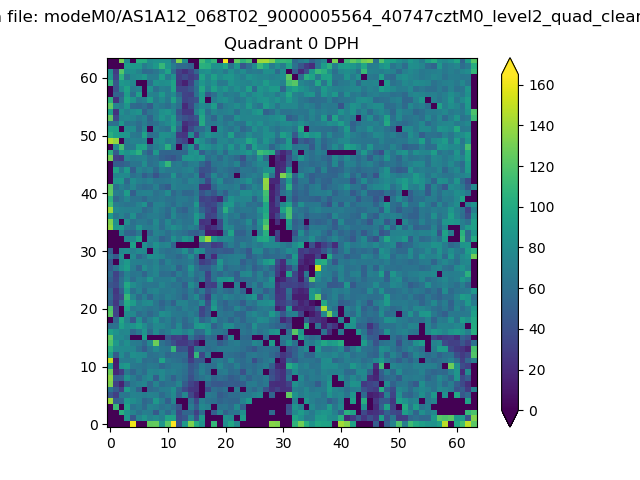 |
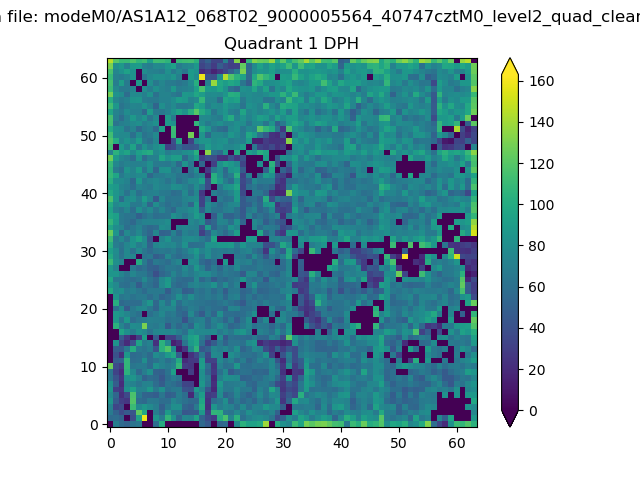 |
Quadrant B |
|---|---|---|---|
| Quadrant D | 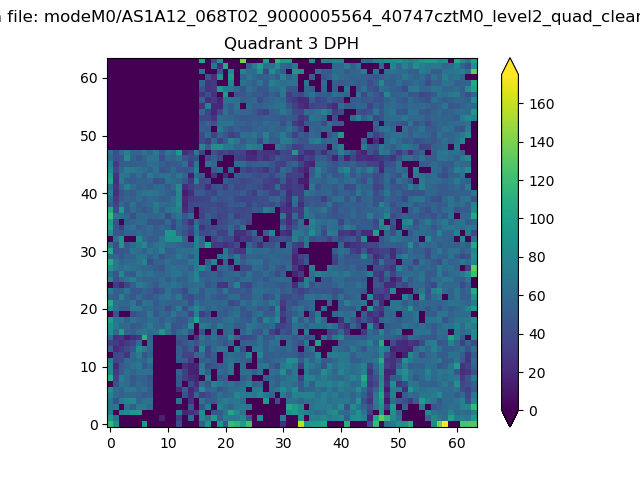 |
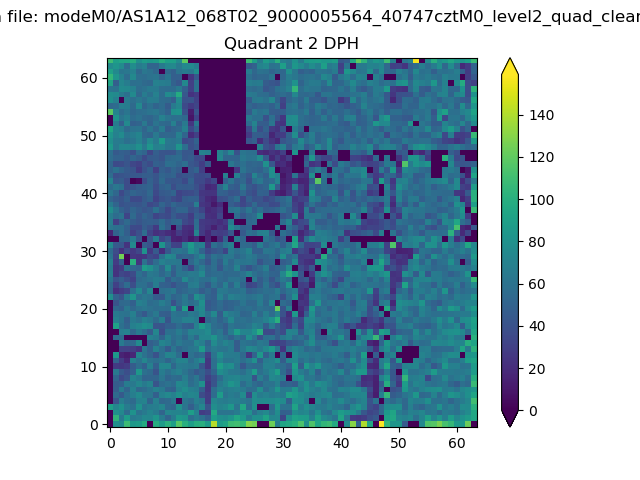 |
Quadrant C |
| Plot type | Count rate plots | Images |
|---|---|---|
| Comparison with Poisson distribution Blue bars denote a histogram of data divided into 1 sec bins. Red curve is a Poisson curve with rate = median count rate of data. |
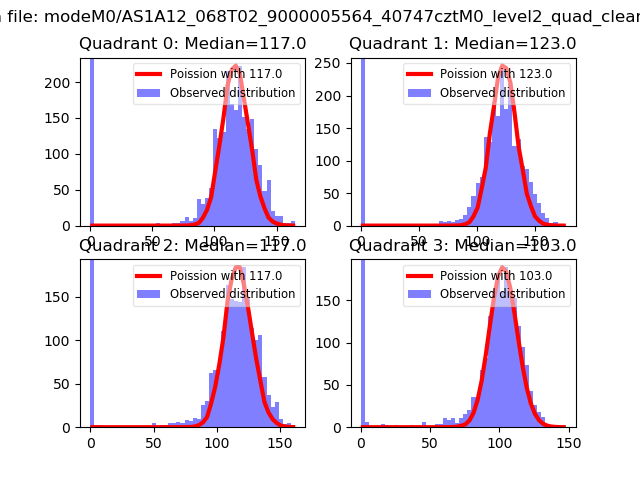 |
 |
| Quadrant-wise count rates Data is divided into 100 sec bins |
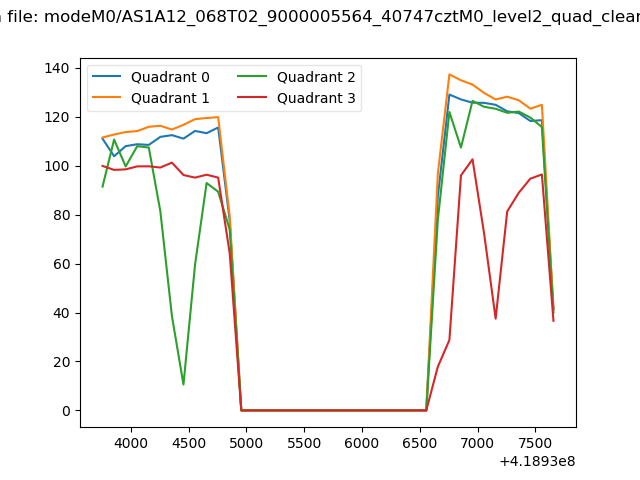 |
|
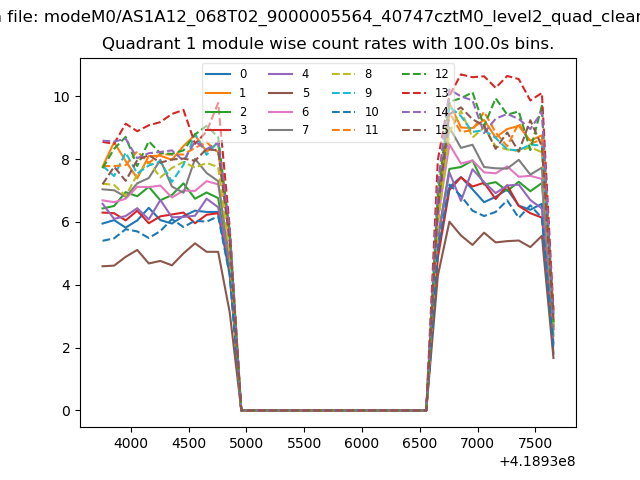
| Module-wise count rates for Quadrant A Data is divided into 100 sec bins |
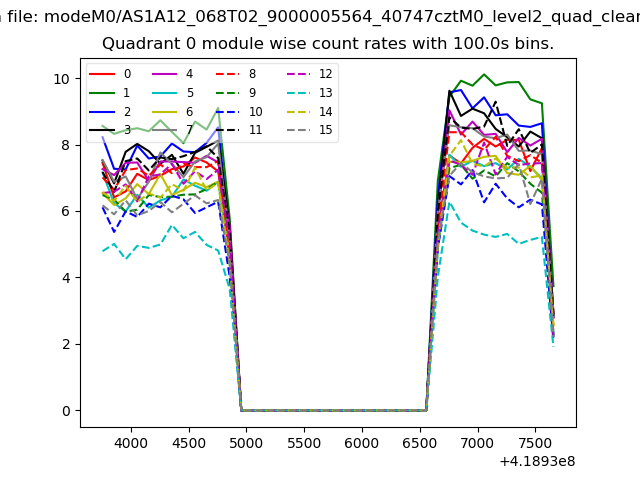 |
 |
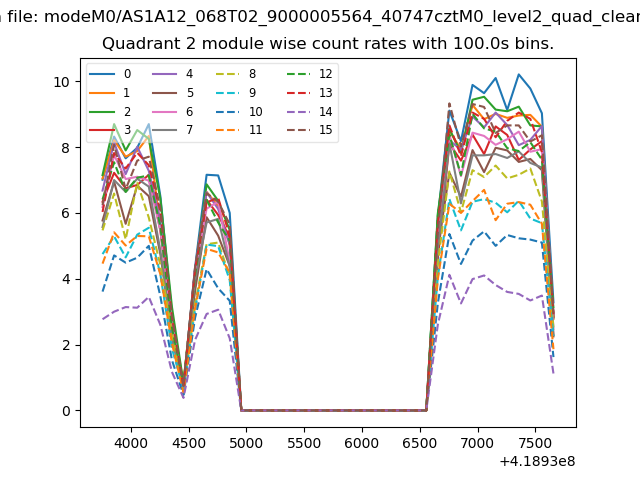
| Module-wise count rates for Quadrant B Data is divided into 100 sec bins |
 |
 |
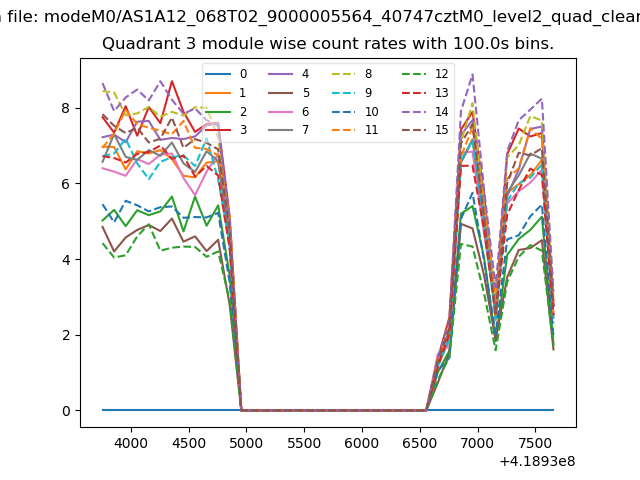
| Module-wise count rates for Quadrant C Data is divided into 100 sec bins |
 |
 |
| Module-wise count rates for Quadrant D Data is divided into 100 sec bins |
 |
 |
| Parameter | Plot |
|---|---|
| CZT HV Monitor | 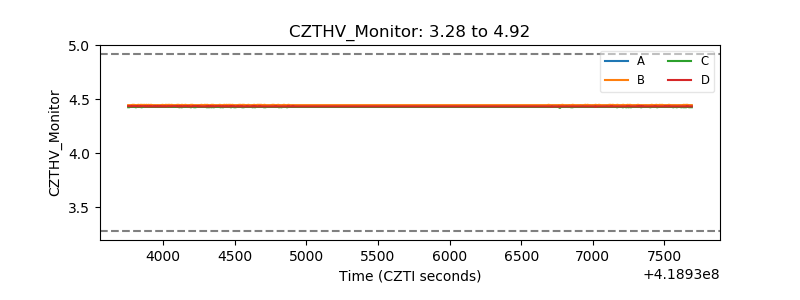 |
| D_VDD | 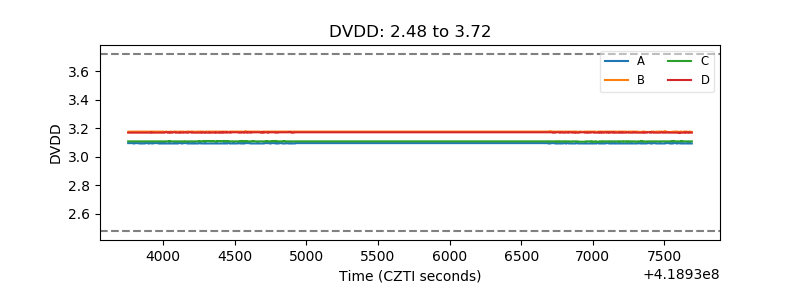 |
| Temperature 1 | 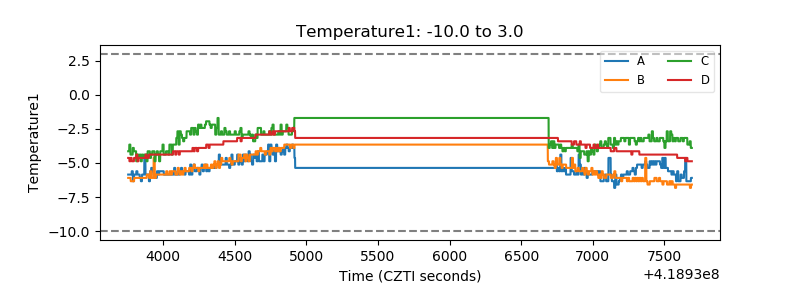 |
| Veto HV Monitor | 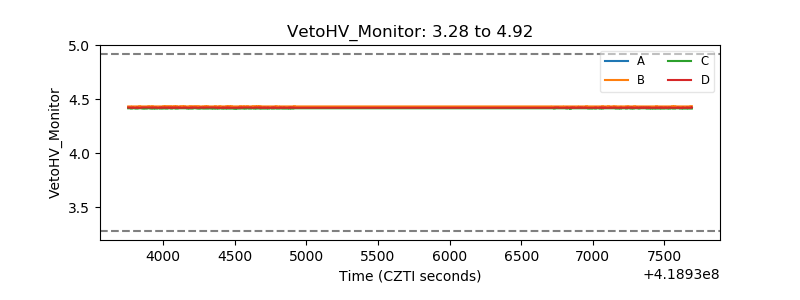 |
| Veto LLD | 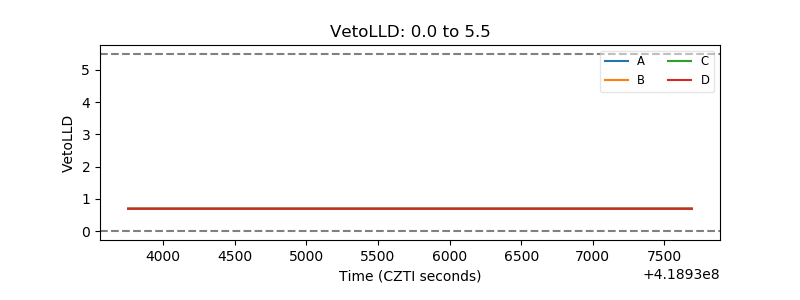 |
| Alpha Counter |  |
| _CPM_Rate | 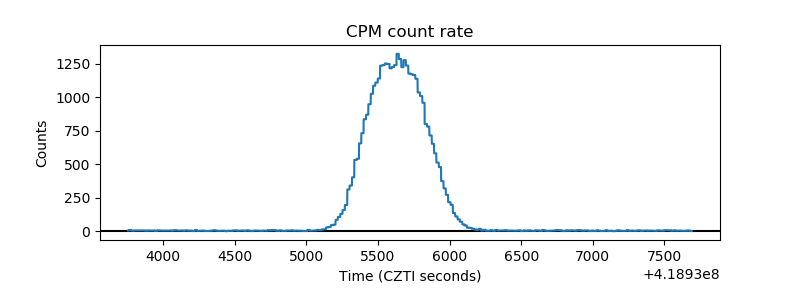 |
| CZT Counter | 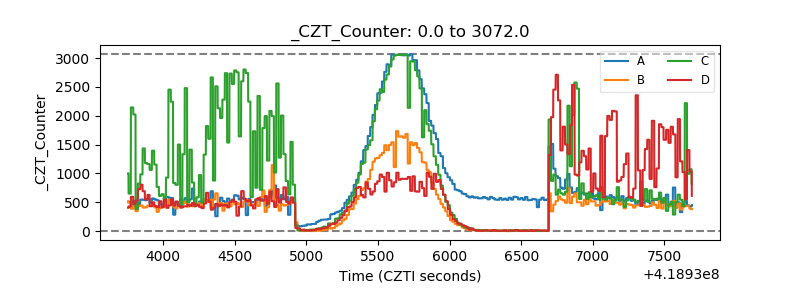 |
| +2.5 Volts monitor | 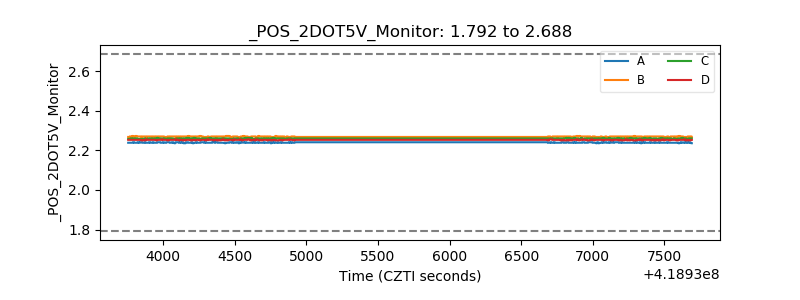 |
| +5 Volts monitor | 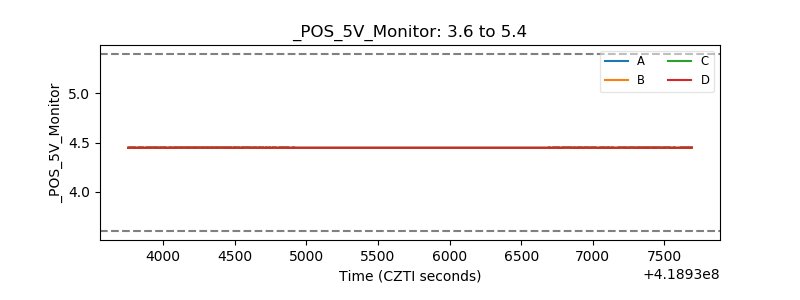 |
| _ROLL_ROT | 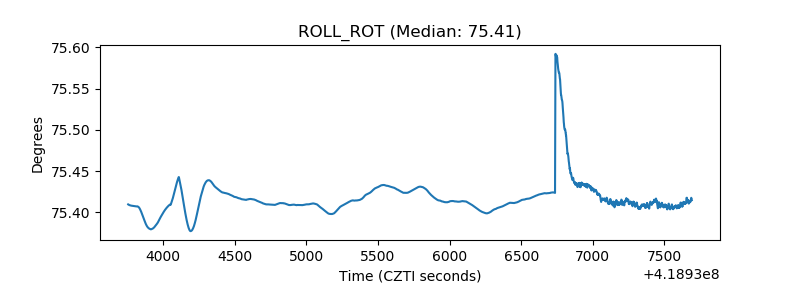 |
| _Roll_DEC | 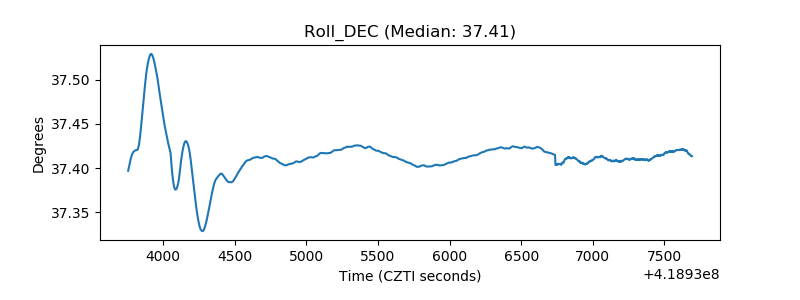 |
| _Roll_RA | 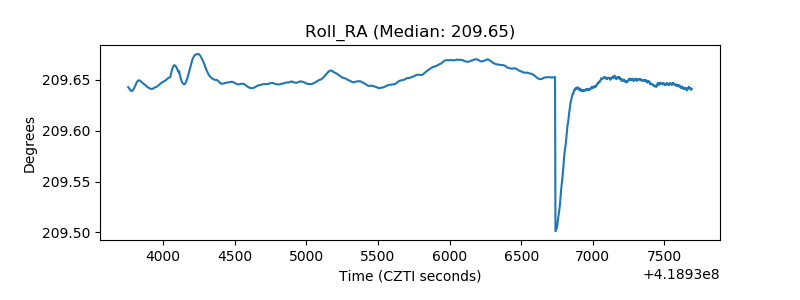 |
| Veto Counter | 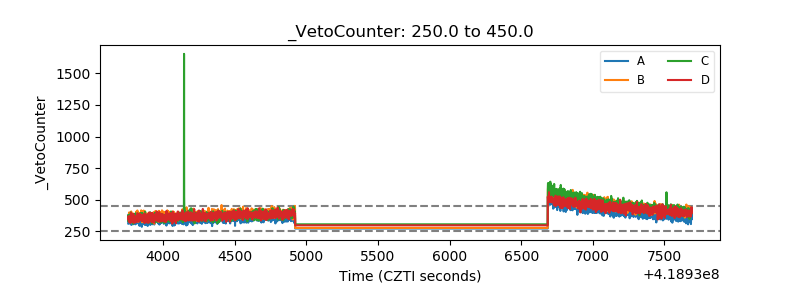 |