| Param | Original file | Final file |
|---|---|---|
| Filename | modeM0/AS1A12_068T02_9000005564_40748cztM0_level2.fits | modeM0/AS1A12_068T02_9000005564_40748cztM0_level2_quad_clean.evt |
| Size (bytes) | 436,628,160 | 86,256,000 |
| Size | 416.4 MB | 82.3 MB |
| Events in quadrant A | 2,771,155 | 601,679 |
| Events in quadrant B | 2,654,218 | 610,338 |
| Events in quadrant C | 5,666,177 | 555,059 |
| Events in quadrant D | 4,672,796 | 485,744 |
| Mode M0 | |||
|---|---|---|---|
| Quadrant | BADHDUFLAG | Total packets | Discarded packets |
| A | 0 | 11422 | 3 |
| B | 0 | 11305 | 2 |
| C | 0 | 20326 | 2 |
| D | 0 | 17475 | 2 |
| Mode SS | |||
|---|---|---|---|
| Quadrant | BADHDUFLAG | Total packets | Discarded packets |
| A | 0 | 104 | 0 |
| B | 0 | 104 | 0 |
| C | 0 | 104 | 0 |
| D | 0 | 104 | 0 |
| Mode M9 | |||
|---|---|---|---|
| Quadrant | BADHDUFLAG | Total packets | Discarded packets |
| A | 0 | 24 | 0 |
| B | 0 | 24 | 0 |
| C | 0 | 24 | 0 |
| D | 0 | 25 | 0 |
| Quadrant | Total seconds | Saturated seconds | Saturation percentage |
|---|---|---|---|
| A | 5123 | 21 | 0.409916% |
| B | 5123 | 136 | 2.654695% |
| C | 5123 | 629 | 12.277962% |
| D | 5123 | 731 | 14.268983% |
Noise dominated data is calculated using 1-second bins in cleaned event files. If a bin has >2000 counts, and if more than 50% of those come from <1% of pixels, then it is considered to be noise-dominated and hence unusable.
| Quadrant | # 1 sec bins | Bins with >0 counts | Bins with >2000 counts | High rate bins dominated by noise | Noise dominated (total time) | Noise dominated (detector-on time) | Marked lightcurve |
|---|---|---|---|---|---|---|---|
| A | 7006 | 5124 | 8 | 8 | 0.11% | 0.16% | 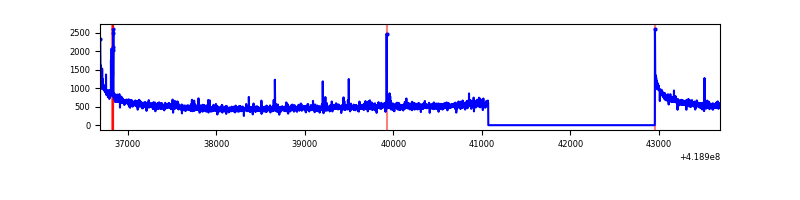 |
| B | 7006 | 5123 | 112 | 112 | 1.60% | 2.19% | 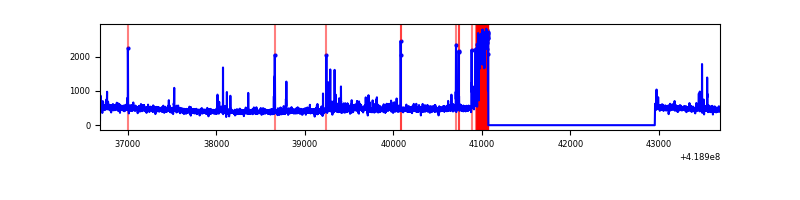 |
| C | 7006 | 5124 | 704 | 704 | 10.05% | 13.74% | 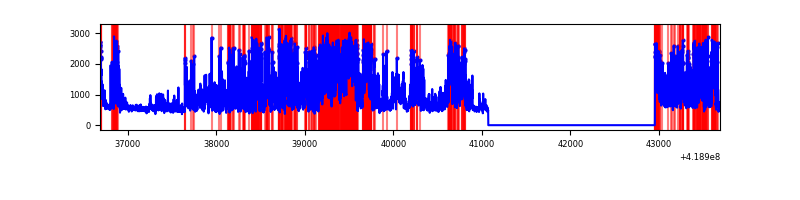 |
| D | 7006 | 5124 | 283 | 283 | 4.04% | 5.52% | 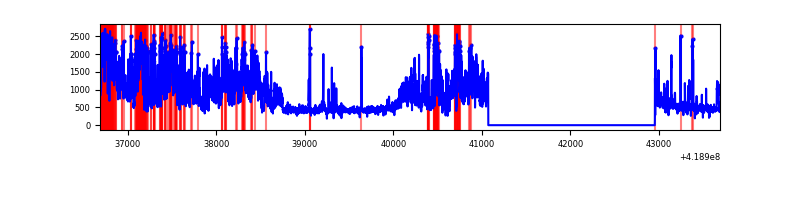 |
Top three noisy pixels from each quadrant. If the there are fewer than three noisy pixels in the level2.evt file, extra rows are filled as -1
| Pixel properties | Quadrant properties | ||||||
|---|---|---|---|---|---|---|---|
| Quadrant | DetID | PixID | Counts | Sigma | Mean | Median | Sigma |
| A | 10 | 83 | 458953 | 3911.9 | 573 | 561 | 117.2 |
| A | 13 | 248 | 34610 | 290.57 | 573 | 561 | 117.2 |
| A | 12 | 189 | 18711 | 154.89 | 573 | 561 | 117.2 |
| B | 0 | 229 | 345429 | 3206.07 | 563 | 545 | 107.6 |
| B | 4 | 171 | 36975 | 338.65 | 563 | 545 | 107.6 |
| B | 5 | 255 | 33633 | 307.58 | 563 | 545 | 107.6 |
| C | 9 | 187 | 3184877 | 24939.8 | 551 | 554 | 127.7 |
| C | 15 | 214 | 216249 | 1689.34 | 551 | 554 | 127.7 |
| C | 0 | 10 | 56797 | 440.5 | 551 | 554 | 127.7 |
| D | 12 | 128 | 1817722 | 13749.76 | 529 | 514 | 132.2 |
| D | 2 | 249 | 371084 | 2803.89 | 529 | 514 | 132.2 |
| D | 12 | 191 | 126017 | 949.61 | 529 | 514 | 132.2 |
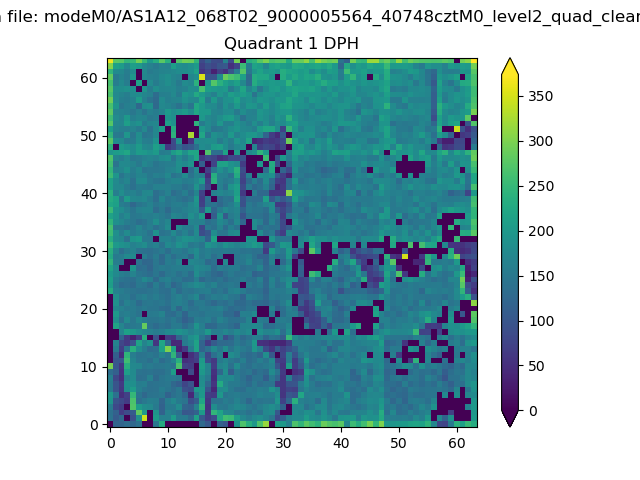
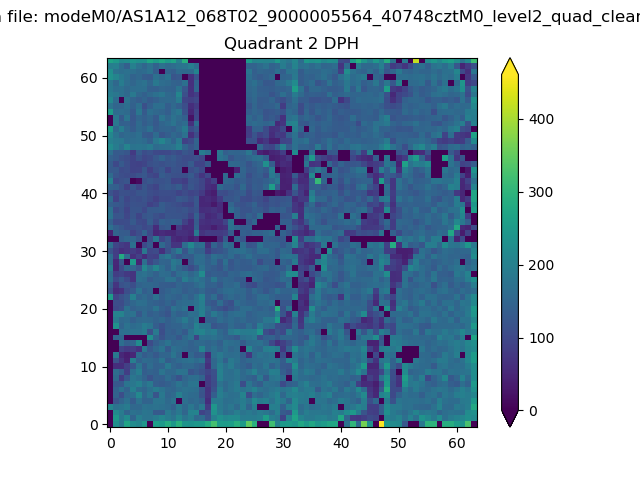
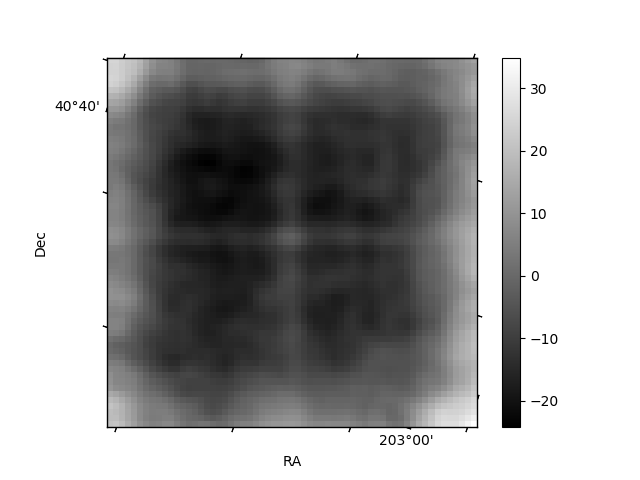
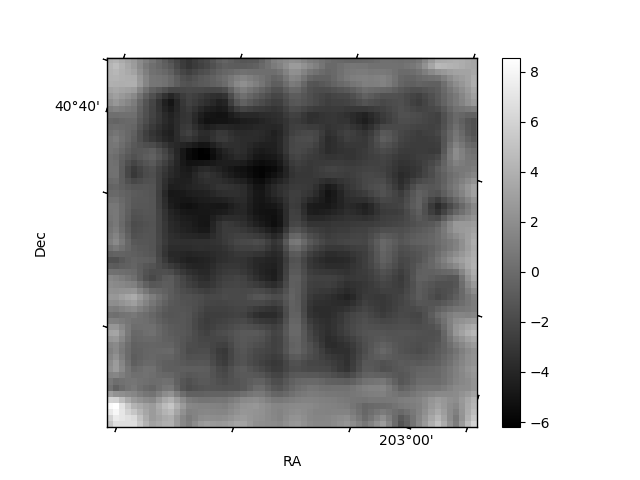
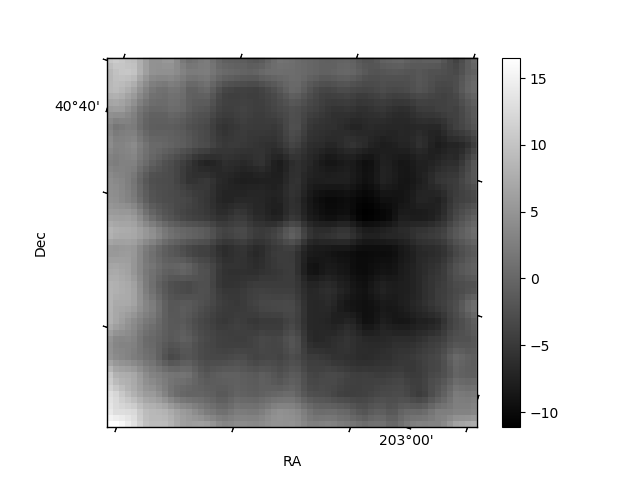
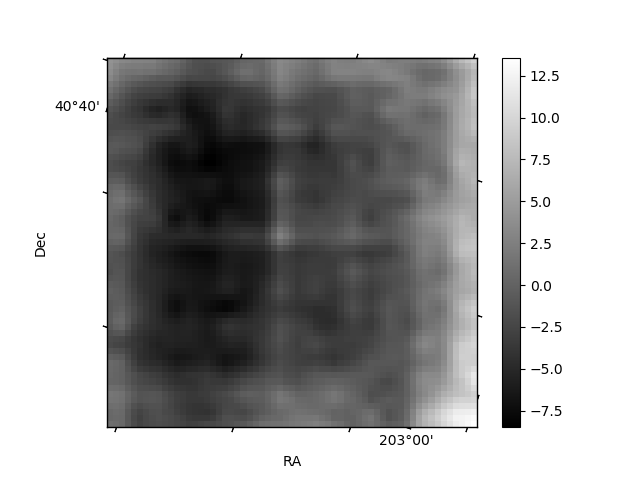
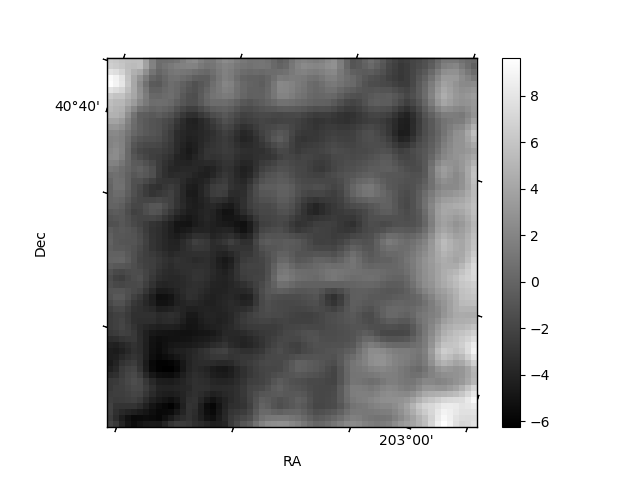
Histogram calculated using DETX and DETY for each event in the final _common_clean file
| Quadrant A |  |
 |
Quadrant B |
|---|---|---|---|
| Quadrant D | 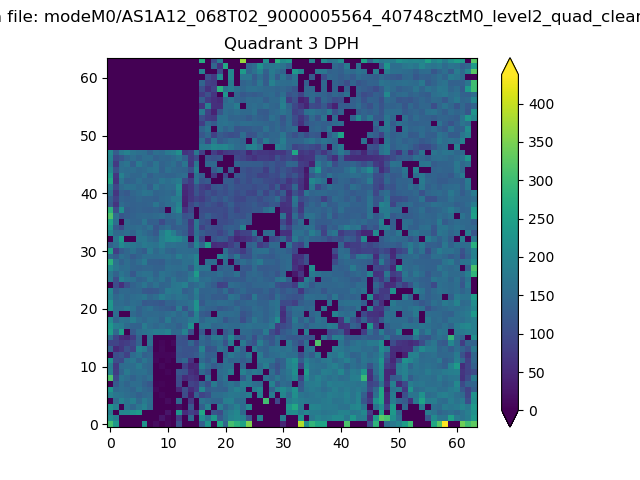 |
 |
Quadrant C |
| Plot type | Count rate plots | Images |
|---|---|---|
| Comparison with Poisson distribution Blue bars denote a histogram of data divided into 1 sec bins. Red curve is a Poisson curve with rate = median count rate of data. |
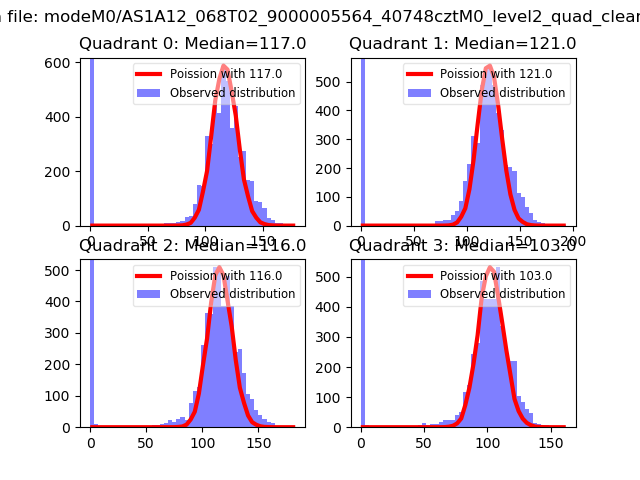 |
 |
| Quadrant-wise count rates Data is divided into 100 sec bins |
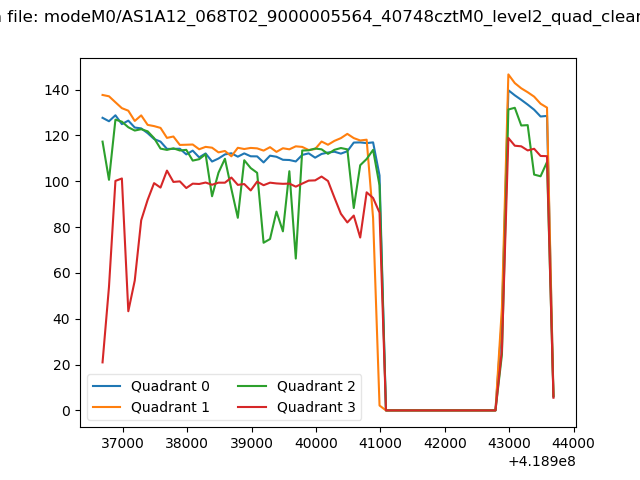 |
|
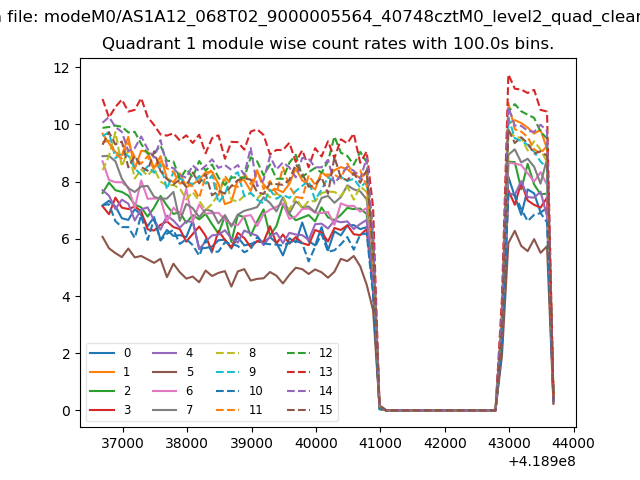
| Module-wise count rates for Quadrant A Data is divided into 100 sec bins |
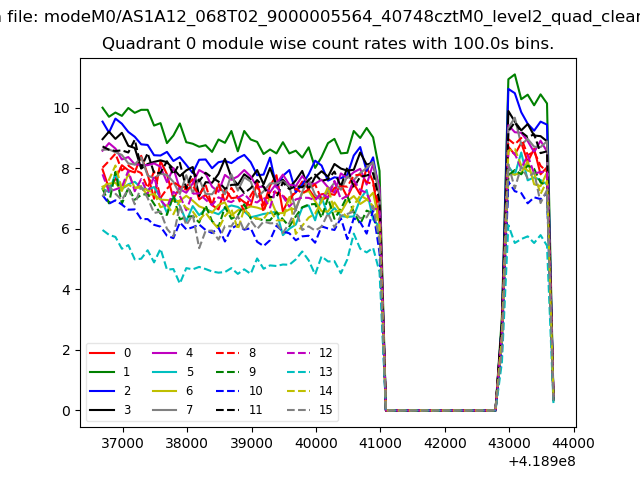 |
 |
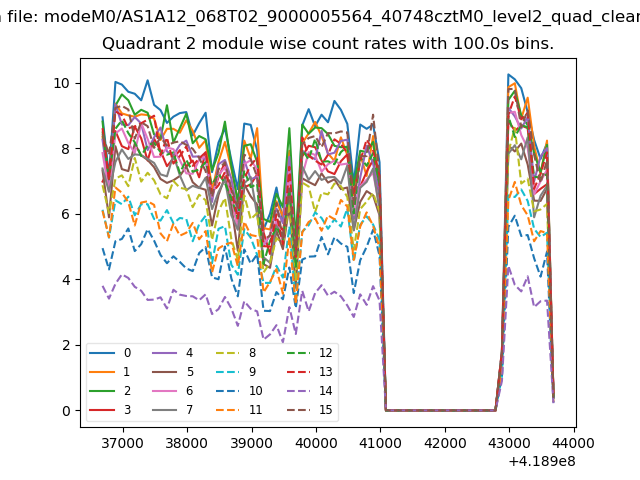
| Module-wise count rates for Quadrant B Data is divided into 100 sec bins |
 |
 |
| Module-wise count rates for Quadrant C Data is divided into 100 sec bins |
 |
 |
| Module-wise count rates for Quadrant D Data is divided into 100 sec bins |
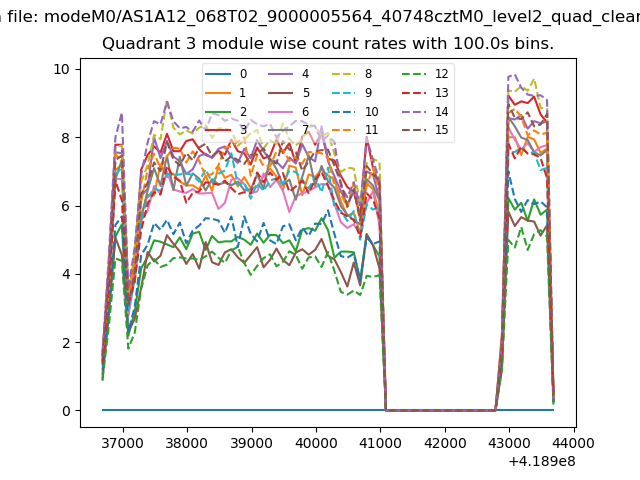 |
 |
| Parameter | Plot |
|---|---|
| CZT HV Monitor | 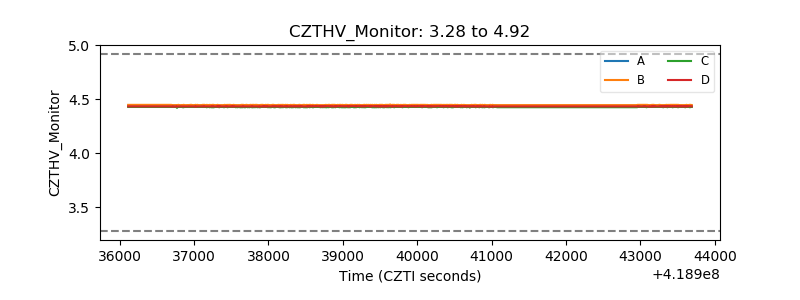 |
| D_VDD |  |
| Temperature 1 | 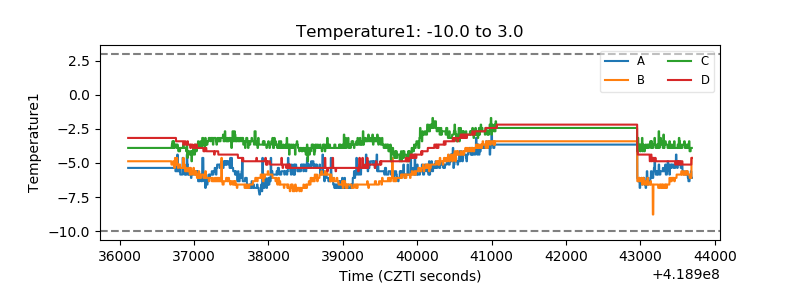 |
| Veto HV Monitor | 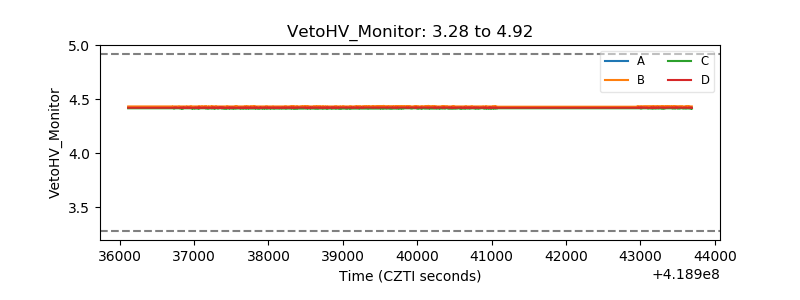 |
| Veto LLD | 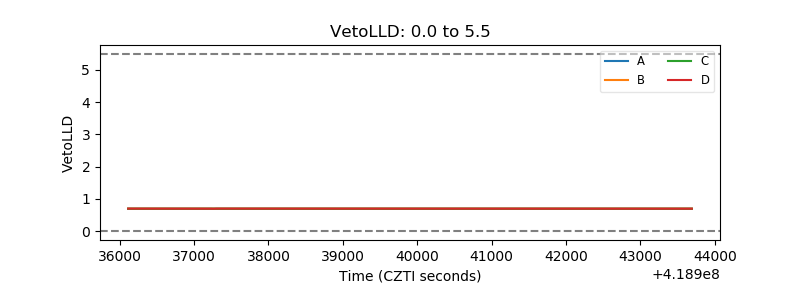 |
| Alpha Counter | 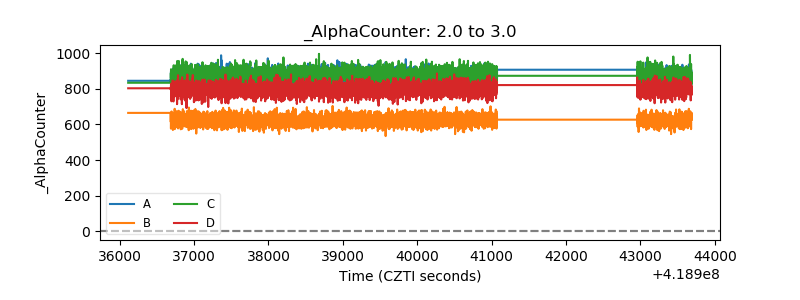 |
| _CPM_Rate | 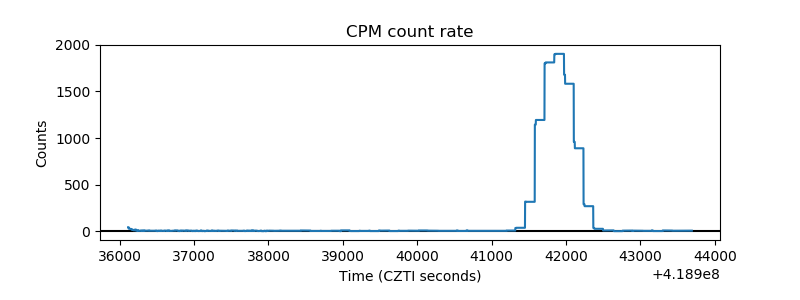 |
| CZT Counter | 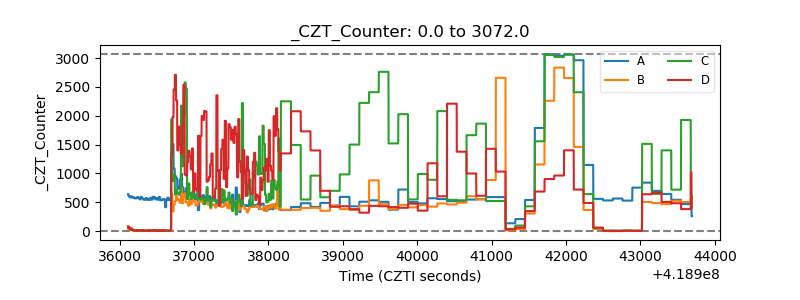 |
| +2.5 Volts monitor | 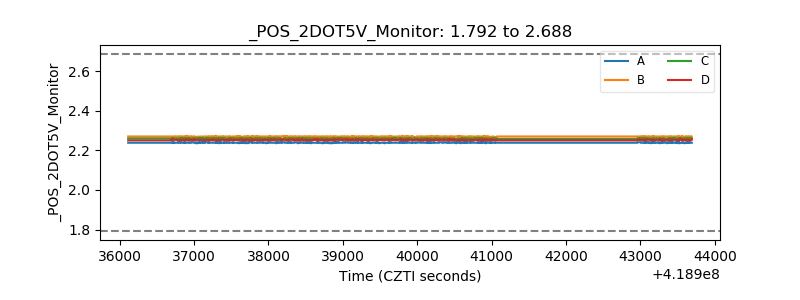 |
| +5 Volts monitor | 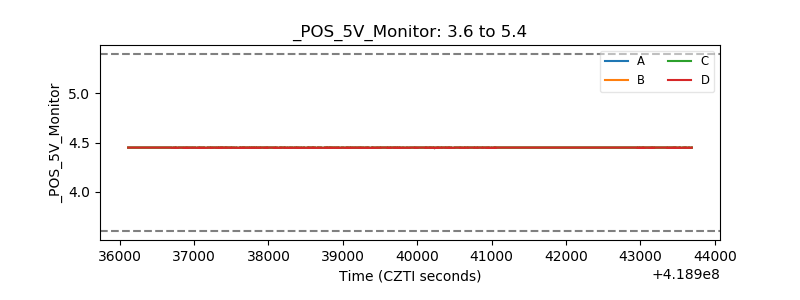 |
| _ROLL_ROT | 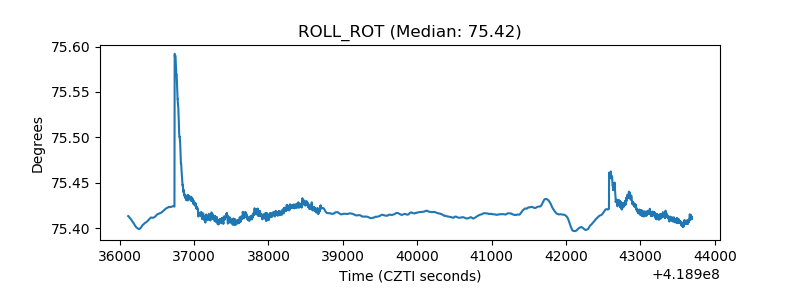 |
| _Roll_DEC | 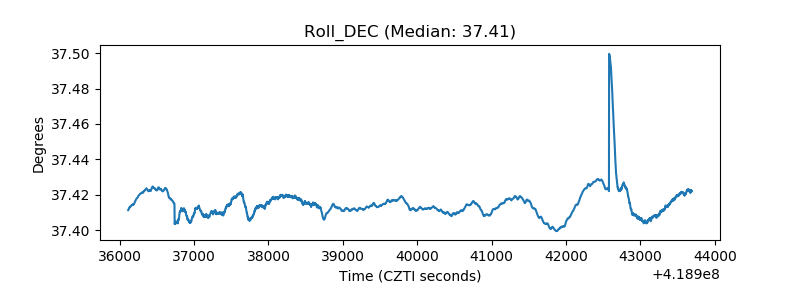 |
| _Roll_RA | 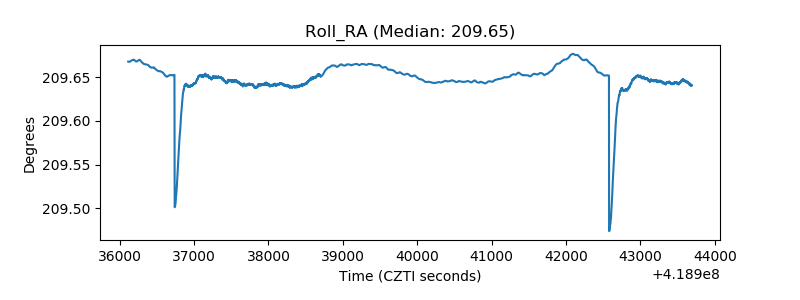 |
| Veto Counter | 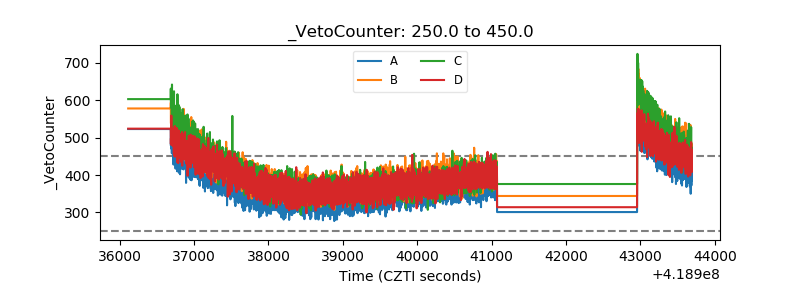 |