| Param | Original file | Final file |
|---|---|---|
| Filename | modeM0/AS1A12_068T02_9000005564_40749cztM0_level2.fits | modeM0/AS1A12_068T02_9000005564_40749cztM0_level2_quad_clean.evt |
| Size (bytes) | 409,288,320 | 89,400,960 |
| Size | 390.3 MB | 85.3 MB |
| Events in quadrant A | 2,795,428 | 626,786 |
| Events in quadrant B | 2,632,447 | 645,126 |
| Events in quadrant C | 6,290,456 | 536,013 |
| Events in quadrant D | 3,030,788 | 537,291 |
| Mode M0 | |||
|---|---|---|---|
| Quadrant | BADHDUFLAG | Total packets | Discarded packets |
| A | 0 | 11385 | 3 |
| B | 0 | 11133 | 2 |
| C | 0 | 22271 | 2 |
| D | 0 | 12558 | 2 |
| Mode SS | |||
|---|---|---|---|
| Quadrant | BADHDUFLAG | Total packets | Discarded packets |
| A | 0 | 110 | 0 |
| B | 0 | 110 | 0 |
| C | 0 | 110 | 0 |
| D | 0 | 110 | 0 |
| Mode M9 | |||
|---|---|---|---|
| Quadrant | BADHDUFLAG | Total packets | Discarded packets |
| A | 0 | 38 | 0 |
| B | 0 | 38 | 0 |
| C | 0 | 38 | 0 |
| D | 0 | 38 | 0 |
| Quadrant | Total seconds | Saturated seconds | Saturation percentage |
|---|---|---|---|
| A | 5157 | 9 | 0.174520% |
| B | 5157 | 88 | 1.706418% |
| C | 5157 | 976 | 18.925732% |
| D | 5157 | 389 | 7.543145% |
Noise dominated data is calculated using 1-second bins in cleaned event files. If a bin has >2000 counts, and if more than 50% of those come from <1% of pixels, then it is considered to be noise-dominated and hence unusable.
| Quadrant | # 1 sec bins | Bins with >0 counts | Bins with >2000 counts | High rate bins dominated by noise | Noise dominated (total time) | Noise dominated (detector-on time) | Marked lightcurve |
|---|---|---|---|---|---|---|---|
| A | 9013 | 5159 | 3 | 3 | 0.03% | 0.06% | 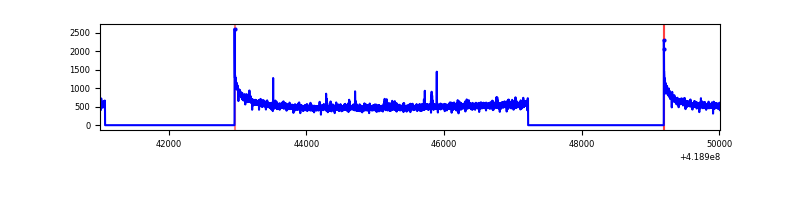 |
| B | 9013 | 5158 | 76 | 76 | 0.84% | 1.47% | 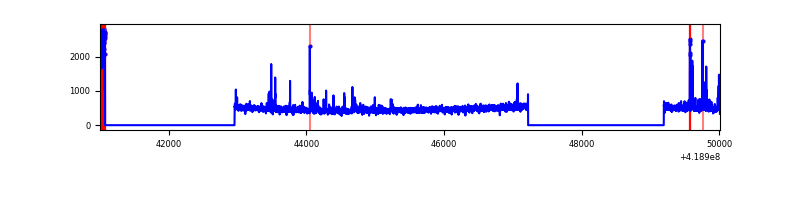 |
| C | 9013 | 5159 | 1056 | 1056 | 11.72% | 20.47% | 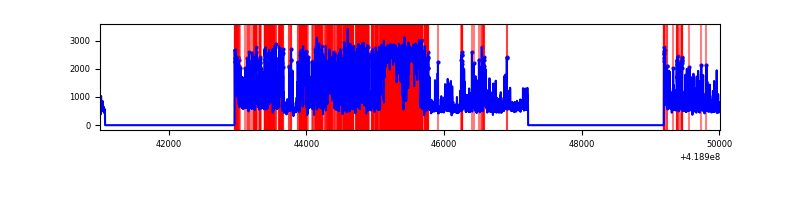 |
| D | 9012 | 5158 | 48 | 48 | 0.53% | 0.93% | 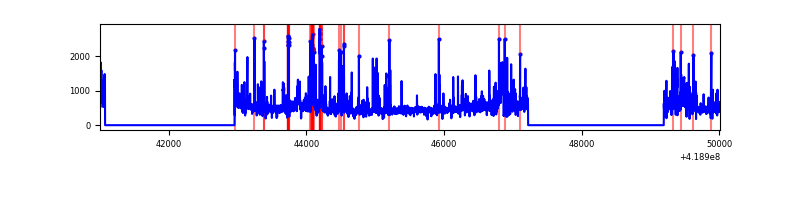 |
Top three noisy pixels from each quadrant. If the there are fewer than three noisy pixels in the level2.evt file, extra rows are filled as -1
| Pixel properties | Quadrant properties | ||||||
|---|---|---|---|---|---|---|---|
| Quadrant | DetID | PixID | Counts | Sigma | Mean | Median | Sigma |
| A | 10 | 83 | 463602 | 3824.72 | 588 | 578 | 121.1 |
| A | 12 | 189 | 21516 | 172.95 | 588 | 578 | 121.1 |
| A | 6 | 10 | 18191 | 145.49 | 588 | 578 | 121.1 |
| B | 0 | 229 | 196037 | 1781.96 | 582 | 567 | 109.7 |
| B | 4 | 171 | 89075 | 806.86 | 582 | 567 | 109.7 |
| B | 5 | 255 | 35472 | 318.2 | 582 | 567 | 109.7 |
| C | 9 | 187 | 3935692 | 31823.59 | 537 | 542 | 123.7 |
| C | 15 | 214 | 207981 | 1677.56 | 537 | 542 | 123.7 |
| C | 0 | 10 | 40536 | 323.43 | 537 | 542 | 123.7 |
| D | 2 | 249 | 247982 | 1813.12 | 550 | 535 | 136.5 |
| D | 13 | 249 | 193984 | 1417.46 | 550 | 535 | 136.5 |
| D | 12 | 128 | 181328 | 1324.72 | 550 | 535 | 136.5 |
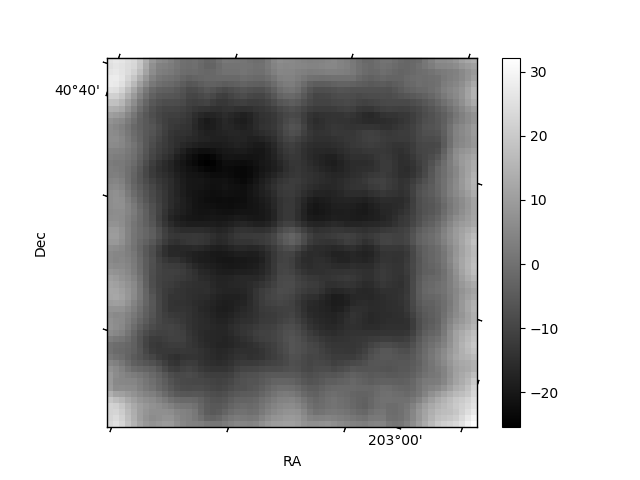
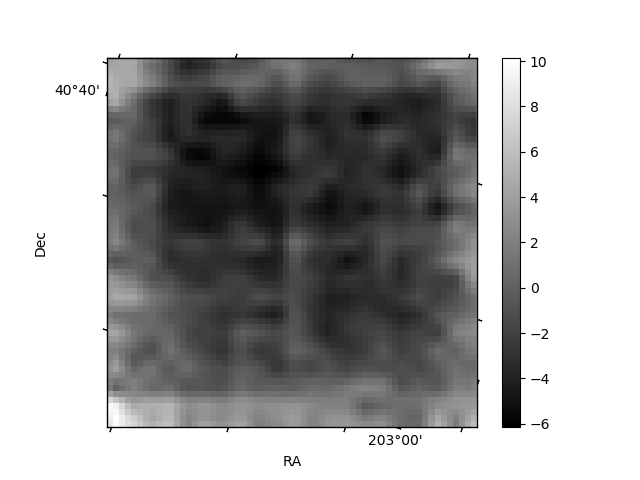
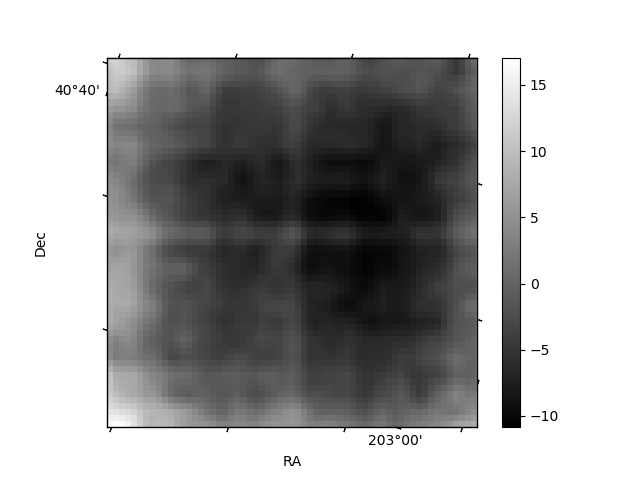
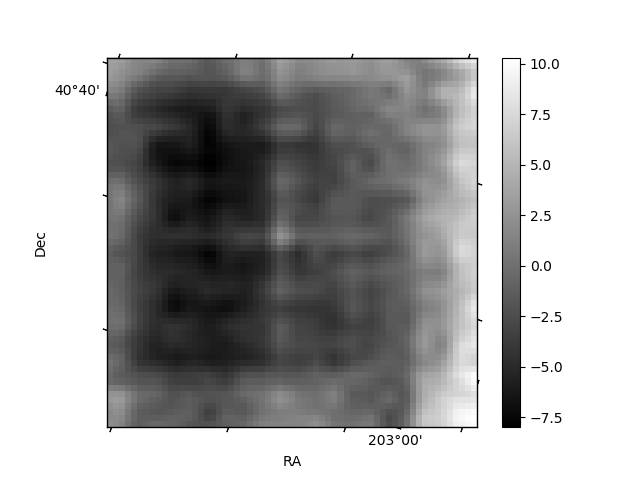
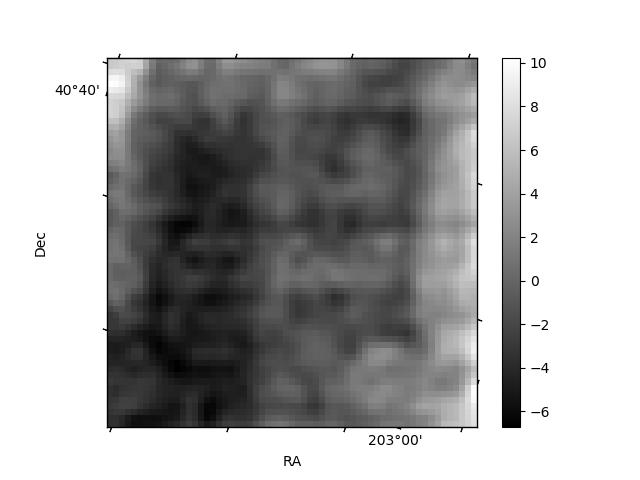
Histogram calculated using DETX and DETY for each event in the final _common_clean file
| Quadrant A | 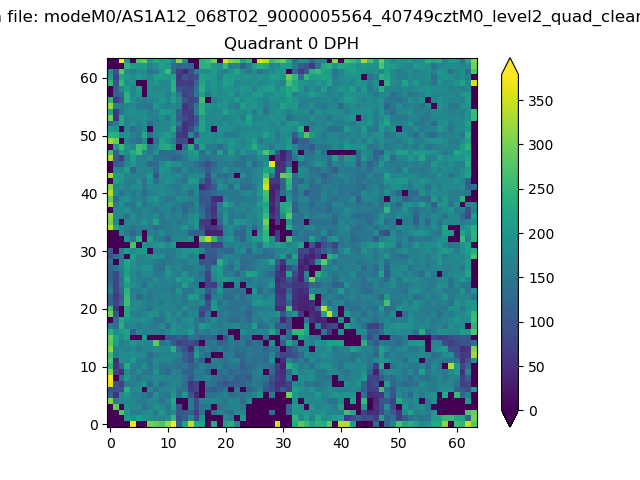 |
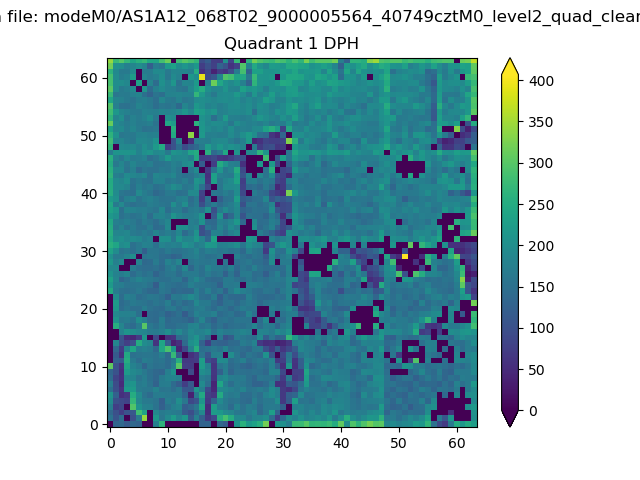 |
Quadrant B |
|---|---|---|---|
| Quadrant D | 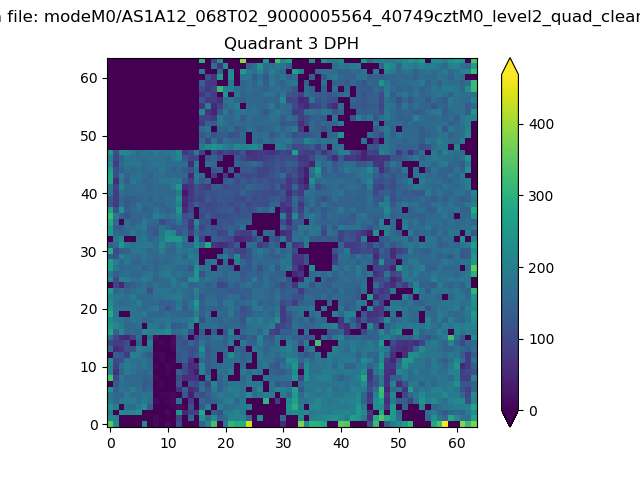 |
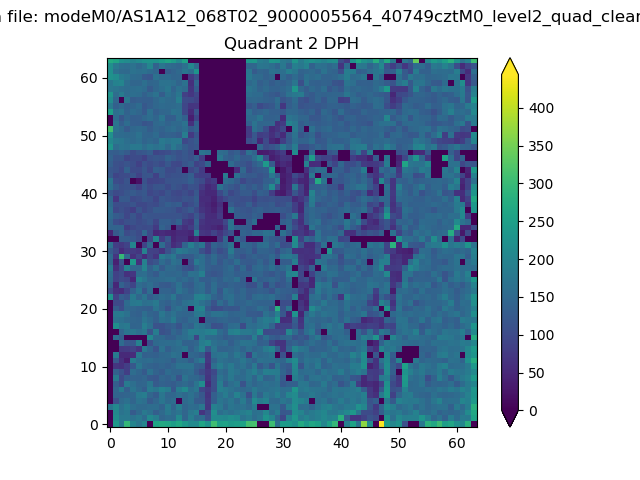 |
Quadrant C |
| Plot type | Count rate plots | Images |
|---|---|---|
| Comparison with Poisson distribution Blue bars denote a histogram of data divided into 1 sec bins. Red curve is a Poisson curve with rate = median count rate of data. |
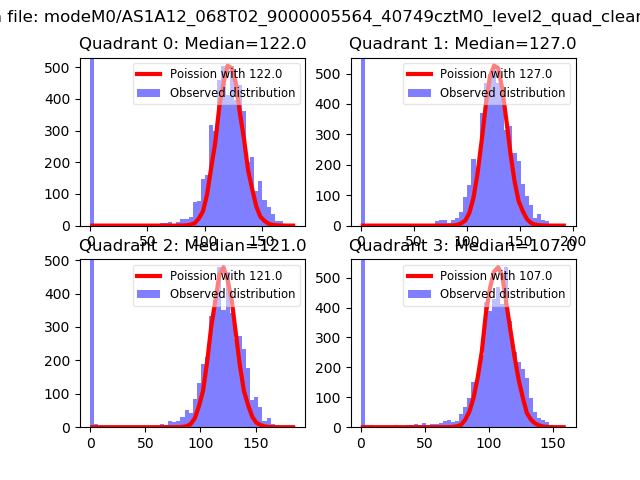 |
 |
| Quadrant-wise count rates Data is divided into 100 sec bins |
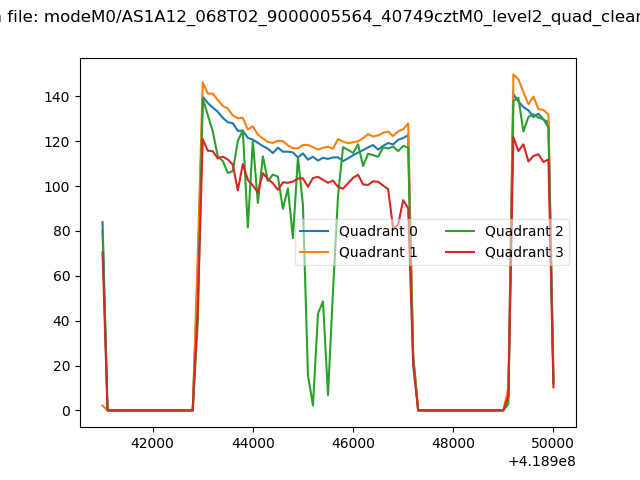 |
|
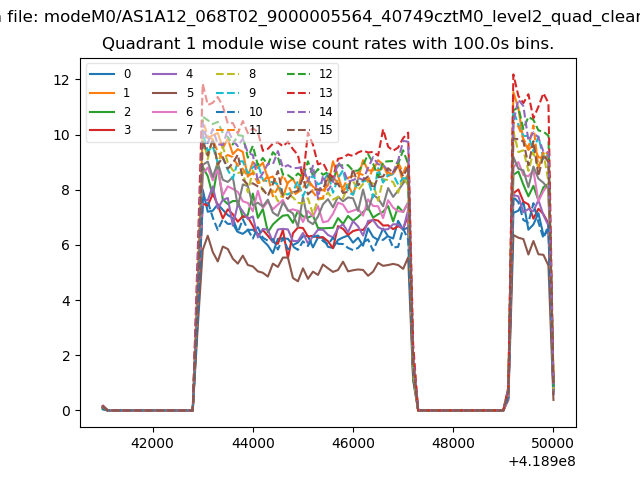
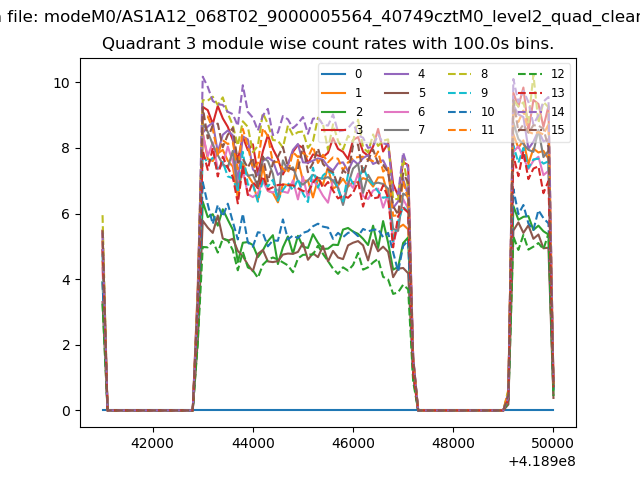
| Module-wise count rates for Quadrant A Data is divided into 100 sec bins |
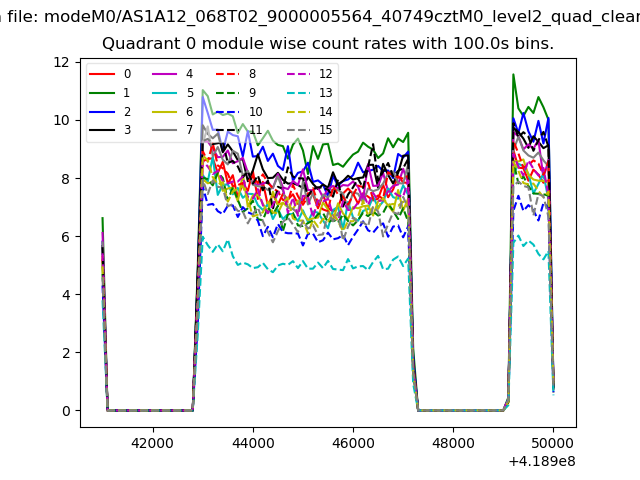 |
 |
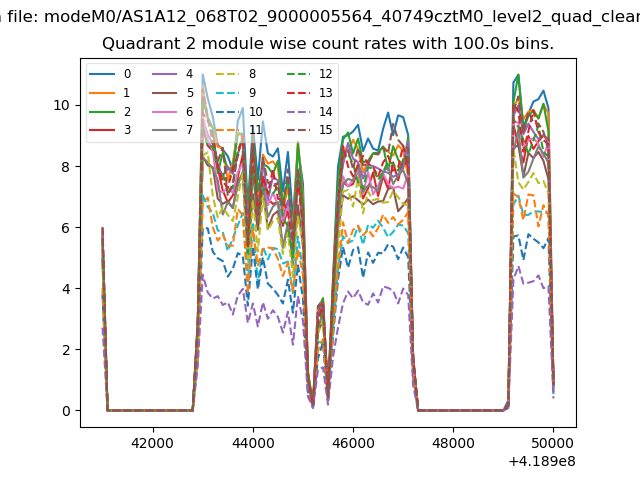
| Module-wise count rates for Quadrant B Data is divided into 100 sec bins |
 |
 |
| Module-wise count rates for Quadrant C Data is divided into 100 sec bins |
 |
 |
| Module-wise count rates for Quadrant D Data is divided into 100 sec bins |
 |
 |
| Parameter | Plot |
|---|---|
| CZT HV Monitor | 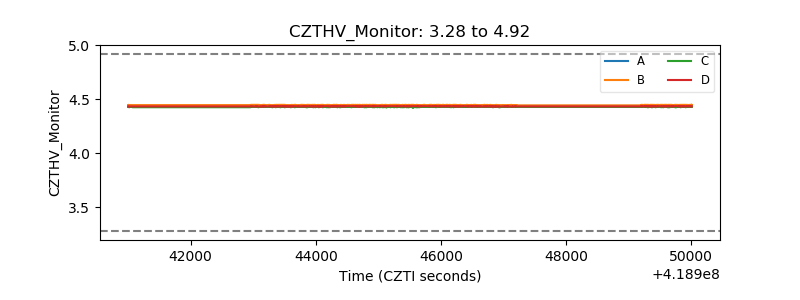 |
| D_VDD | 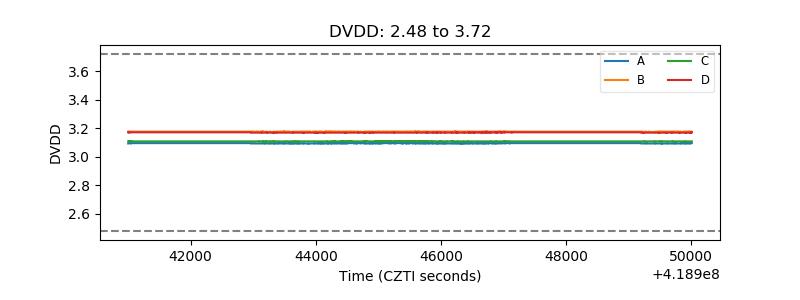 |
| Temperature 1 | 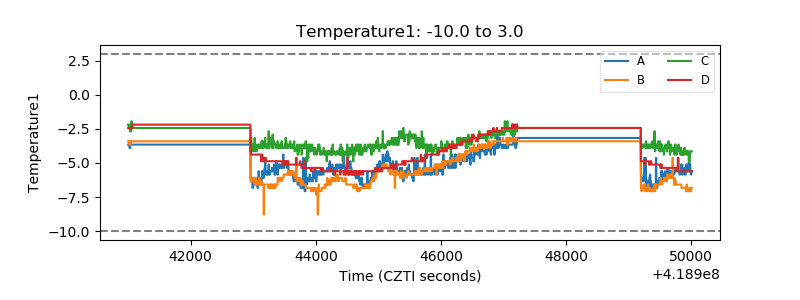 |
| Veto HV Monitor | 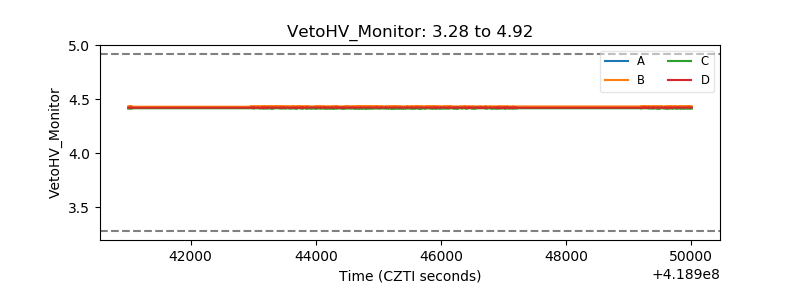 |
| Veto LLD | 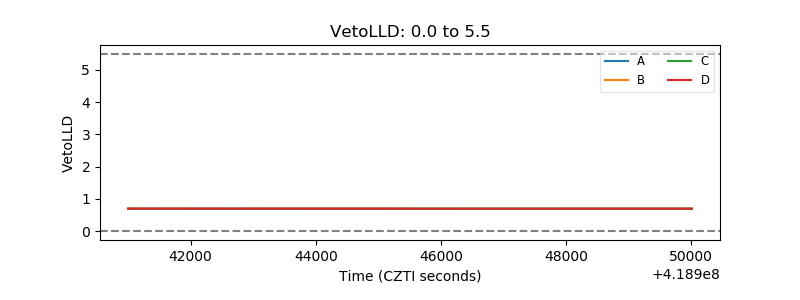 |
| Alpha Counter | 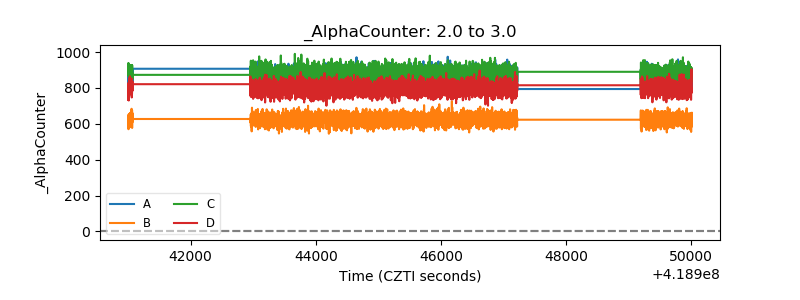 |
| _CPM_Rate | 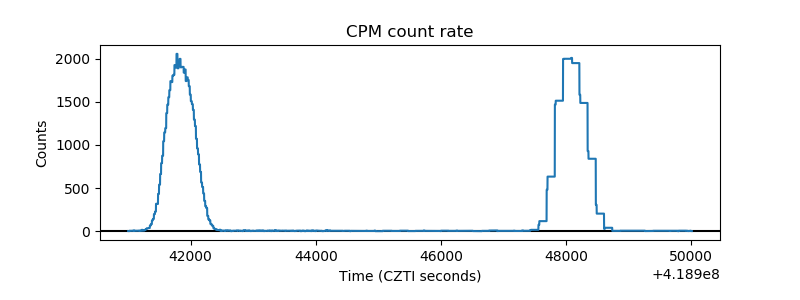 |
| CZT Counter | 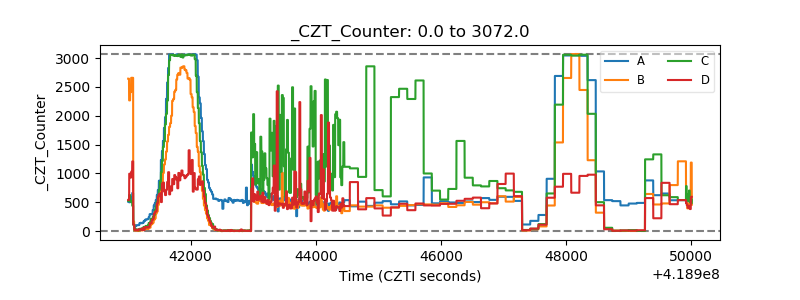 |
| +2.5 Volts monitor | 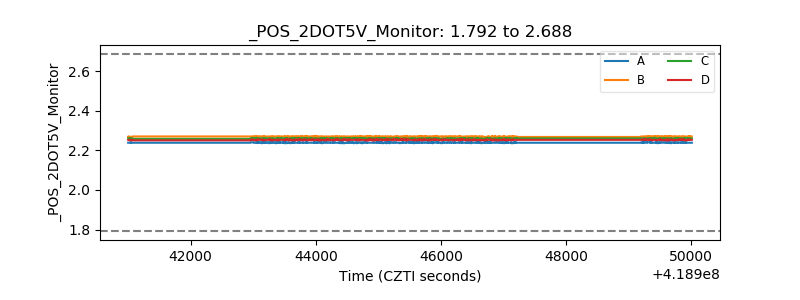 |
| +5 Volts monitor | 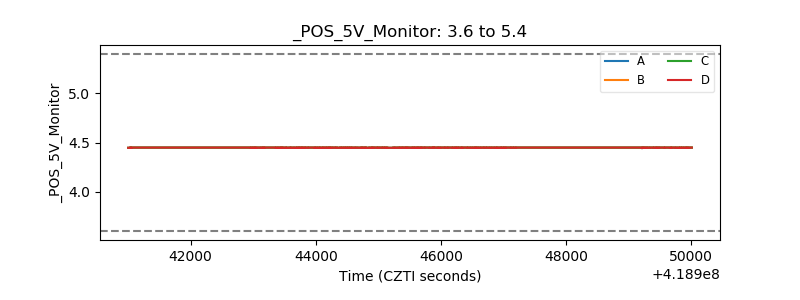 |
| _ROLL_ROT | 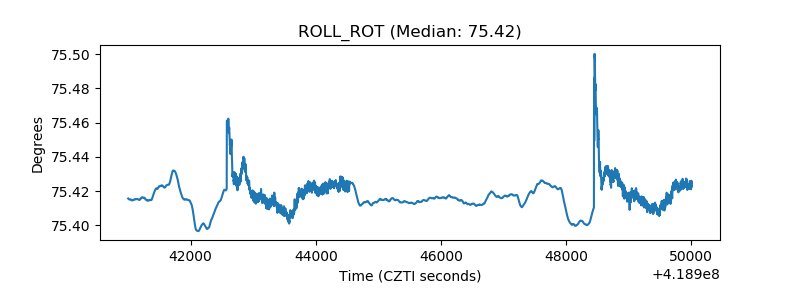 |
| _Roll_DEC | 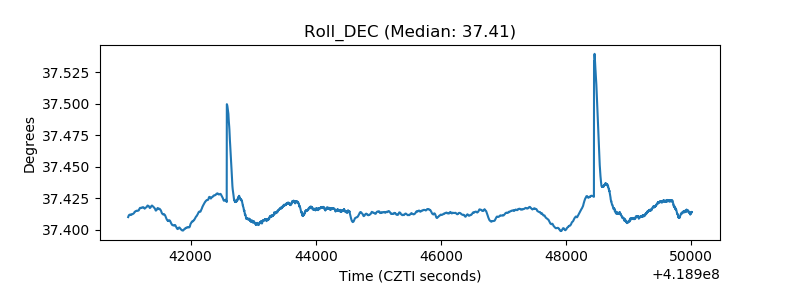 |
| _Roll_RA | 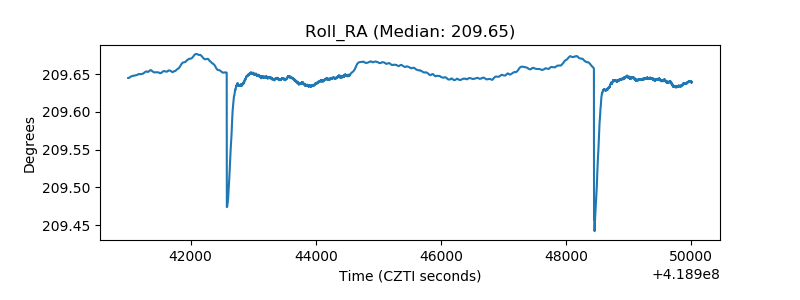 |
| Veto Counter | 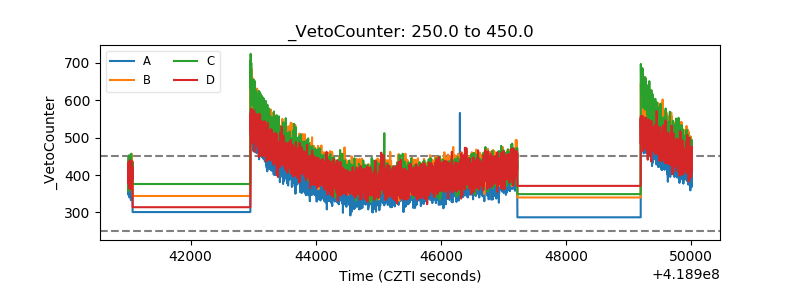 |