| Param | Original file | Final file |
|---|---|---|
| Filename | modeM0/AS1A12_068T02_9000005564_40750cztM0_level2.fits | modeM0/AS1A12_068T02_9000005564_40750cztM0_level2_quad_clean.evt |
| Size (bytes) | 334,840,320 | 89,032,320 |
| Size | 319.3 MB | 84.9 MB |
| Events in quadrant A | 2,714,229 | 606,448 |
| Events in quadrant B | 2,417,893 | 633,900 |
| Events in quadrant C | 4,234,173 | 584,267 |
| Events in quadrant D | 2,641,318 | 522,796 |
| Mode M0 | |||
|---|---|---|---|
| Quadrant | BADHDUFLAG | Total packets | Discarded packets |
| A | 0 | 11024 | 3 |
| B | 0 | 10364 | 2 |
| C | 0 | 15873 | 2 |
| D | 0 | 11271 | 2 |
| Mode SS | |||
|---|---|---|---|
| Quadrant | BADHDUFLAG | Total packets | Discarded packets |
| A | 0 | 102 | 0 |
| B | 0 | 102 | 0 |
| C | 0 | 102 | 0 |
| D | 0 | 102 | 0 |
| Mode M9 | |||
|---|---|---|---|
| Quadrant | BADHDUFLAG | Total packets | Discarded packets |
| A | 0 | 31 | 0 |
| B | 0 | 31 | 0 |
| C | 0 | 31 | 0 |
| D | 0 | 32 | 0 |
| Quadrant | Total seconds | Saturated seconds | Saturation percentage |
|---|---|---|---|
| A | 4969 | 9 | 0.181123% |
| B | 4969 | 16 | 0.321996% |
| C | 4969 | 288 | 5.795935% |
| D | 4969 | 275 | 5.534313% |
Noise dominated data is calculated using 1-second bins in cleaned event files. If a bin has >2000 counts, and if more than 50% of those come from <1% of pixels, then it is considered to be noise-dominated and hence unusable.
| Quadrant | # 1 sec bins | Bins with >0 counts | Bins with >2000 counts | High rate bins dominated by noise | Noise dominated (total time) | Noise dominated (detector-on time) | Marked lightcurve |
|---|---|---|---|---|---|---|---|
| A | 7063 | 4970 | 4 | 4 | 0.06% | 0.08% | 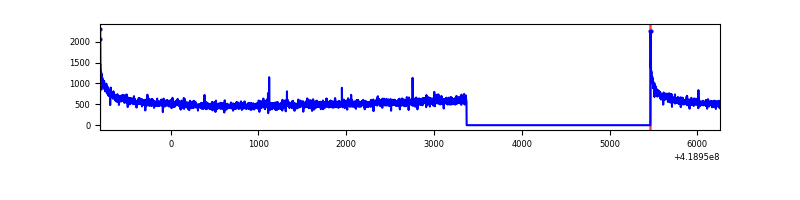 |
| B | 7063 | 4970 | 7 | 7 | 0.10% | 0.14% | 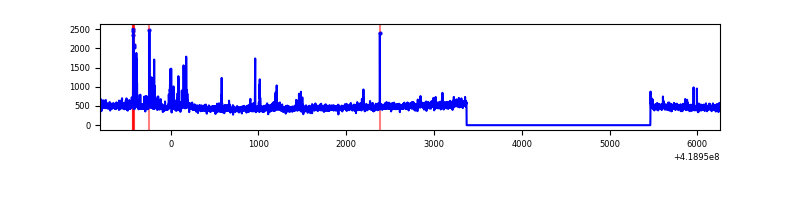 |
| C | 7062 | 4969 | 312 | 312 | 4.42% | 6.28% | 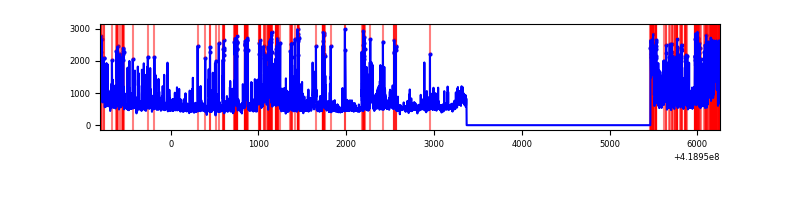 |
| D | 7063 | 4969 | 17 | 17 | 0.24% | 0.34% | 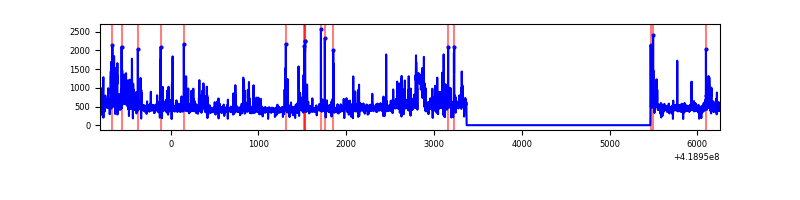 |
Top three noisy pixels from each quadrant. If the there are fewer than three noisy pixels in the level2.evt file, extra rows are filled as -1
| Pixel properties | Quadrant properties | ||||||
|---|---|---|---|---|---|---|---|
| Quadrant | DetID | PixID | Counts | Sigma | Mean | Median | Sigma |
| A | 10 | 83 | 461001 | 3972.48 | 570 | 560 | 115.9 |
| A | 12 | 189 | 26026 | 219.71 | 570 | 560 | 115.9 |
| A | 6 | 10 | 13201 | 109.06 | 570 | 560 | 115.9 |
| B | 4 | 171 | 107687 | 979.06 | 572 | 558 | 109.4 |
| B | 5 | 255 | 25983 | 232.36 | 572 | 558 | 109.4 |
| B | 0 | 229 | 21761 | 193.78 | 572 | 558 | 109.4 |
| C | 9 | 187 | 1810751 | 14188.16 | 549 | 553 | 127.6 |
| C | 15 | 214 | 213926 | 1672.4 | 549 | 553 | 127.6 |
| C | 0 | 10 | 59966 | 465.67 | 549 | 553 | 127.6 |
| D | 2 | 249 | 161794 | 1234.56 | 533 | 519 | 130.6 |
| D | 12 | 191 | 126635 | 965.42 | 533 | 519 | 130.6 |
| D | 13 | 249 | 120082 | 915.25 | 533 | 519 | 130.6 |
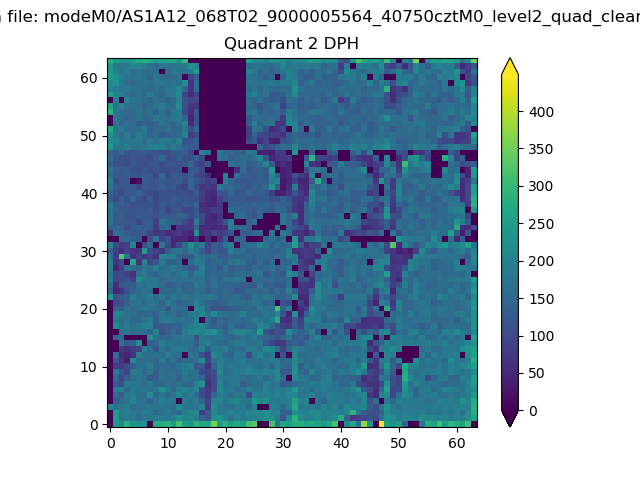
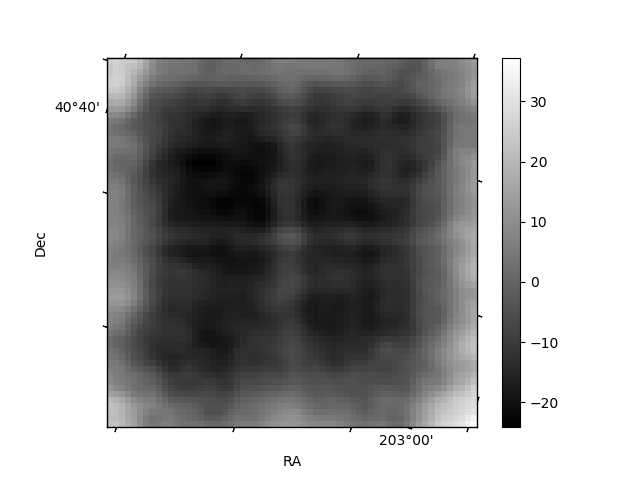
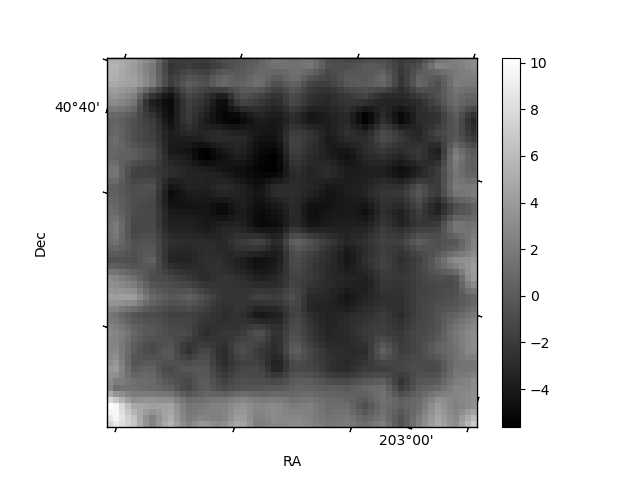
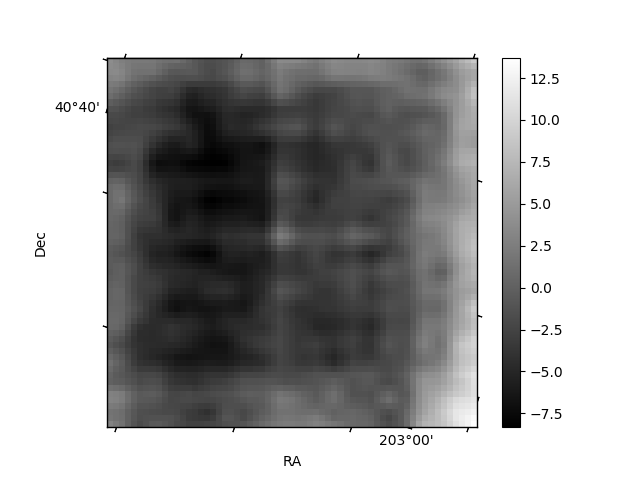
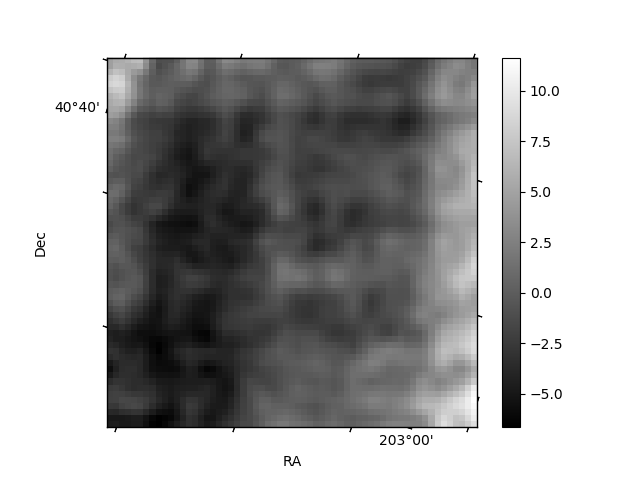
Histogram calculated using DETX and DETY for each event in the final _common_clean file
| Quadrant A | 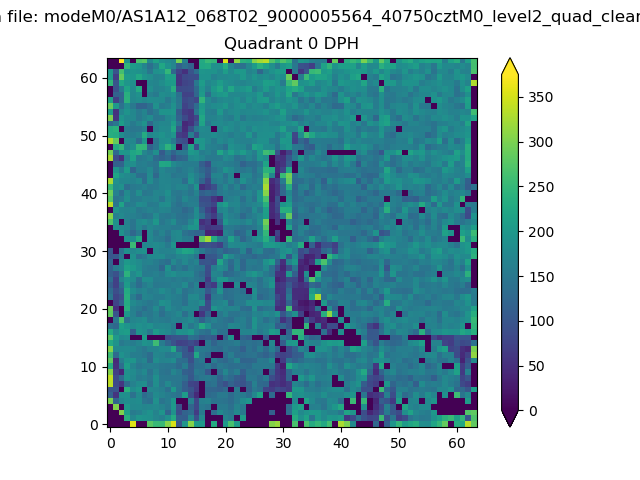 |
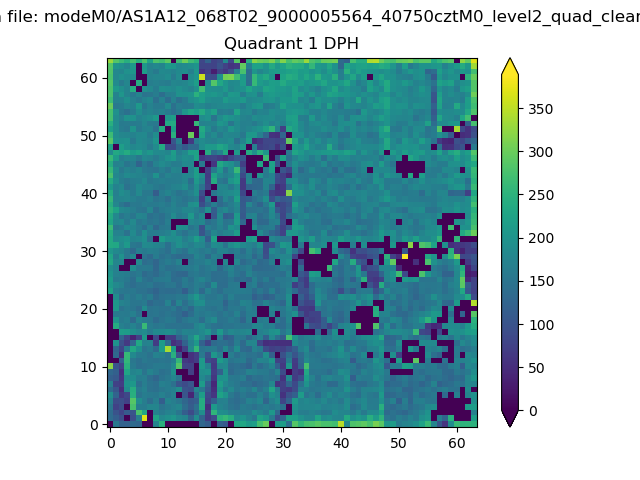 |
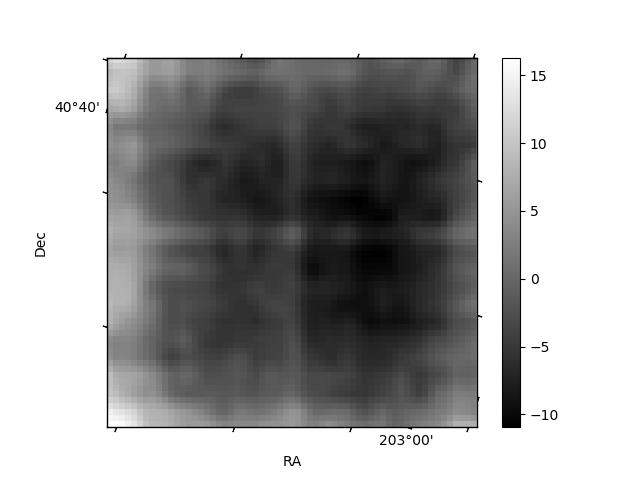
Quadrant B |
|---|---|---|---|
| Quadrant D | 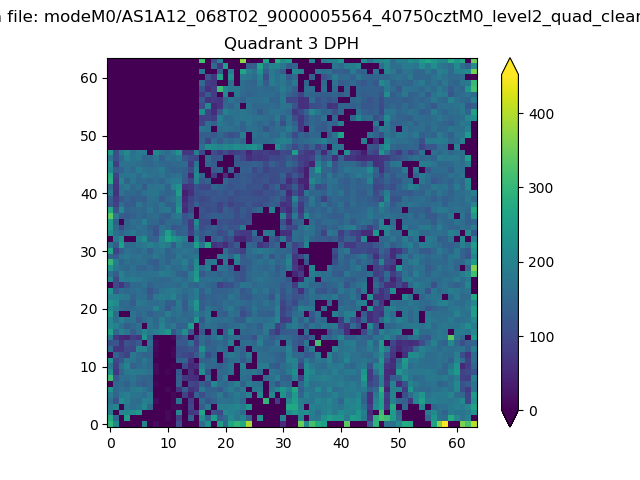 |
 |
Quadrant C |
| Plot type | Count rate plots | Images |
|---|---|---|
| Comparison with Poisson distribution Blue bars denote a histogram of data divided into 1 sec bins. Red curve is a Poisson curve with rate = median count rate of data. |
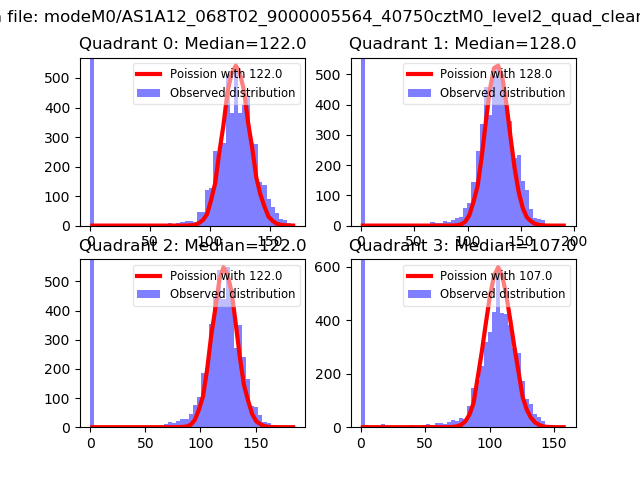 |
 |
| Quadrant-wise count rates Data is divided into 100 sec bins |
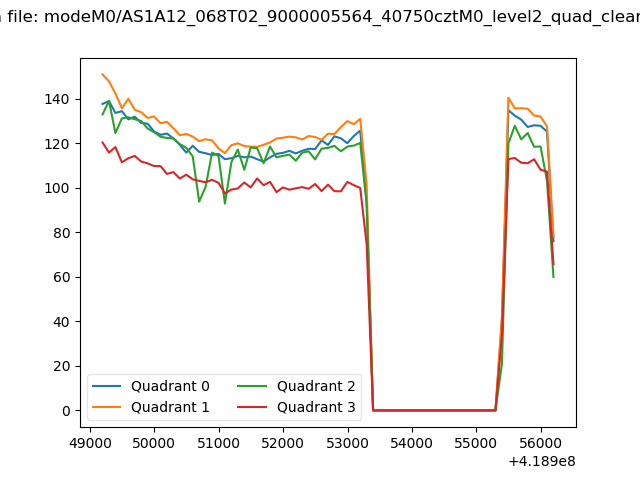 |
|
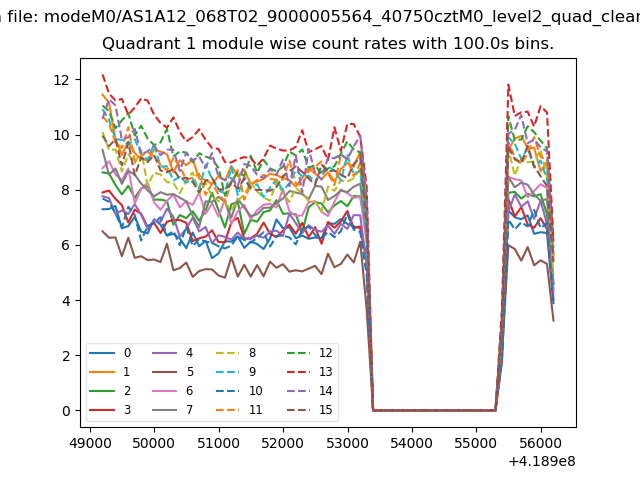
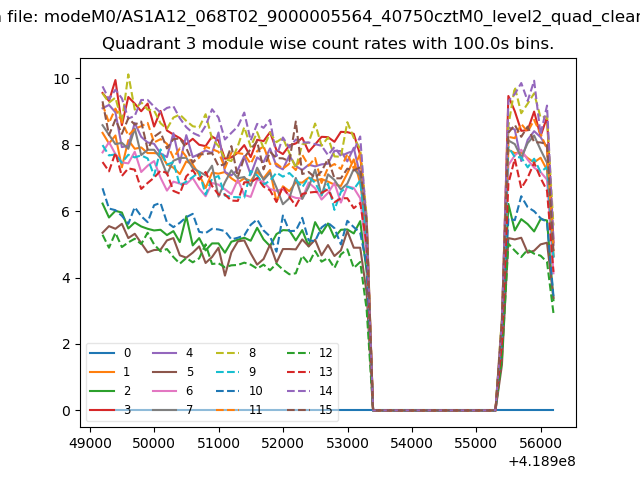
| Module-wise count rates for Quadrant A Data is divided into 100 sec bins |
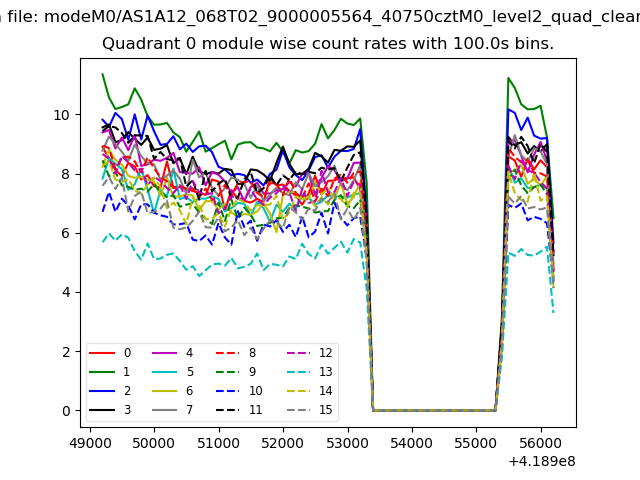 |
 |
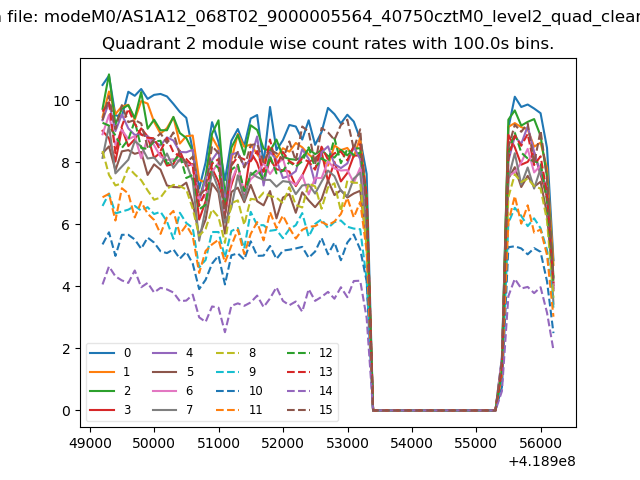
| Module-wise count rates for Quadrant B Data is divided into 100 sec bins |
 |
 |
| Module-wise count rates for Quadrant C Data is divided into 100 sec bins |
 |
 |
| Module-wise count rates for Quadrant D Data is divided into 100 sec bins |
 |
 |
| Parameter | Plot |
|---|---|
| CZT HV Monitor | 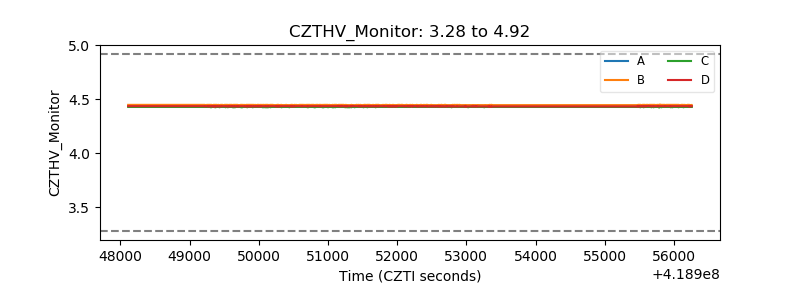 |
| D_VDD | 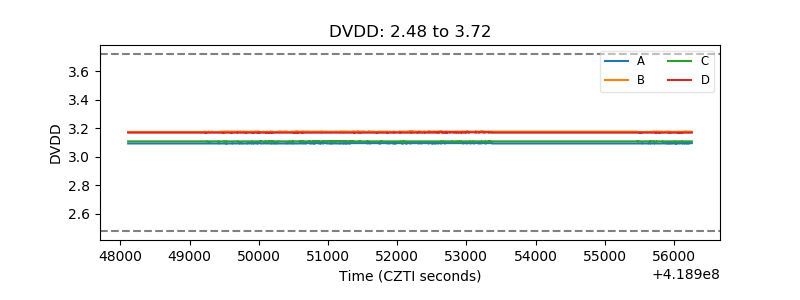 |
| Temperature 1 | 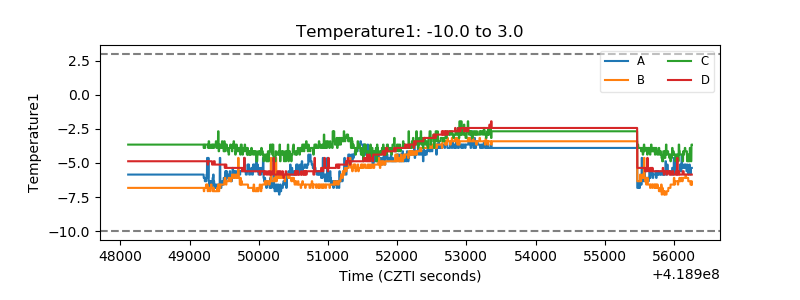 |
| Veto HV Monitor | 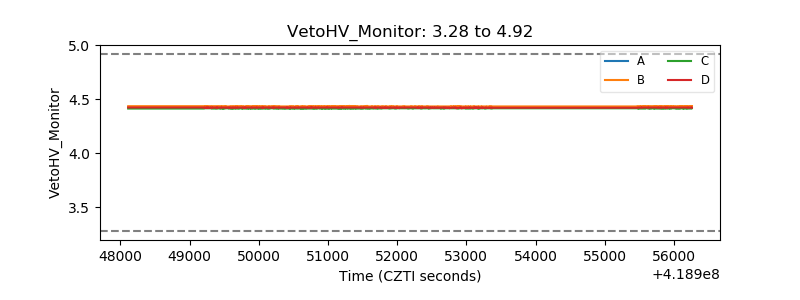 |
| Veto LLD | 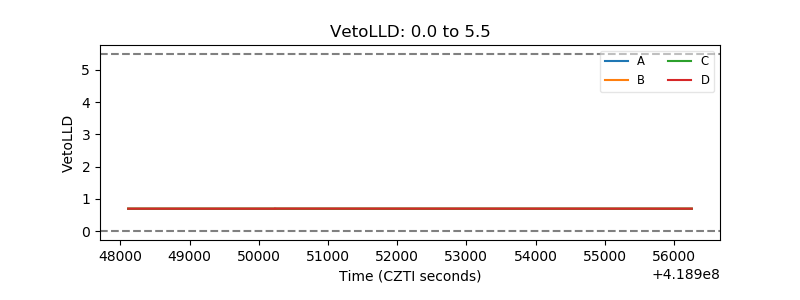 |
| Alpha Counter | 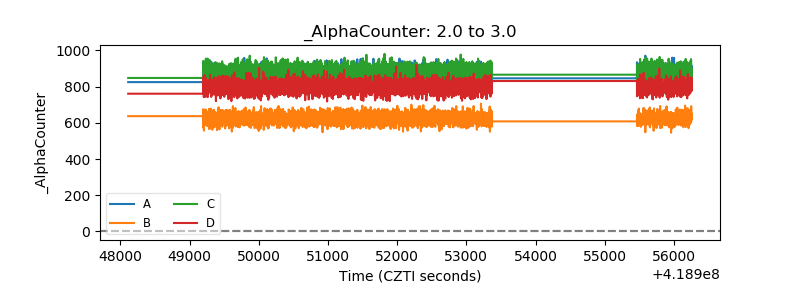 |
| _CPM_Rate |  |
| CZT Counter | 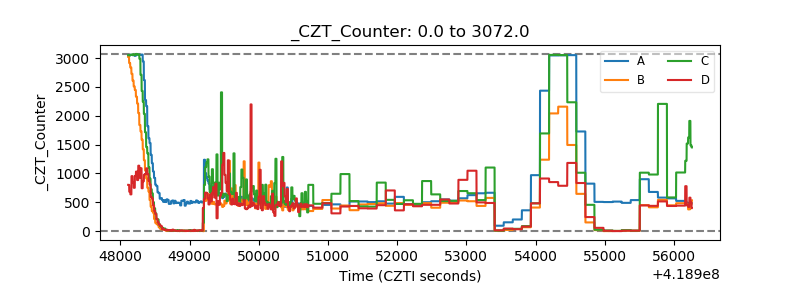 |
| +2.5 Volts monitor | 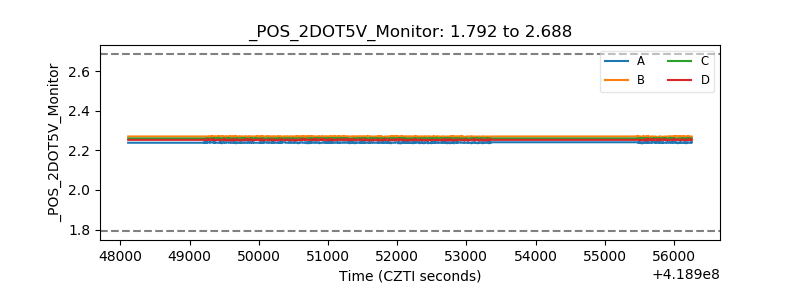 |
| +5 Volts monitor | 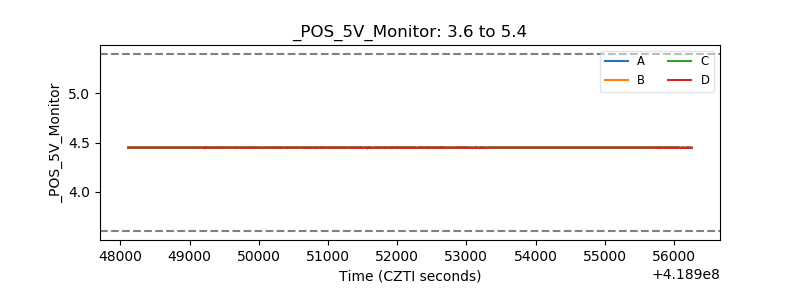 |
| _ROLL_ROT | 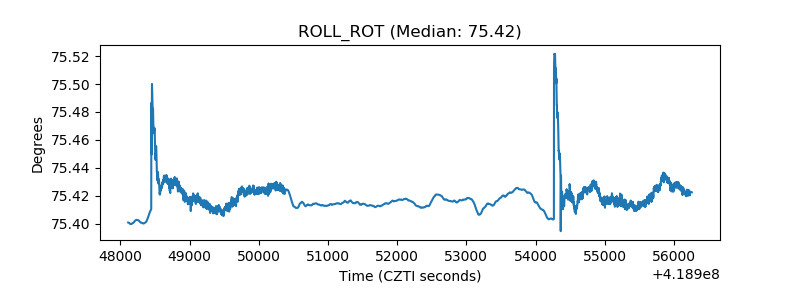 |
| _Roll_DEC | 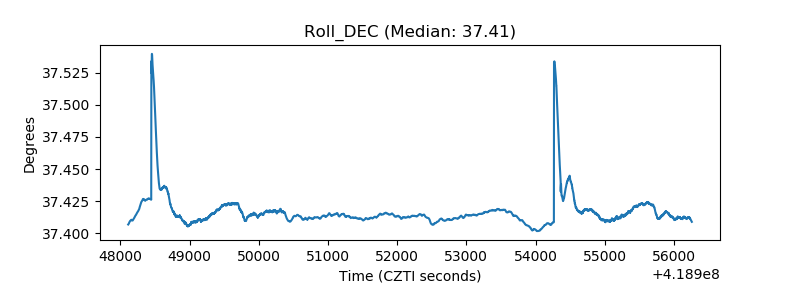 |
| _Roll_RA | 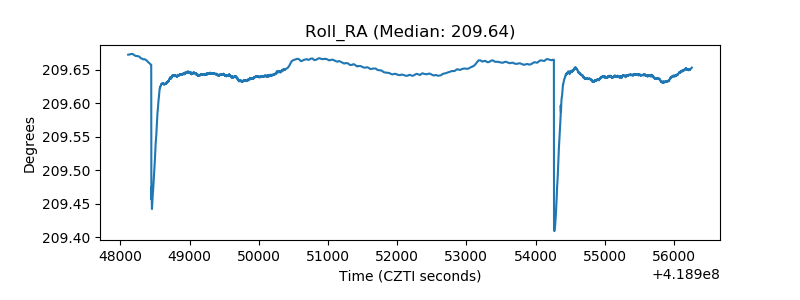 |
| Veto Counter | 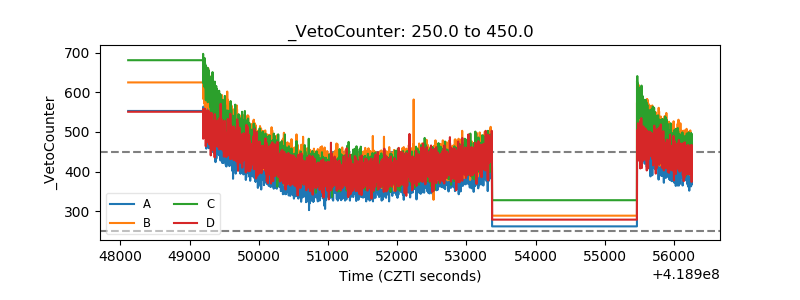 |