| Param | Original file | Final file |
|---|---|---|
| Filename | modeM0/AS1A12_068T02_9000005564_40751cztM0_level2.fits | modeM0/AS1A12_068T02_9000005564_40751cztM0_level2_quad_clean.evt |
| Size (bytes) | 343,146,240 | 85,049,280 |
| Size | 327.2 MB | 81.1 MB |
| Events in quadrant A | 2,835,669 | 585,049 |
| Events in quadrant B | 2,275,523 | 610,923 |
| Events in quadrant C | 4,489,776 | 555,804 |
| Events in quadrant D | 2,719,204 | 480,217 |
| Mode M0 | |||
|---|---|---|---|
| Quadrant | BADHDUFLAG | Total packets | Discarded packets |
| A | 0 | 11450 | 3 |
| B | 0 | 9957 | 2 |
| C | 0 | 16675 | 2 |
| D | 0 | 11470 | 2 |
| Mode SS | |||
|---|---|---|---|
| Quadrant | BADHDUFLAG | Total packets | Discarded packets |
| A | 0 | 98 | 0 |
| B | 0 | 98 | 0 |
| C | 0 | 98 | 0 |
| D | 0 | 98 | 0 |
| Mode M9 | |||
|---|---|---|---|
| Quadrant | BADHDUFLAG | Total packets | Discarded packets |
| A | 0 | 40 | 0 |
| B | 0 | 40 | 0 |
| C | 0 | 40 | 0 |
| D | 0 | 41 | 0 |
| Quadrant | Total seconds | Saturated seconds | Saturation percentage |
|---|---|---|---|
| A | 4900 | 16 | 0.326531% |
| B | 4900 | 10 | 0.204082% |
| C | 4900 | 309 | 6.306122% |
| D | 4900 | 499 | 10.183673% |
Noise dominated data is calculated using 1-second bins in cleaned event files. If a bin has >2000 counts, and if more than 50% of those come from <1% of pixels, then it is considered to be noise-dominated and hence unusable.
| Quadrant | # 1 sec bins | Bins with >0 counts | Bins with >2000 counts | High rate bins dominated by noise | Noise dominated (total time) | Noise dominated (detector-on time) | Marked lightcurve |
|---|---|---|---|---|---|---|---|
| A | 7024 | 4901 | 9 | 9 | 0.13% | 0.18% | 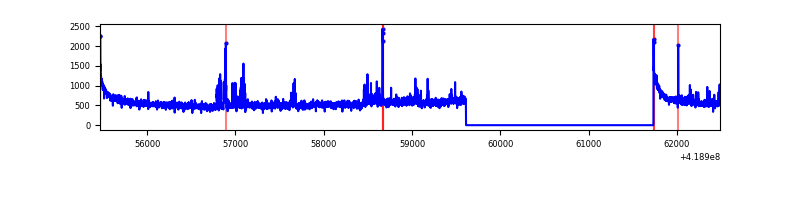 |
| B | 7024 | 4901 | 0 | 0 | 0.00% | 0.00% | 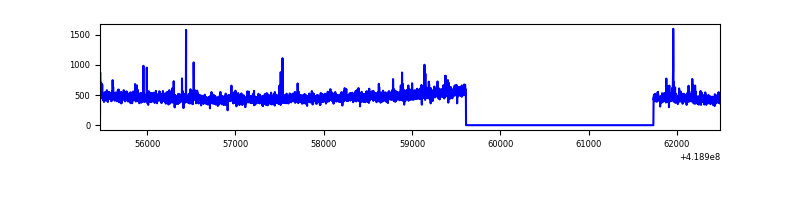 |
| C | 7024 | 4901 | 373 | 373 | 5.31% | 7.61% | 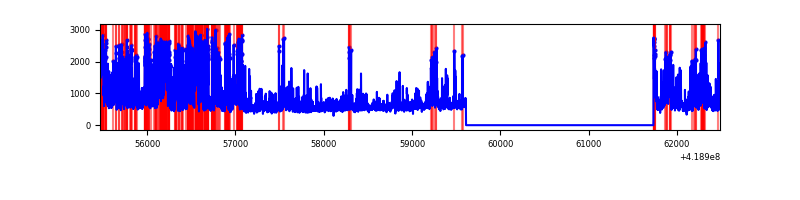 |
| D | 7023 | 4900 | 61 | 61 | 0.87% | 1.24% | 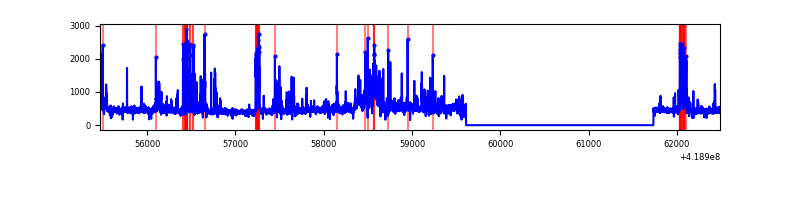 |
Top three noisy pixels from each quadrant. If the there are fewer than three noisy pixels in the level2.evt file, extra rows are filled as -1
| Pixel properties | Quadrant properties | ||||||
|---|---|---|---|---|---|---|---|
| Quadrant | DetID | PixID | Counts | Sigma | Mean | Median | Sigma |
| A | 10 | 83 | 460216 | 4044.96 | 559 | 548 | 113.6 |
| A | 6 | 10 | 86001 | 751.96 | 559 | 548 | 113.6 |
| A | 12 | 189 | 68189 | 595.22 | 559 | 548 | 113.6 |
| B | 0 | 229 | 38109 | 350.33 | 557 | 544 | 107.2 |
| B | 4 | 170 | 21198 | 192.62 | 557 | 544 | 107.2 |
| B | 4 | 171 | 17125 | 154.63 | 557 | 544 | 107.2 |
| C | 9 | 187 | 2129134 | 17139.01 | 533 | 538 | 124.2 |
| C | 15 | 214 | 209928 | 1685.96 | 533 | 538 | 124.2 |
| C | 0 | 10 | 63143 | 504.08 | 533 | 538 | 124.2 |
| D | 2 | 249 | 379083 | 3014.32 | 508 | 494 | 125.6 |
| D | 12 | 191 | 143702 | 1140.22 | 508 | 494 | 125.6 |
| D | 13 | 249 | 107608 | 852.84 | 508 | 494 | 125.6 |
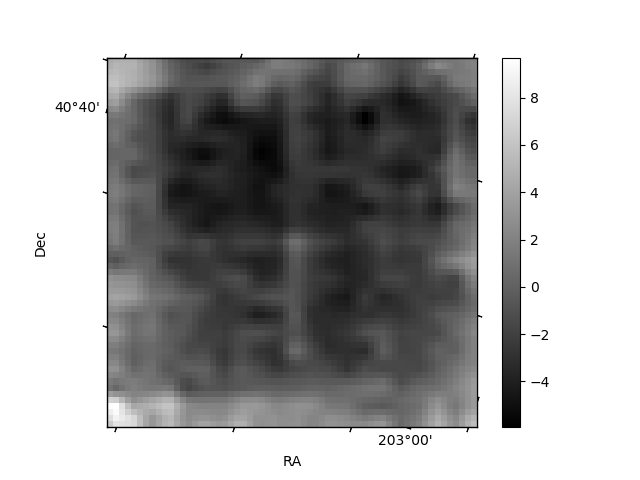
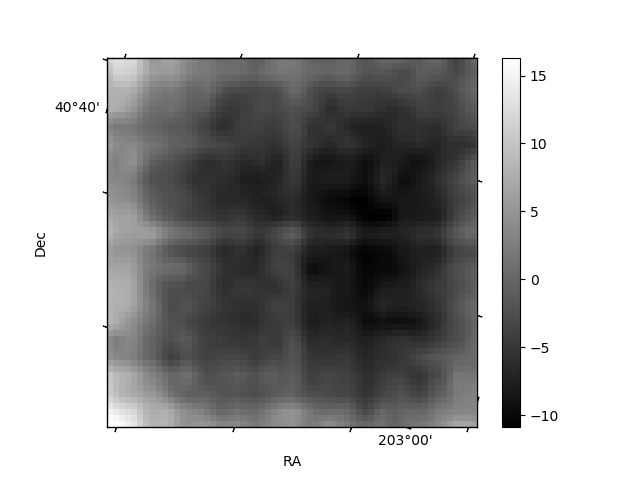
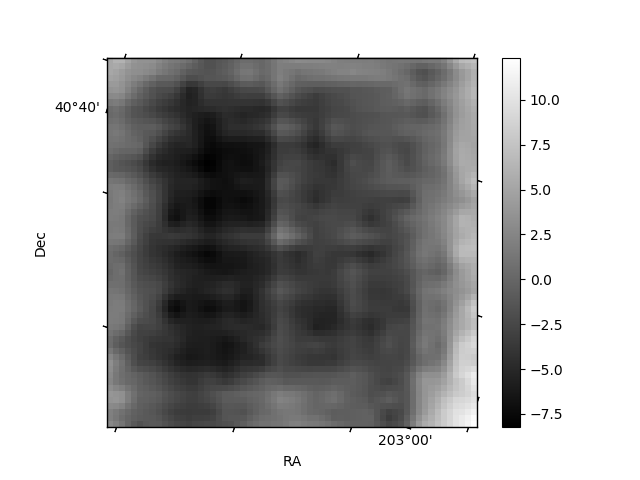
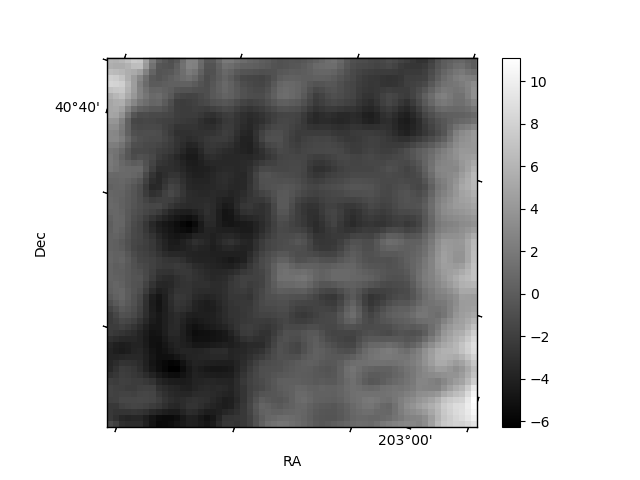
Histogram calculated using DETX and DETY for each event in the final _common_clean file
| Quadrant A | 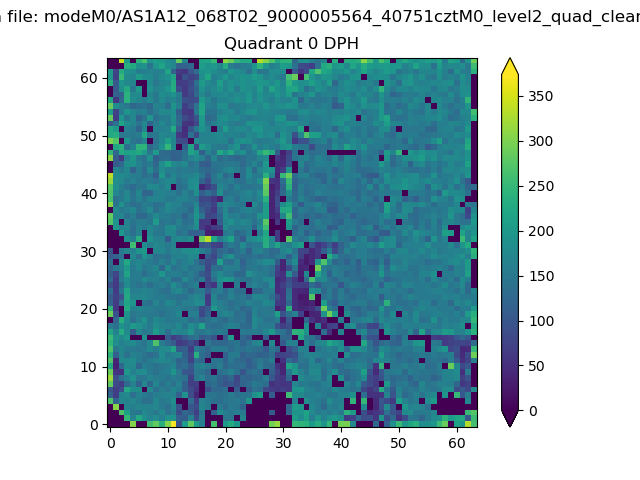 |
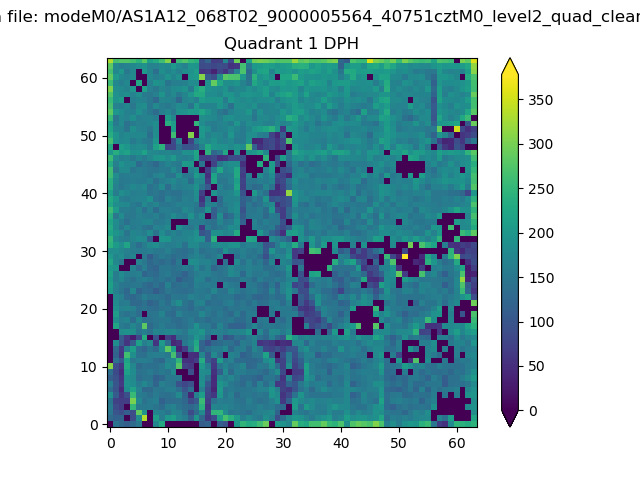 |
Quadrant B |
|---|---|---|---|
| Quadrant D | 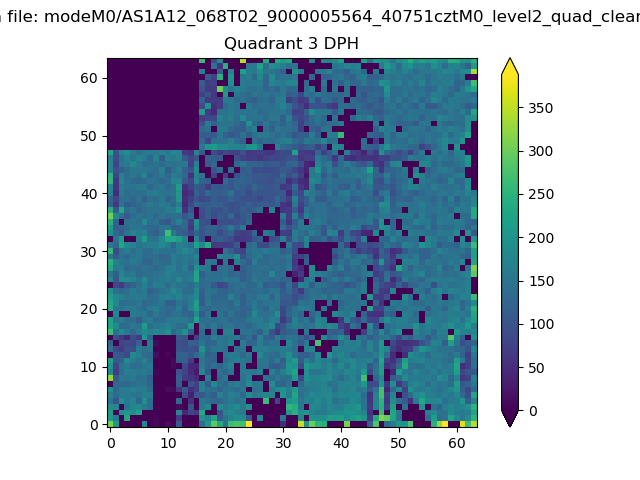 |
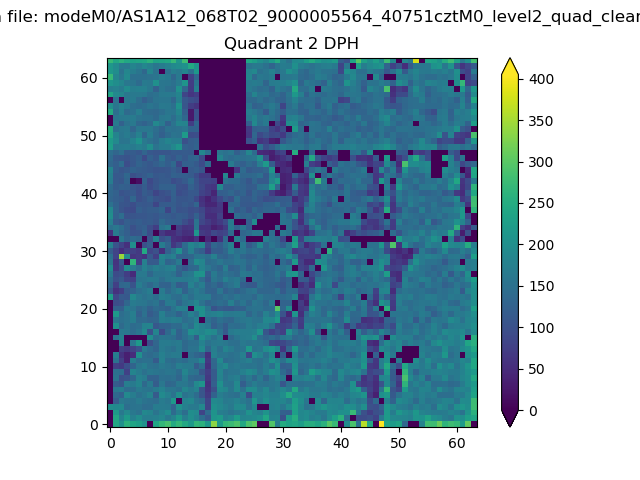 |
Quadrant C |
| Plot type | Count rate plots | Images |
|---|---|---|
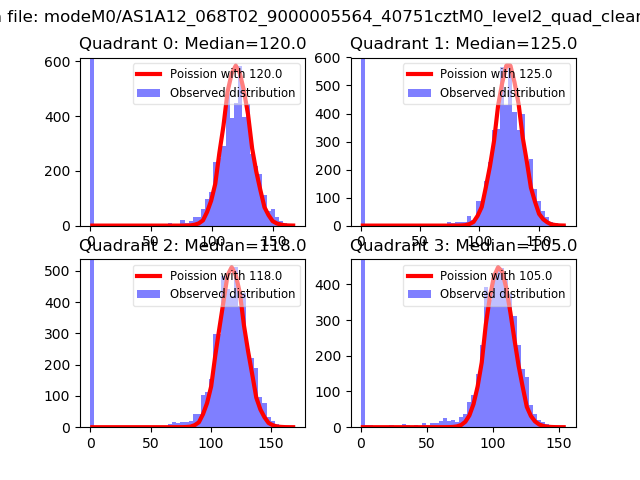
| Comparison with Poisson distribution Blue bars denote a histogram of data divided into 1 sec bins. Red curve is a Poisson curve with rate = median count rate of data. |
 |
 |
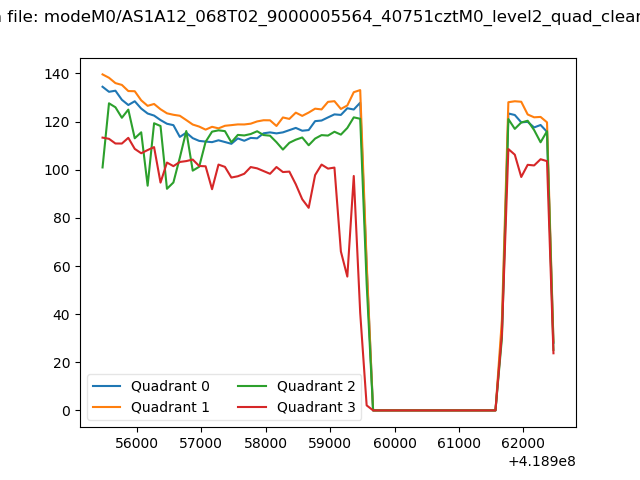
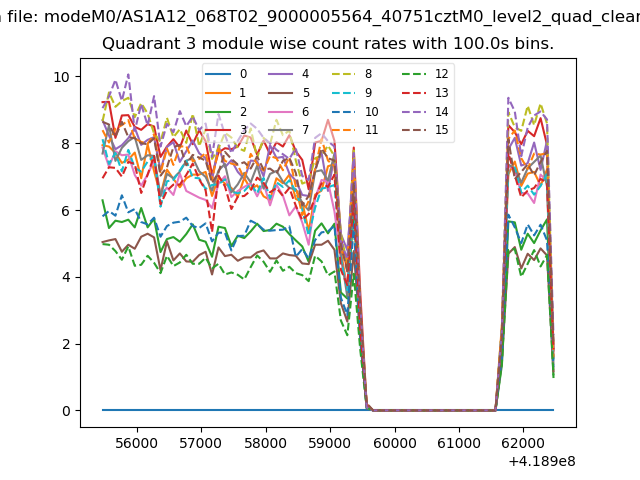
| Quadrant-wise count rates Data is divided into 100 sec bins |
 |
|
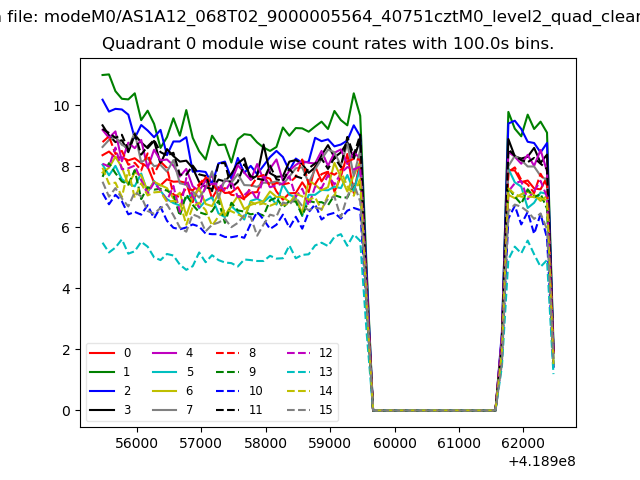
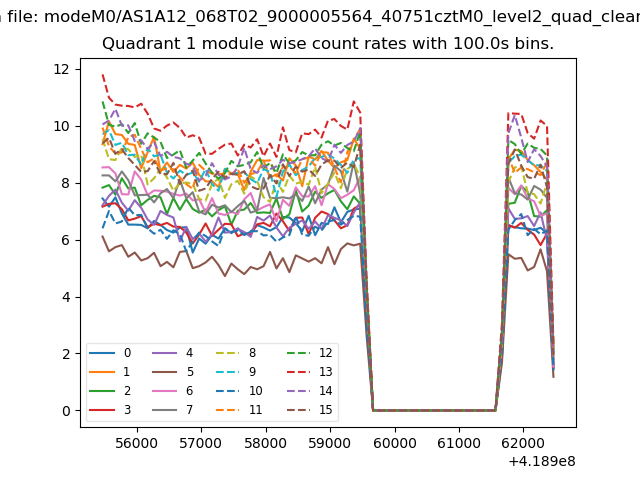
| Module-wise count rates for Quadrant A Data is divided into 100 sec bins |
 |
 |
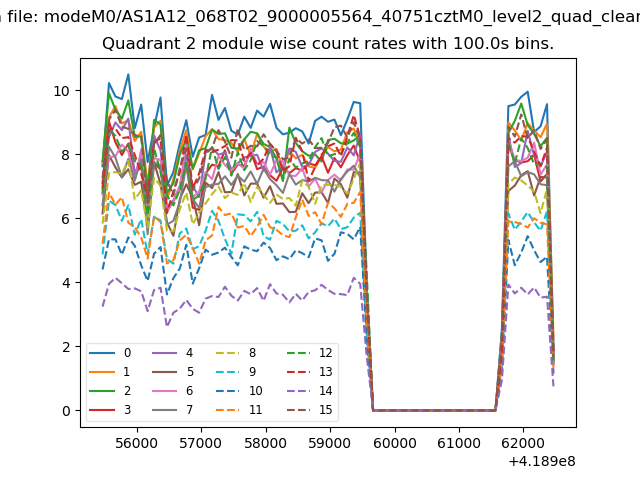
| Module-wise count rates for Quadrant B Data is divided into 100 sec bins |
 |
 |
| Module-wise count rates for Quadrant C Data is divided into 100 sec bins |
 |
 |
| Module-wise count rates for Quadrant D Data is divided into 100 sec bins |
 |
 |
| Parameter | Plot |
|---|---|
| CZT HV Monitor | 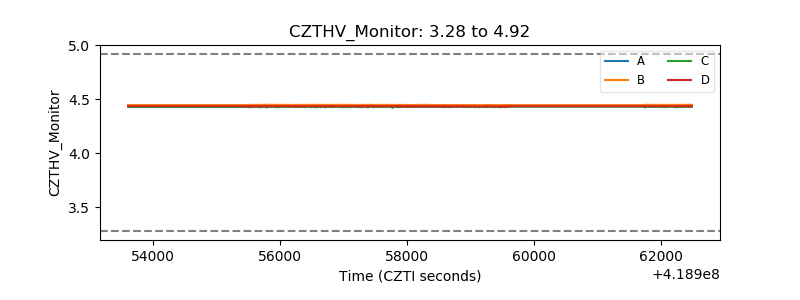 |
| D_VDD | 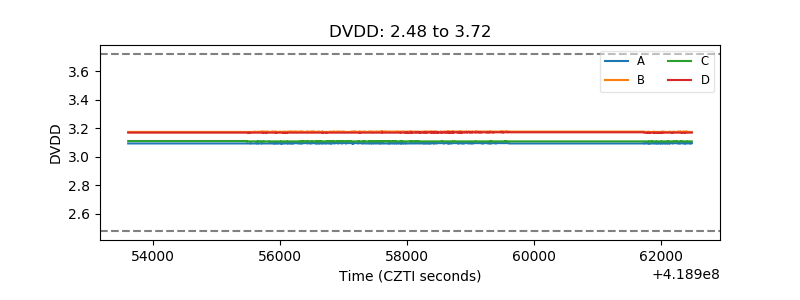 |
| Temperature 1 | 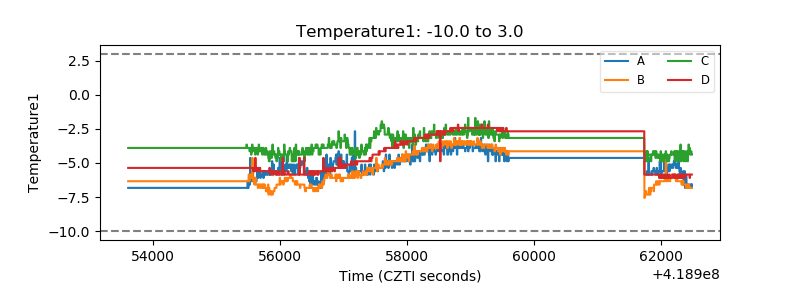 |
| Veto HV Monitor | 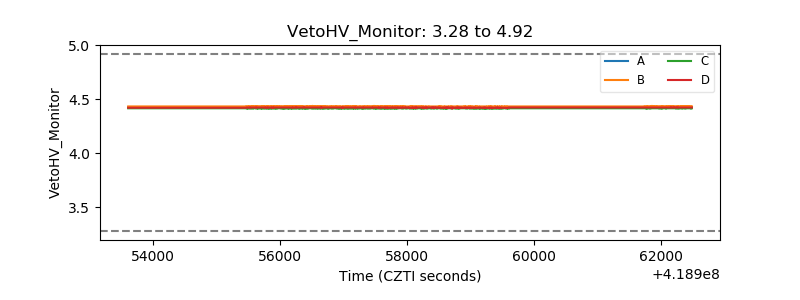 |
| Veto LLD | 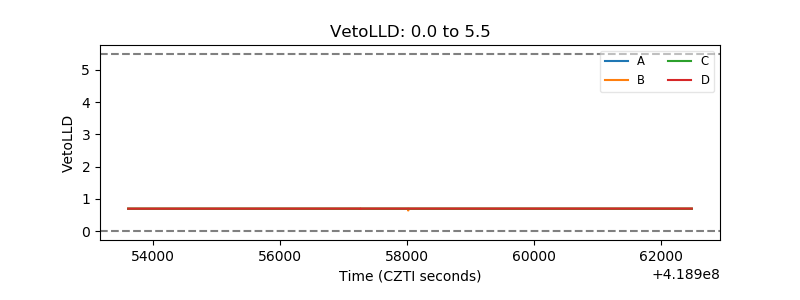 |
| Alpha Counter |  |
| _CPM_Rate | 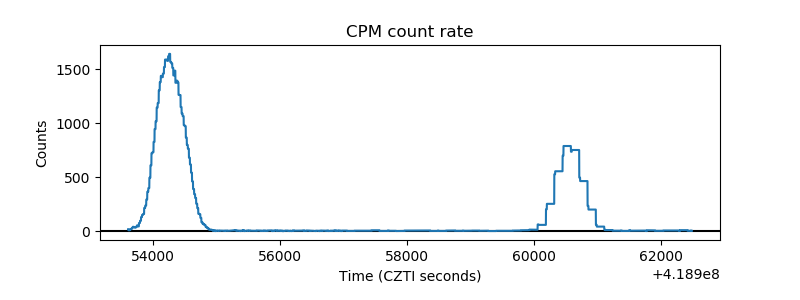 |
| CZT Counter | 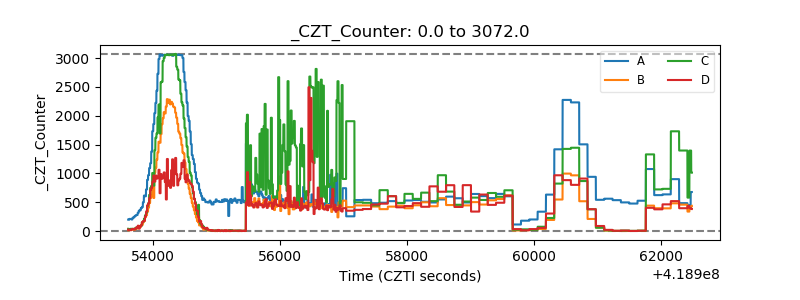 |
| +2.5 Volts monitor | 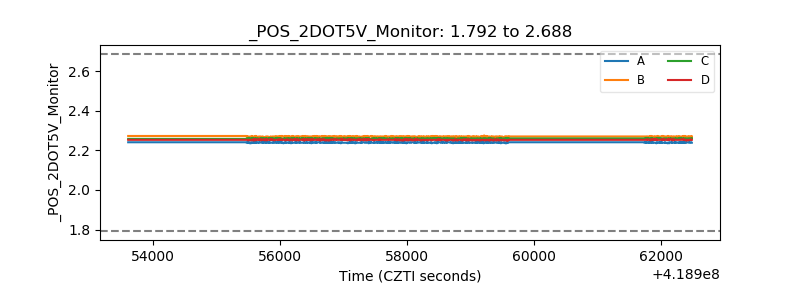 |
| +5 Volts monitor | 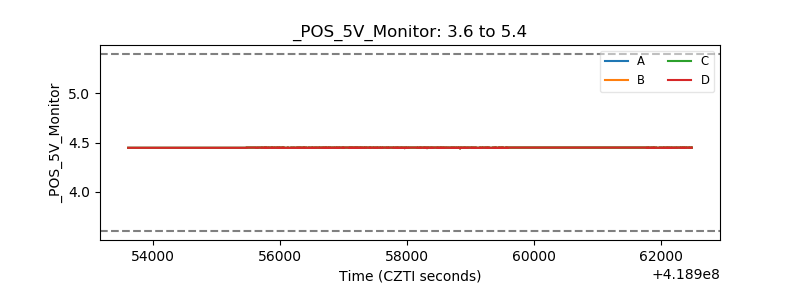 |
| _ROLL_ROT | 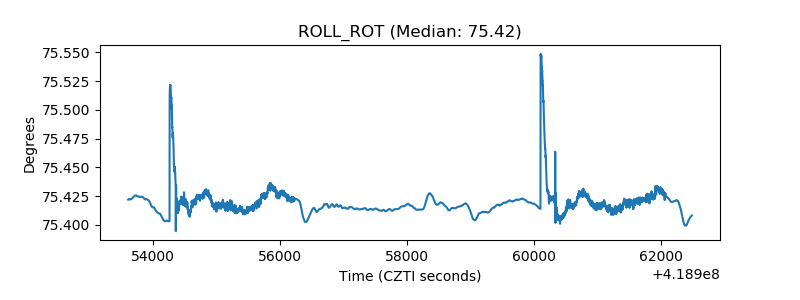 |
| _Roll_DEC | 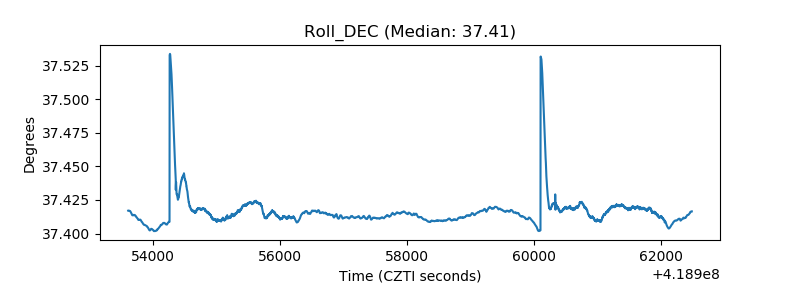 |
| _Roll_RA | 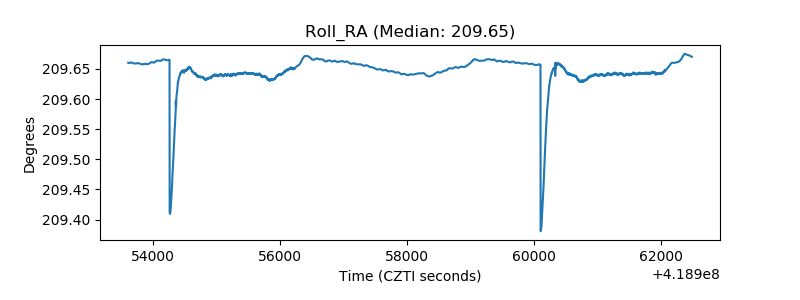 |
| Veto Counter | 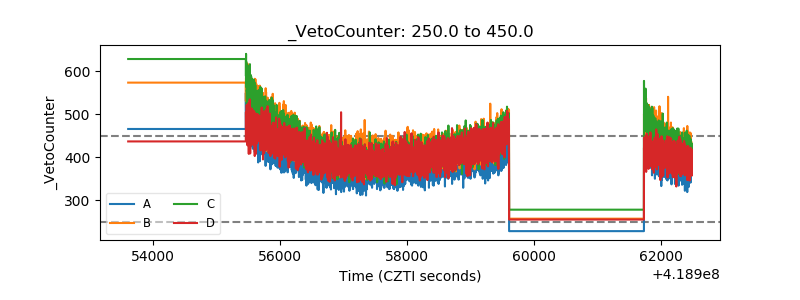 |