| Param | Original file | Final file |
|---|---|---|
| Filename | modeM0/AS1A12_068T02_9000005564_40752cztM0_level2.fits | modeM0/AS1A12_068T02_9000005564_40752cztM0_level2_quad_clean.evt |
| Size (bytes) | 346,867,200 | 81,587,520 |
| Size | 330.8 MB | 77.8 MB |
| Events in quadrant A | 2,818,190 | 561,688 |
| Events in quadrant B | 2,228,991 | 585,614 |
| Events in quadrant C | 4,983,459 | 523,497 |
| Events in quadrant D | 2,425,146 | 453,485 |
| Mode M0 | |||
|---|---|---|---|
| Quadrant | BADHDUFLAG | Total packets | Discarded packets |
| A | 0 | 11322 | 3 |
| B | 0 | 10011 | 2 |
| C | 0 | 18221 | 2 |
| D | 0 | 10760 | 2 |
| Mode SS | |||
|---|---|---|---|
| Quadrant | BADHDUFLAG | Total packets | Discarded packets |
| A | 0 | 100 | 0 |
| B | 0 | 100 | 0 |
| C | 0 | 100 | 0 |
| D | 0 | 100 | 0 |
| Mode M9 | |||
|---|---|---|---|
| Quadrant | BADHDUFLAG | Total packets | Discarded packets |
| A | 0 | 34 | 0 |
| B | 0 | 34 | 0 |
| C | 0 | 34 | 0 |
| D | 0 | 35 | 0 |
| Quadrant | Total seconds | Saturated seconds | Saturation percentage |
|---|---|---|---|
| A | 4928 | 12 | 0.243506% |
| B | 4928 | 7 | 0.142045% |
| C | 4928 | 418 | 8.482143% |
| D | 4928 | 574 | 11.647727% |
Noise dominated data is calculated using 1-second bins in cleaned event files. If a bin has >2000 counts, and if more than 50% of those come from <1% of pixels, then it is considered to be noise-dominated and hence unusable.
| Quadrant | # 1 sec bins | Bins with >0 counts | Bins with >2000 counts | High rate bins dominated by noise | Noise dominated (total time) | Noise dominated (detector-on time) | Marked lightcurve |
|---|---|---|---|---|---|---|---|
| A | 7021 | 4929 | 8 | 8 | 0.11% | 0.16% | 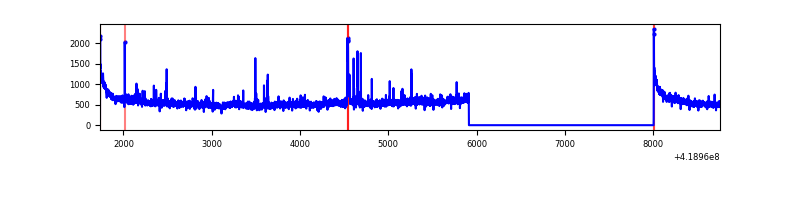 |
| B | 7021 | 4929 | 3 | 3 | 0.04% | 0.06% | 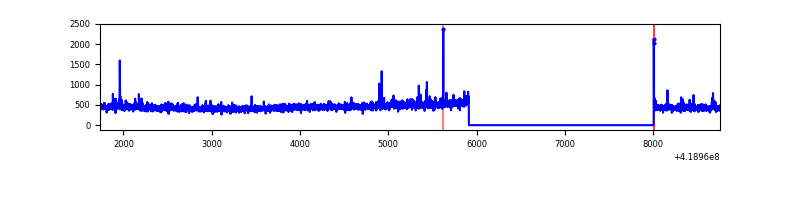 |
| C | 7020 | 4927 | 426 | 426 | 6.07% | 8.65% | 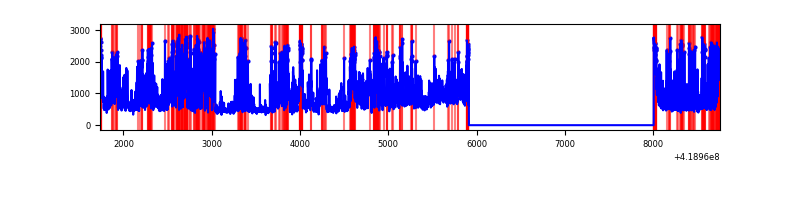 |
| D | 7021 | 4928 | 51 | 51 | 0.73% | 1.03% | 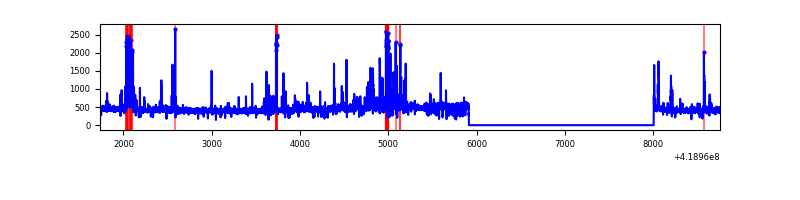 |
Top three noisy pixels from each quadrant. If the there are fewer than three noisy pixels in the level2.evt file, extra rows are filled as -1
| Pixel properties | Quadrant properties | ||||||
|---|---|---|---|---|---|---|---|
| Quadrant | DetID | PixID | Counts | Sigma | Mean | Median | Sigma |
| A | 10 | 83 | 458126 | 4073.26 | 552 | 542 | 112.3 |
| A | 6 | 10 | 114292 | 1012.57 | 552 | 542 | 112.3 |
| A | 12 | 189 | 54616 | 481.35 | 552 | 542 | 112.3 |
| B | 0 | 229 | 39646 | 367.94 | 550 | 533 | 106.3 |
| B | 4 | 171 | 14726 | 133.51 | 550 | 533 | 106.3 |
| B | 12 | 111 | 13665 | 123.53 | 550 | 533 | 106.3 |
| C | 9 | 187 | 2645345 | 21811.4 | 518 | 521 | 121.3 |
| C | 15 | 214 | 211417 | 1739.22 | 518 | 521 | 121.3 |
| C | 0 | 10 | 89348 | 732.54 | 518 | 521 | 121.3 |
| D | 2 | 249 | 231136 | 1892.16 | 493 | 478 | 121.9 |
| D | 12 | 191 | 160650 | 1313.94 | 493 | 478 | 121.9 |
| D | 2 | 250 | 32569 | 263.25 | 493 | 478 | 121.9 |
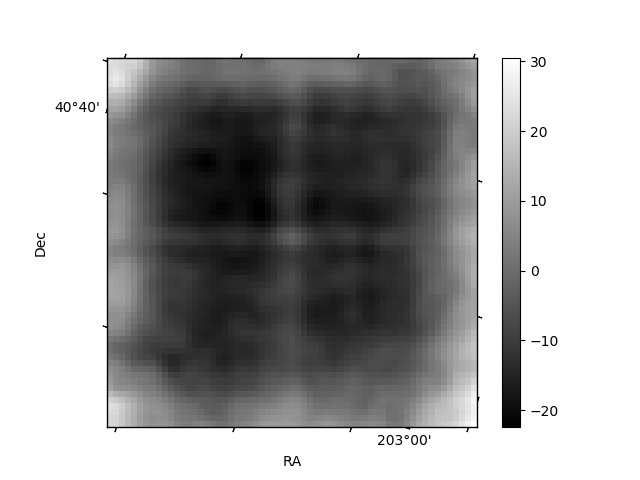
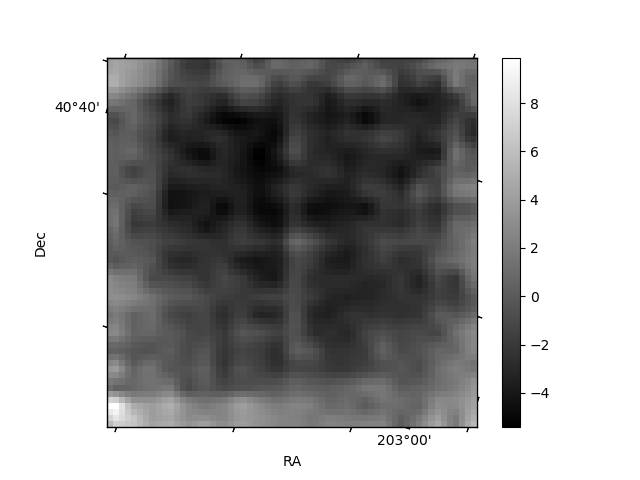
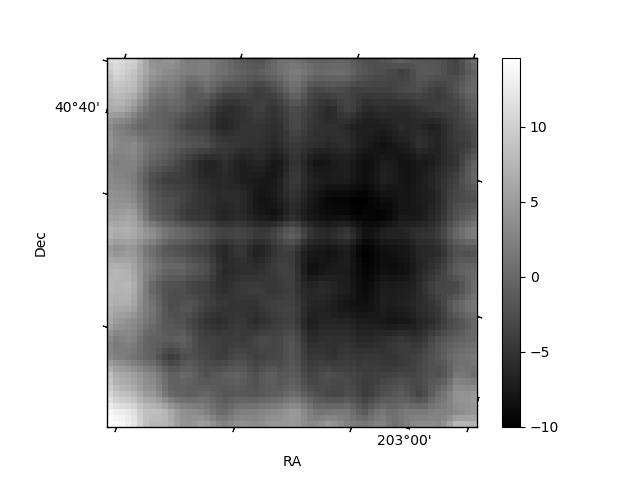
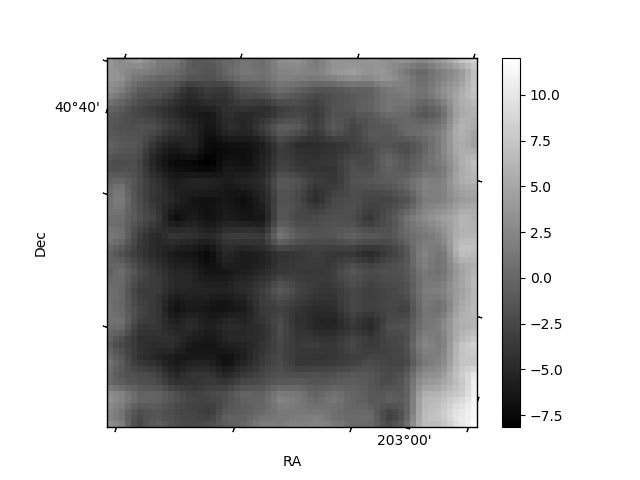
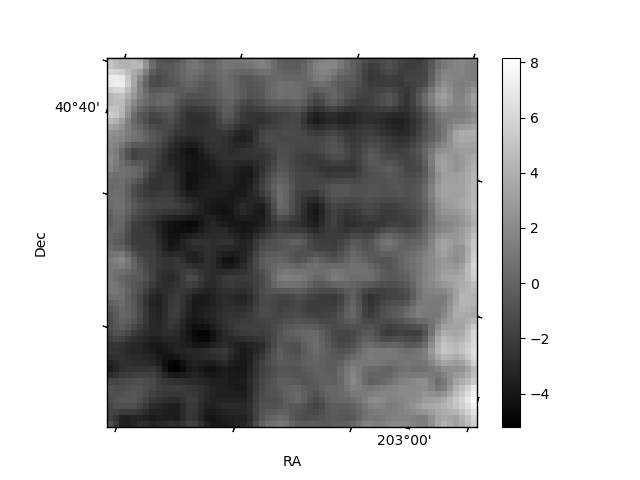
Histogram calculated using DETX and DETY for each event in the final _common_clean file
| Quadrant A | 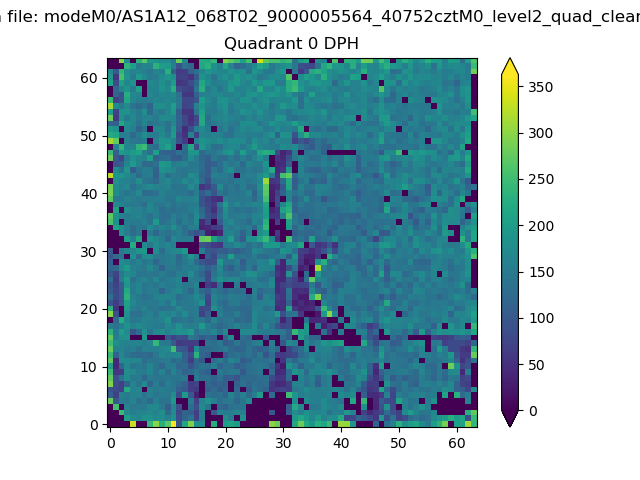 |
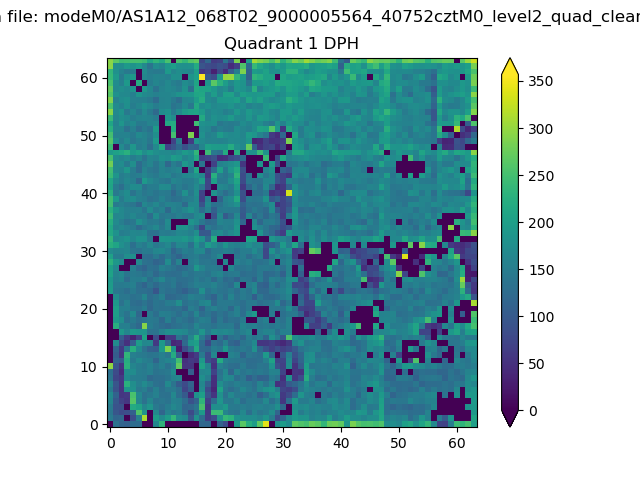 |
Quadrant B |
|---|---|---|---|
| Quadrant D | 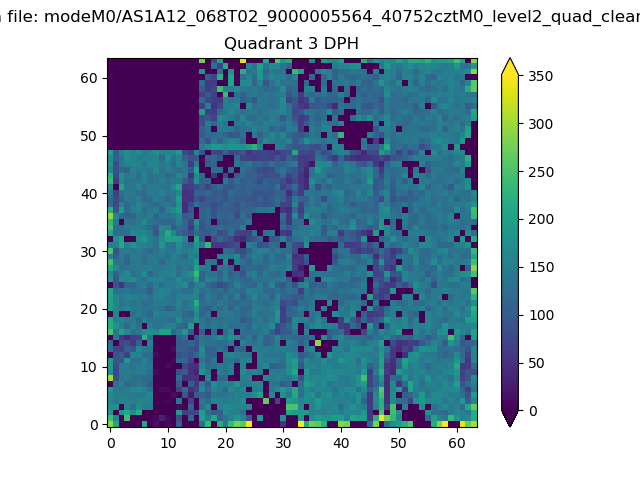 |
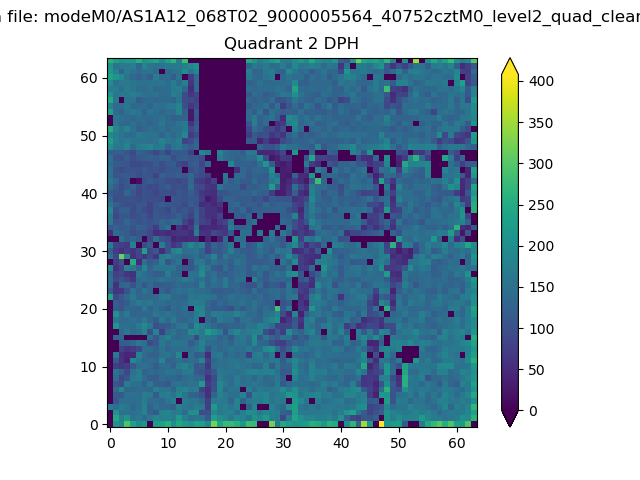 |
Quadrant C |
| Plot type | Count rate plots | Images |
|---|---|---|
| Comparison with Poisson distribution Blue bars denote a histogram of data divided into 1 sec bins. Red curve is a Poisson curve with rate = median count rate of data. |
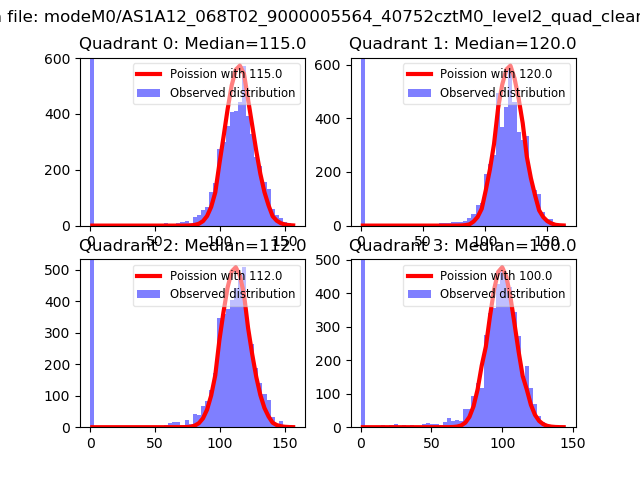 |
 |
| Quadrant-wise count rates Data is divided into 100 sec bins |
 |
|
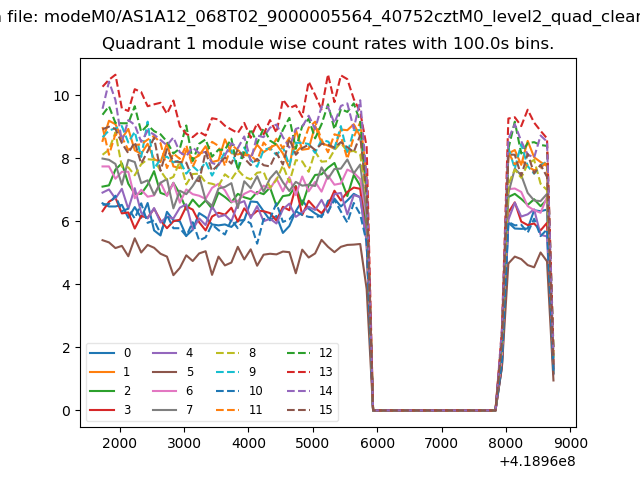
| Module-wise count rates for Quadrant A Data is divided into 100 sec bins |
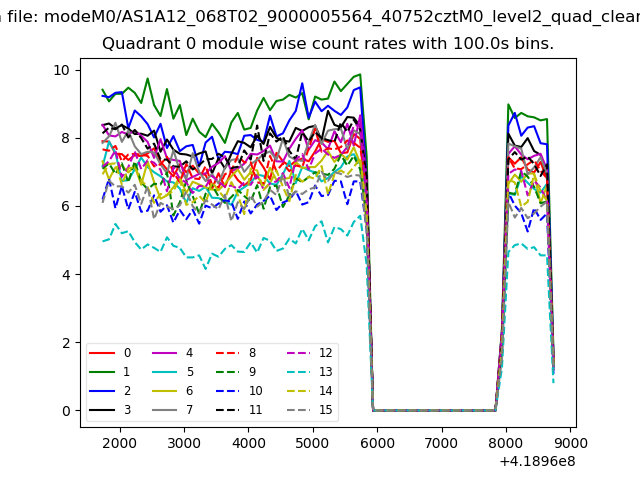 |
 |
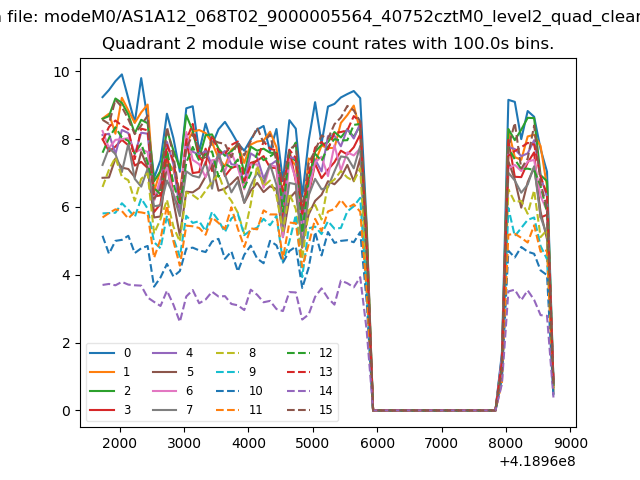
| Module-wise count rates for Quadrant B Data is divided into 100 sec bins |
 |
 |
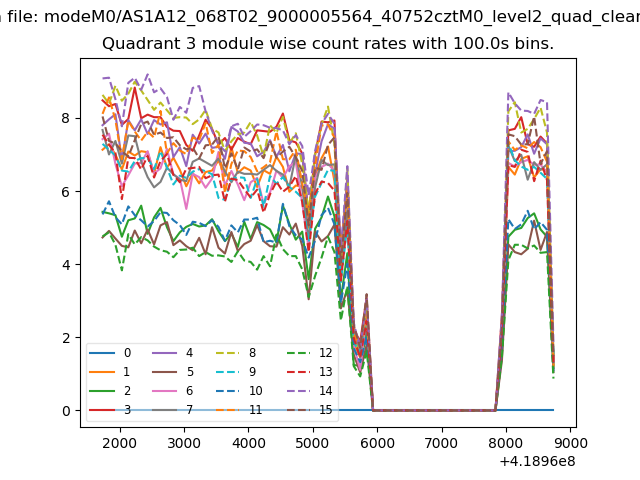
| Module-wise count rates for Quadrant C Data is divided into 100 sec bins |
 |
 |
| Module-wise count rates for Quadrant D Data is divided into 100 sec bins |
 |
 |
| Parameter | Plot |
|---|---|
| CZT HV Monitor | 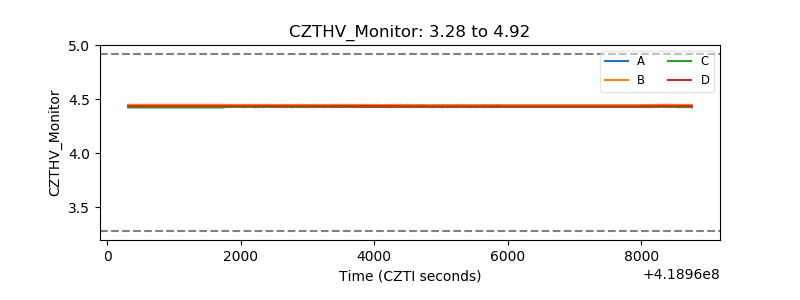 |
| D_VDD | 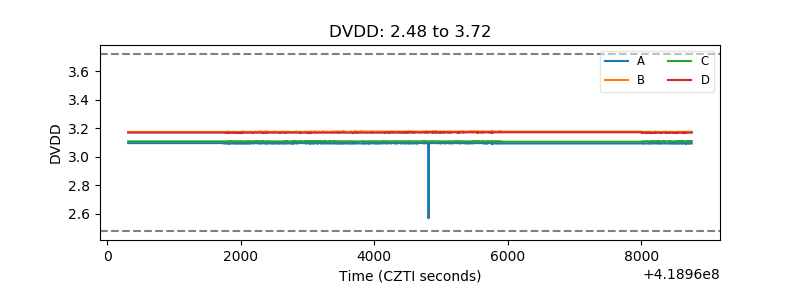 |
| Temperature 1 | 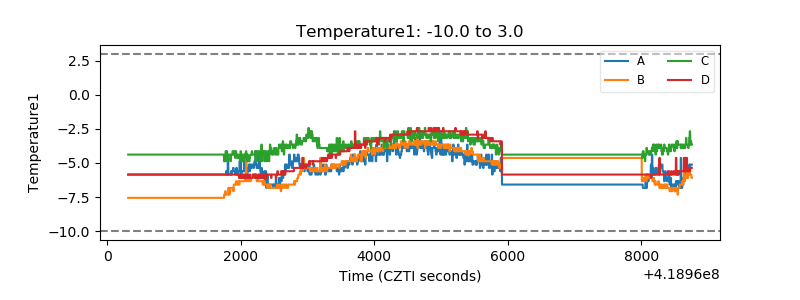 |
| Veto HV Monitor | 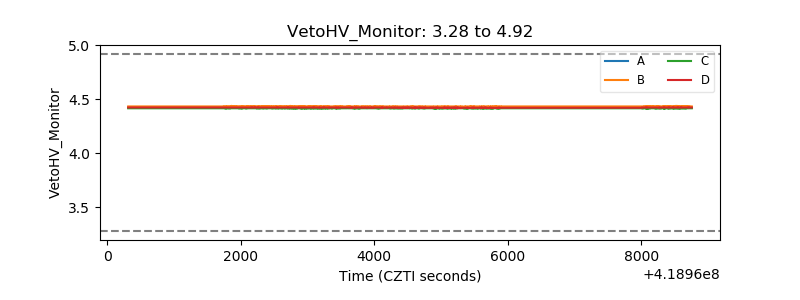 |
| Veto LLD | 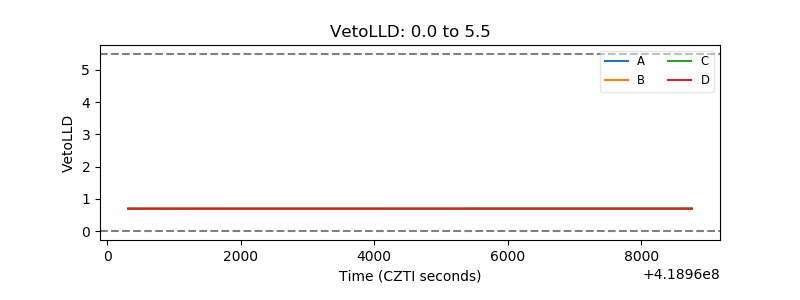 |
| Alpha Counter | 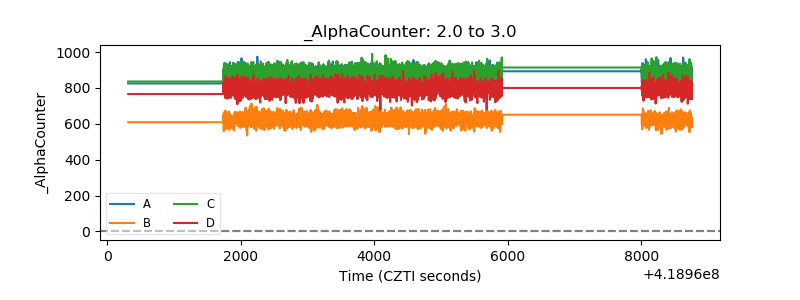 |
| _CPM_Rate | 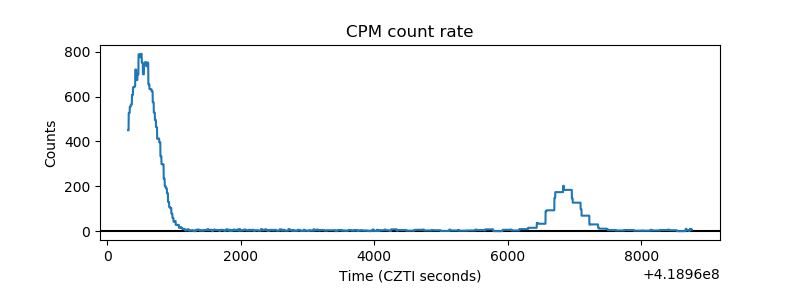 |
| CZT Counter | 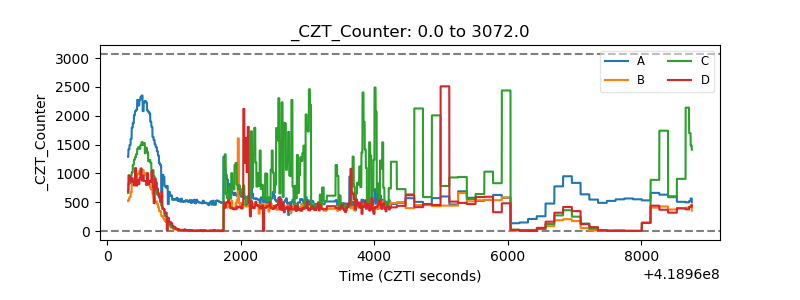 |
| +2.5 Volts monitor | 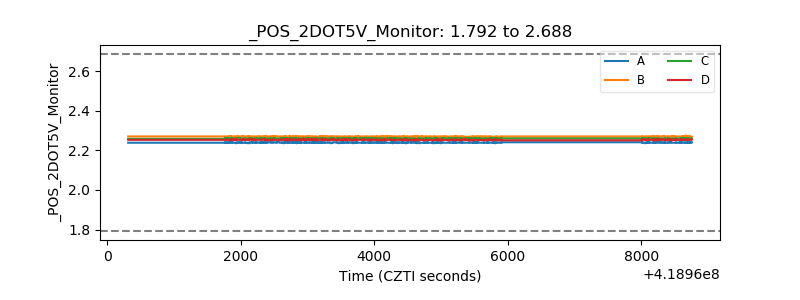 |
| +5 Volts monitor |  |
| _ROLL_ROT | 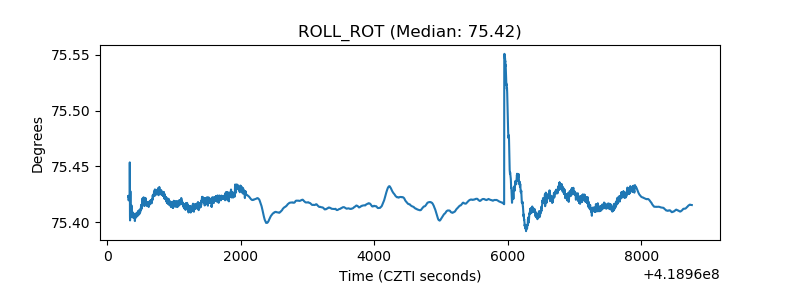 |
| _Roll_DEC | 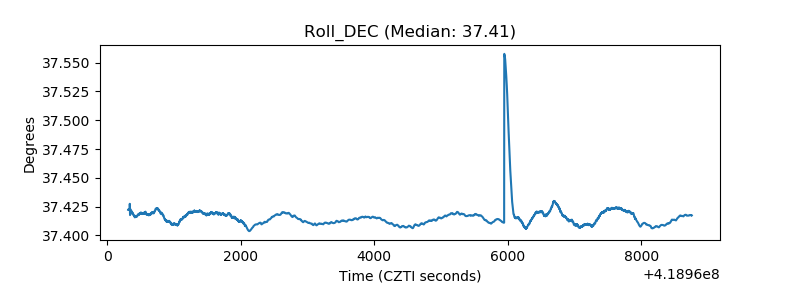 |
| _Roll_RA | 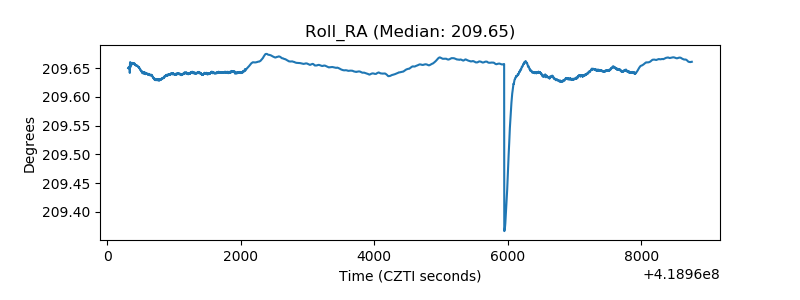 |
| Veto Counter | 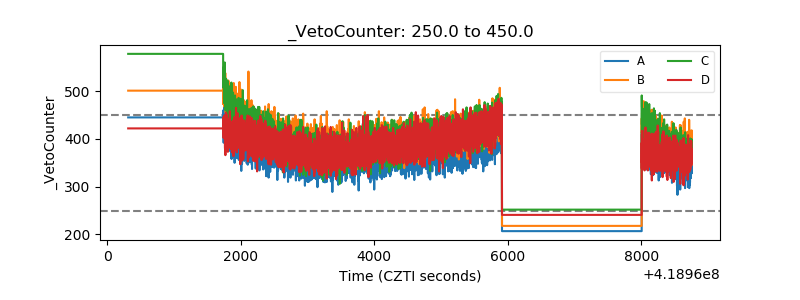 |